Turkish Journal of Field Crops, 2010, 15(2): 108-113
DETERMINATION OF GENETIC VARIATION AND RELATIONSHIP IN TURKISH
BARLEY CULTIVARS BY HORDEIN AND RAPD MARKERS
Hulya S PAH1* Taner AKAR1 Mehmet Ali YILDIZ2 Ismail SAYIM1 1
Central Research Institute for Field Crops, P. O. Box 24, 06042 Yenimahalle-Ankara, 2
Biometry and Genetic Department, Agricultural Faculty, Ankara University, 06110 D kap -Ankara *
Corresponding author:[email protected]
ABSTRACT
Genetic variation and relationships among thirty four barley cultivars (H. vulgare L.) improved in Turkey were assessed by hordeins and RAPDs. Totally, 15 different hordein patterns were observed among 34 cultivars and twelve of these were cultivar specific. In comparison to hordeins, the RAPD variation observed among cultivars was higher and 80 % of these scorable bands were polymorphic.Genetic similarity (GS) calculated on hordein and RAPD data ranged from0.52 to 1.00 and0.57 to 1.00,respectively.Cluster analyses based on hordein data showed that most of the cultivars are closely related in genetical point of view. The dendrogram of hordeins were completely different from those of RAPDs and they couldn’t precisely separate the barley cultivars. In addition to these, the level of polymorphism detected with hordein was lower than that of with RAPDs. Correspondence analysis by using two marker systems showed that RAPD data could distinguish almost all barley cultivars except Tokak 157/37 and Bülbül89, whereas hordein data were not able to perform to distinguish barley cultivars like RAPDs. Some polymorphic and repeatable RAPDs markers should be equipped with morphologic markers in order to identify candidate cultivars and registered cultivars before and after registration procedure.
Keywords: barley, cultivar identification, genetic relationship, hordein, RAPDs
INTRODUCTION
The correct and reliable identification of barley cultivars are of great commercial and agricultural importance due to the fact that feeding, malting properties and resistance to certain diseases are cultivar dependent. Although barley cultivars can be identified on basis of morpho-physiological and kernel characteristics, many cultivars cannot be distinguished by using these traits. Sometimes, it is necessary to use biochemical and molecular methods for complete identification. Biochemical markers such as isozymes, and proteins (hordein) could be used as an effective and exact method for barley cultivar identification. These methods were used by scientists to distinguish many European, Australian, Canadian and United States barley cultivars (Autran & Scriban 1977; Shewry et al. 1978; Marchylo & Laberge 1980; Kapala 1981; Cooke & Cliff 1983; Montembault et al. 1983; Smith & Payne 1984; Gebre et al. 1986; Cooke 1995; Bernardo et al. 1997; Perovic et al. 1998).
Molecular markers, such as RAPD, RFLP, AFLP, STS and microsatellites are the most powerful ways to reveal genetic diversity, identify different cultivars and undertake genetic mapping (Graner et al. 1991; Saghai-Maroof et al. 1994; Becker et al. 1995). These markers have made possible characterization of different barley cultivars, understanding of phylogenetic relationships, and genetic mapping (Hoffman & Bregitzer 1996; Marillia & Scoles 1996; Ordon et al. 1997).
The aim of this work which was the first attempt in Turkey was to reveal genetic variation and then determine genetic relationships among 34 Turkish barley cultivars by using hordein and RAPD markers.
MATERIALS AND METHODS
Thirty four barley cultivars from Turkey used in the present study are listed in Table 1.
Hordein analysis: The extraction of hordein from barley seeds and their analysis by acid PAGE was carried out according to the ISTA standard reference procedure (Cooper 1987). A meal sample extract from 20 kernels for each cultivar was analyzed for hordein composition. In each electrophoretic analysis, a meal sample extract from the reference cultivar Atem was included, adjacent to a meal sample extracts of cultivars.
DNA isolation and RAPD analysis: Total genomic DNA was isolated from a bulk sampling of twenty individuals for each cultivars according to Anderson et al. (1992). RAPD reactions were performed with the following 25, 10-base primers (Operon Technologies Inc., Alameda, USA: OPA-04, OPA-12, OPA-17, OPB-01, OPB-12, OPB-14, OPC-03, OPC-13, OPE-02, OPG-10, OPG-16, OPH-19, OPI-14, OPJ-08, OPK-10, OPL-16, OPM-OPJ-08, OPM-20, OPN-13, OPO-03). PCR reaction mixture consisted of 10 ng genomic DNA, 1X PCR buffer, 1.5 mM MgCl2, 200 µM of each dNTPs, 200 nM of each primer, 0.5 units of Taq DNA polymerase in a 25µL volume. The amplification protocol was 94 0C for 2 min to pre-denaturate, followed by 45 cycles of 940C for 1 min, 360C for 1 min and 720C for 1 min, with a final
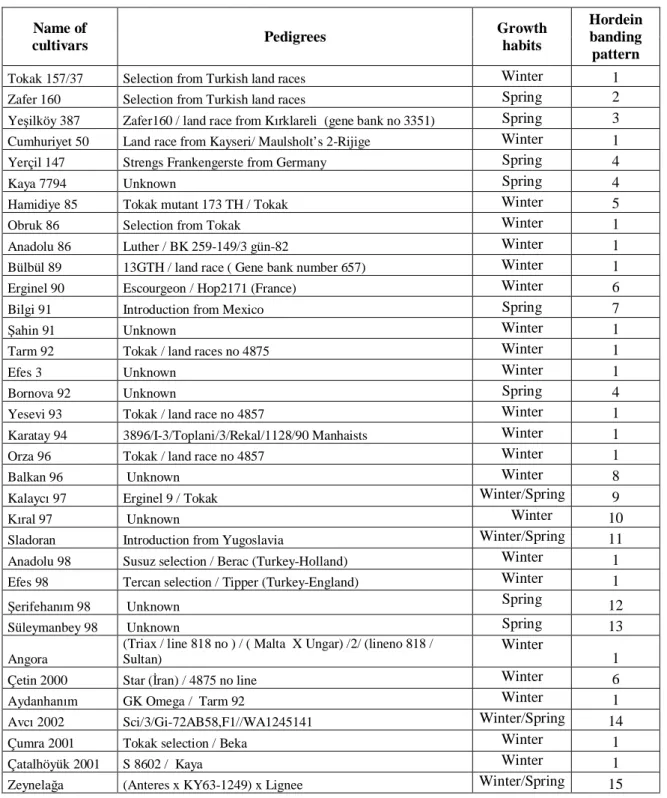
Table 1. Pedigrees, growth babit and hordein banding models of 34 Turkish barley cultivars used in the study Name of cultivars Pedigrees Growth habits Hordein banding pattern
Tokak 157/37 Selection from Turkish land races Winter 1
Zafer 160 Selection from Turkish land races Spring 2
Ye ilköy 387 Zafer160 / land race from K rklareli (gene bank no 3351) Spring 3
Cumhuriyet 50 Land race from Kayseri/ Maulsholt’s 2-Rijige Winter 1
Yerçil 147 Strengs Frankengerste from Germany Spring 4
Kaya 7794 Unknown Spring 4
Hamidiye 85 Tokak mutant 173 TH / Tokak Winter 5
Obruk 86 Selection from Tokak Winter 1
Anadolu 86 Luther / BK 259-149/3 gün-82 Winter 1
Bülbül 89 13GTH / land race ( Gene bank number 657) Winter 1
Erginel 90 Escourgeon / Hop2171 (France) Winter 6
Bilgi 91 Introduction from Mexico Spring 7
ahin 91 Unknown Winter 1
Tarm 92 Tokak / land races no 4875 Winter 1
Efes 3 Unknown Winter 1
Bornova 92 Unknown Spring 4
Yesevi 93 Tokak / land race no 4857 Winter 1
Karatay 94 3896/I-3/Toplani/3/Rekal/1128/90 Manhaists Winter 1
Orza 96 Tokak / land race no 4857 Winter 1
Balkan 96 Unknown Winter 8
Kalayc 97 Erginel 9 / Tokak Winter/Spring 9
ral 97 Unknown Winter 10
Sladoran Introduction from Yugoslavia Winter/Spring 11
Anadolu 98 Susuz selection / Berac (Turkey-Holland) Winter 1
Efes 98 Tercan selection / Tipper (Turkey-England) Winter 1
erifehan m 98 Unknown Spring 12
Süleymanbey 98 Unknown Spring 13
Angora
(Triax / line 818 no ) / ( Malta X Ungar) /2/ (lineno 818 / Sultan)
Winter
1
Çetin 2000 Star ( ran) / 4875 no line Winter 6
Aydanhan m GK Omega / Tarm 92 Winter 1
Avc 2002 Sci/3/Gi-72AB58,F1//WA1245141 Winter/Spring 14
Çumra 2001 Tokak selection / Beka Winter 1
Çatalhöyük 2001 S 8602 / Kaya Winter 1
Zeynela a (Anteres x KY63-1249) x Lignee Winter/Spring 15
(Source: Cultivar Registration and Seed Certification Office archives)
extension at 720C for 10 min. Amplification products were fractionated on 2% agarose gels, stained with ethidium bromide, visualized with ultraviolet light and photographed.
Data analysis: The banding patterns of the hordein were scored for each cultivar and relative electrophoretic mobilities (REM) of hordein bands were calculated as described by White and Cooke 1992. The presence of a band at a given REM was designed as ‘1’ and its absence ‘0’. RAPD data were scored for presence (1), absence (0) and each band was regarded as a locus. Bands of identical size
amplified with the same primer were considered to be the same locus consisting of two alleles. The genetic similarities (GS) were calculated according to Nei & Li (1979). Based on the similarity matrix, a dendogram showing the genetic relationships between cultivars, was constructed using unweighted pair group method with arithmetic average (UPGMA) (Sneath & Sokal 1973) by using the software NTSYS-pc version1.80 (Rohlf 1993). Polymorphic information content (PIC) values were calculated for each RAPD primer according to the formula: PIC = 1- (P
ij) 2
where Pij is the frequency of the ith pattern revealed by the jth primer summed across all patterns revealed by the primers (Botstein et al. 1980).
RESULTS AND DISCUSSION
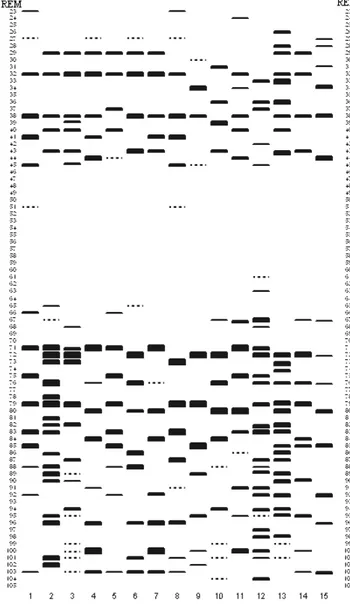
Analysis of hordein from 34 cultivars yielded 15 different hordein band patterns. The diagrammatic representation of hordein band patterns was presented in Figure 1. The different hordein band patterns were labeled numerically (1-15) and the results are summarized in Table 1. Totally, 69 hordein bands controlled by B and C hordein loci (Hor1 and Hor2) were detected in 15 different hordein band patterns and their REM values ranged from 23 to 105. Because of the fact that band staining intensity may be changeable according to different staining methods, it is more reliable that only band numbers and their REM values should be taken into consideration for cultivar identification. Several studies emphasized that staining intensity of bands may be changeable and not be used for cultivar identification (Marchylo & Laberge 1981; Marchylo 1987).
Figure 1. The diagrammatic representation of 15 hordein banding
patterns found in 34 Turkish barley cultivars Numbers 1-15: hordein banding patterns, REM: relative electrophoretic mobility.
By comparing to the hordein band patterns, it is apparent that many Turkish cultivars showed identical band patterns. However, only twelve cultivars such as Zafer160, Ye ilköy387, Hamidiye 85, Bilgi 91, Balkan 96, Kalayc 97, ral 97, Sladoran, erifehan m 98, Süleymanbey 98, Avc 2002 and Zeynelaga have unique band patterns.
In several studies using different electrophoresis techniques, numbers of hordein band pattern were found 70 in 353 cultivars (White & Cooke 1992), 42 in 68 cultivars (Marchylo & LaBerge 1981), 19 in 68 cultivars (Cooke et. al. 1983), 29 in 77 cultivars (Montembault et.al (1983) and 105 in 706 cultivars (Cooke et. al. 1995a). In this study, 15 hordein band detected in 34 Turkish cultivars showed that there was high genetic polymorphism among Turkish cultivars. Variability in numbers of hordein band patterns may be result of different level of genetic polymorphism among cultivars used and also cultivar numbers and different electrophoresis methods.
In this study, many winter barley cultivars that cannot be distinguished by PAGE, due to the fact that they have close parental relationships (Table 1). For example, Tokak 157/37 is one of the parents of Obruk 86, Tarm 92, Yesevi 93, Orza 96 and Çumra 2001. One of the parental lines of Anadolu 98 and Efes 98 was also collected Tercan and Susuz provinces where Tokak 157/37 has been predominantly cultivated. However, different pedigrees may also give identical hordein patterns as shown for Anadolu 86, Bülbül 89, Karatay 94, Anadolu 98, Efes 98, Angora and Çatalhöyük 2001. In the some previous studies conducted at various laboratories using different electrophoretic techniques have demonstrated that a number of cultivars are indistinguishable (Shewry et al. 1978; Marchylo & LaBerge 1981; Weiss et al. 1991). Weiss et al. (1991) could not differentiate all 55 European winter and spring barley cultivars by using SDS-PAGE and IEF methods due to the fact that there was genetically close relationship among barley cultivars used in this study and position of the genes coding for the B and C hordein is located on the same arm of chromosome 5 which limits possibilities of recombination.
Cooke (1995b) explained that certain hordein band patterns were found in high frequency due to intensive selection pressure against resistance to powdery mildew in breeding. Powdery mildew loci are located between hordein loci (Hor1 and Hor2) and these loci are tightly linked by powdery mildew loci. When selection occurs in favor of some resistance alleles of powdery mildew, then some hordein alleles can be indirectly selected. Hordein band pattern 1 was found in 17 Turkish cultivars. Turkish cultivars having hordein band pattern 1 were generally selected semi-drought areas of Turkey where powdery mildew was not a serious problem. Therefore there was not any selection affect of powdery mildew on the high frequency of hordein band pattern 1.
DNAs from bulks of each of the 34 cultivars were amplified using the twenty five oligonucleotides to examine RAPD patterns. Eight out of twenty-five RAPD primers (Operon Technology Inc. Alameda CA, US) were selected according to the number and consistency of amplified fragments (Table 2). These eight primers amplified a total of
Table 2. Primer names, sequences and polymorphism degrees.
Primer names and sequences
Number of amplified bands Number of polymorphic bands Polymorphic /
amplified bands (%) PIC
Number of different genotypes OPA-12 TCGGCGATAG 9 9 100 0.812 10 OPB-01 GTTTCGCTCC 15 15 100 0.851 21 OPB-12 CCTTGACGCA 13 12 92.3 0.827 15 OPE-02 GGTGCGGGAA 8 8 100 0.609 7 OPH-19 CTGACCAGCC 10 9 90 0.819 15 OPK-10 GTGCAACGTG 7 4 57 0.644 5 OPM-08 TCTGTTCCCC 12 12 100 0.848 12 OPN-13 AGCGTCACTC 11 11 100 0.487 9 Total 85 80 - - -Mean 10.63 10 92.4 0.737 11.75
85 products, of which 80 (94.12%) were polymorphic. For each primer, the number of polymorphic amplification products ranged from 4 to 15, with average of 10. The polymorphism degree detected by each primer, expressed as polymorphic/amplified bands ratio, was calculated. For the best evaluation, only well visible bands were considered. Primers OPA, OPB, OPE-02, OPM-08, OPN-13 led to
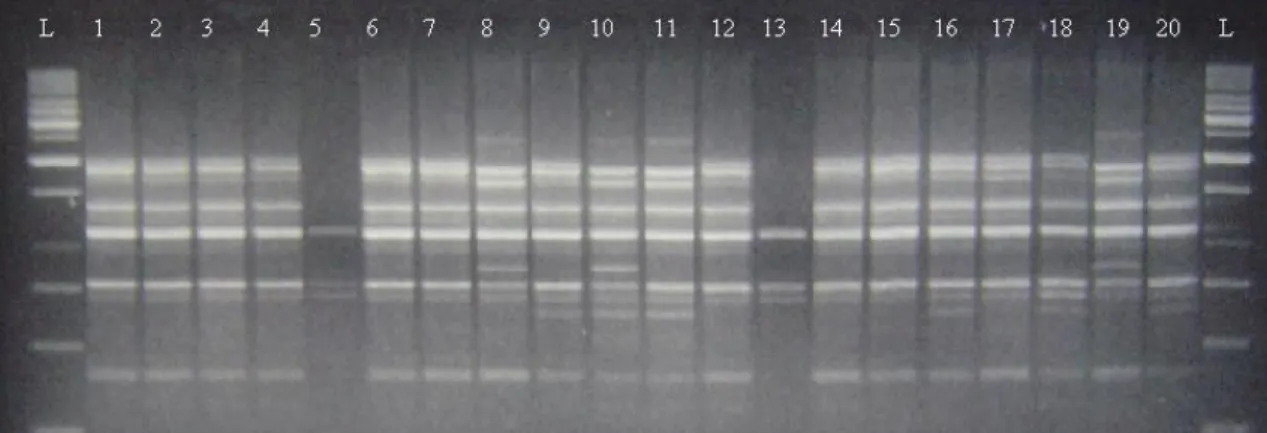
greatest number of polymorphic bands thus having a high polymorphic/amplified bands ratio, equal to 100%. The average polymorphic information content (PIC) was 0.737 ranging from 0.487 to 0.851. The lowest and the highest PIC values were recorded for primer OPN-13 and OPB-01, respectively. DNA pattern of some cultivars obtained from OPB 12 primer is presented in Figure 2 as an example.
Figure 2. Example of RAPD gel with OPB-12 primer. The first twenty cultivars represented in Table 1 are displayed from left to right.
Ladders were run in the outside two lines.
All hordein bands and all the 85 bands which were generated from 8 RAPD primers were subjected to calculate the genetic similarity (hordein-GS, RAPD-GS) among 34 cultivars. The hordein-GS value ranged from 0.52 to 1.00. The RAPD-GS value ranged from 0.57 to 1.00. The values of GS based on hordein are similar to those based on RAPDs.
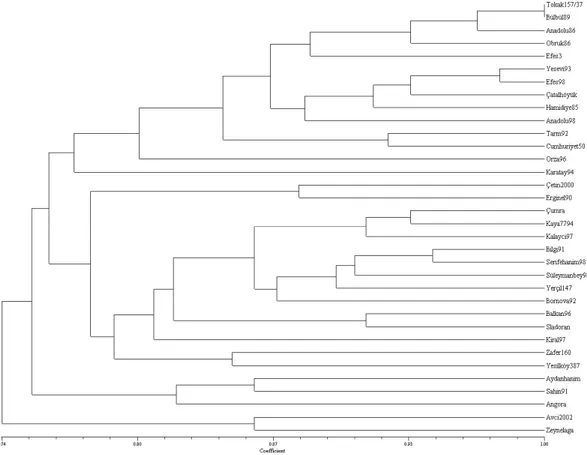
To demonstrate the relationships among cultivars, cluster analysis (UPGMA) was performed to generate dendograms based on genetic similarity values (Figure 3 and Figure 4). The analyzed cultivars were grouped into three big clusters according to hordein-GS (Figure 3). The genetic relationship analyzed among cultivars showed that the most of the winter barley cultivars which are genetically close relationship were grouped in to the first main cluster including 19 cultivars. The second main cluster consisted of three sub groups in which the second subgroup was fully including spring ones (Kaya7794, Bornova 92, Yerçil1147 and Bilgi 91) while the first and the third sub groups were including winter (Çetin 2000 and Erginel 90) and facultative ones (Zeynelaga,
Avc 2002, Kalayc 97 and Sladoran), respectively. The most distant cultivars except for K ral which were released as spring cultivars such as erifehan m 98, Süleymanbey 98, Zafer160, Ye ilköy 387 were also grouped in to the third main clusters. Some Turkish winter barley cultivars inevitably were clustered in the same or very close groups, due to fact that they are genetically very similar and share common ancestors. Growth habit of the cultivars determined by field data couldn’t allow us to discriminate spring and winter types, so this can be resulted in some conflicts especially for the cultivars grouped in to the third and the second main clusters. In order to get concrete data for growth habit, more physiology and molecular studies equipped with field data are required.
The highest RADP-GS (1.00) was found between Tokak 157/37 and Bülbül 89, while the lowest RADP-GS was observed between Angora and Avc 2002 (0.57). It indicated that all 34 barley cultivars except Tokak 157/37 and Bülbül 89 could be distinguished by RAPD analysis (Figure 4).
Figure 3. Phenogram showing genetic diversity among 34 Turkish barley cultivars using hordein data.
These results clearly indicate that RAPDs are polymorphic and especially more informative for estimating genetic relationships. In addition, RAPD markers are more easily handled and thus are becoming more desirable to estimate genetic relationships among related cultivars.
CONCLUSIONS
Spring and winter barley cultivars were able to be roughly differentiated by using hordein data but not RAPDs. However, further studies are required including very diverse barley germplasm in order to verify this idea. Similar genetic background especially among the winter barley cultivars can result in genetic bottleneck so that reason very diverse germplasm should be incorporated in to the crossing program in order to overcome this problem. According to the result of this study, combination of hordein and RAPD markers can be used for discrimination of genetically distance barley cultivars. However, some barley cultivars used in this study which were clustered within the same group by hordein and RAPD should also be identified by using different DNA based techniques such as SSR and STS, two dimensional electrophoretic analyses of hordein and isoenyzme and combination of two methods with morpho- physiological traits before and after cultivar registration.
ACKNOWLEDGMENTS
This research was funded by TUBITAK as a part of a project TOGTAG-2613 as well as by the MABDE Project (Contract ICA3-CT2002-10026) financed by European Union.
LITRATURE CITED
Anderson, J. A., Ogihara, Y., Sorrells, M.E., Tanksley, S. D. 1992. Development of a chromosomal arm map for wheat based on RFLP markers. Theor Appl Genet. 83:1035-1043.
Autran, J. C. and Scriban, R. 1977. European Brewing Convention. 16:47-62.
Becker, J., Vos, P., Kuiper, M., Salamini, F., Heun, M. 1995. Combined mapping of AFLP and RFLP markers in barley. Mol Gen Genet. 249: 65-73.
Bernardo, A., Luque, A., Cuardrado, A., Negro, A., Jouve, N., Soler, C. 1997. The assessment of genetic variation in Spanish primitive cultivars of barley, Hordeum vulgare L., by a combination of isozymes and hordeins. Genet Resour Crop Ev. 44:217-226.
Botstein, D., White, R.L., Skolnick, V., Davis, V. 1980. Construction of a genetic linkage map in man using restriction fragment length polymorphisms. Am J Hum Genet. 32:314-331.
Cooke, R. J. 1995a. Distribution and diversity of hordein alleles in barley varieties. Seed Sci Technol. 23: 865-871.
Cooke, R. J. 1995b. Gel electrophoresis for the identification of plant varieties. J. Chromatogr. 698; 281-299.
Cooke, R. J., Cliff, E. N. and Draper, S. R. 1983. Barley cultivar characterization by
electrophoresis II. Classification of hordein electrophoregrams. J Natl Inst Agr Bot. 16 (2):197-206.
Cooper, S. R. 1987. Report of the rules committee. Seed Sci Technol. 15:555-575.
Gebre, H., Khan, K. and Foster, A. E. 1986. Barley cultivars identification by polyacrylamide gel electrophoresis of hordein proteins: Catalog of cultivars. Crop Sci. 26:454-460.
Graner, A., Jahoor, A., Schondelmair, J., Siedler, H., Pillen, K., Fischbeck, G. 1991. Construction of an RFLP map of barley. Theor Appl Genet. 83:250-256.
Hoffman, D.L., Bregitzer, P. 1996. Identification of reproducible PCR-RAPD markers that enable the identification of closely related six-rowed malting barley (Hordeum vulgare L.) cultivars. J Am Soc Brew Chem. 54:172-176.
Kapala, A. 1981. Variability of electrophoretic subunit patterns of hordein proteins in spring barley (Hordem vulgare L.). Genet Pol. 22:163.
Marchylo, B. A. and Laberge, D. E. 1980. Barley cultivars identification by electrophoresis analysis of hordein proteins. Can J Plant Sci. 60:1343-1350.
Marchylo, B. A. and Laberge, D. E. 1981. Barley cultivar identification by electrophoretic analysis of hordein proteins II. Catalogue of electrophoregram formulae for Canadian grown barley cultivars. Can J Plant Sci. 61(4):859-870.
Marchylo, B. A. 1987. Barley cultivars identification by SDS gradient PAGE analysis of hordein. Can. J. Plant Sci. 67; 927-944.
Marillia, E. F. and Scoles, G. J. 1996. The use of RAPD markers in
Hordeum phylogeny. Genome. 39:646-654.
Montembault, A., Autran, J. C. and Joudrier, P. 1983. Varietal identification of barley and malt. J Inst Brew. 89:299-302. Nei, M. and Li, W. 1979. Mathematical model for studying genetic
variation in terms of restriction/endonuc1eases. P Natl Acad Sci USA. 76:5269-5273.
Ordon, F.; Schiemann, A., Friedt, W. 1997. Assessment of the genetic relatedness of barley accessions (Hordeum vulgare s.l.) resistant to soil-borne mosaic-inducing viruses (BaMMV, BaYMV, BaYMV-2) using RAPDs. Theor Appl Genet. 94:325-330.
Perovic, D., Yan, Y., Prodanovic, S., Vracarevic, M. and Zoric, D. 1998. Characterization of spring barley cultivars by hordein seed storage protein analysis. Rachis. 17(1&2):6-9.
Rohlf, F.J. 1993. NTSYS-pc version 1.80. Distribution by Exeter Software, Setauket, NewYork.
Saghai-Maroof, M. A., Biyashev, R. M., Yang, G. P., Zhang, Q., Allard, R. W. 1994. Extraordinarily polymorphic microsatellite DNA in barley: species diversity, chromosomal locations, and population dynamics. P Natl Acad Sci USA. 91:5466-5470. Shewry, P. R., Ellis, J. R. S., Pratt, H. M. and Miflin, B. 1978.
Varietal identification of single seed of barley by analysis of hordein polypeptides. J Sci Food Agr. 29:587-596.
Smith, D. B. and Payne, P. J. 1984. A procedure for the routine determination of electrophoresis band pattern of barley and malt endosperm proteins. Journal of National Institute Agriculture Botany. 16:487-498.
Sneath, P. H. A. and Sokal, R. R. 1973. Numerical Taxonomy. Freeman, San Francisco. 573p.
Weiss, W., Postel, W. and Görg, A. 1991. Barley cultivars discrimination: I. Sodium dodecyl sulphate-polyacrylamide gel electrophoresis and isoelectric focusing with immobilized pH gradients. Electrophoresis. 12:330-337.
White, J. and Cooke, R. J. 1992. A standard classification system for the identification of barley varieties by electrophoresis. Seed Sci Technol. 20:663-676.