EUROPEAN ORGANIZATION FOR NUCLEAR RESEARCH (CERN)
CERN-EP-2017-102 2018/07/04
CMS-B2G-15-006
Search for top quark partners with charge 5/3 in
proton-proton collisions at
√
s
=
13 TeV
The CMS Collaboration
∗Abstract
A search for the production of heavy partners of the top quark with charge 5/3 (X5/3)
decaying into a top quark and a W boson is performed with a data sample
corre-sponding to an integrated luminosity of 2.3 fb−1, collected in proton-proton collisions
at a center-of-mass energy of 13 TeV with the CMS detector at the CERN LHC. Final states with either a pair of same-sign leptons or a single lepton, along with jets, are considered. No significant excess is observed in the data above the expected standard
model background contribution and an X5/3 quark with right-handed (left-handed)
couplings is excluded at 95% confidence level for masses below 1020 (990) GeV. These are the first limits based on a combination of the same-sign dilepton and the
single-lepton final states, as well as the most stringent limits on the X5/3mass to date.
Published in the Journal of High Energy Physics as doi:10.1007/JHEP08(2017)073.
c
2018 CERN for the benefit of the CMS Collaboration. CC-BY-3.0 license
∗See Appendix A for the list of collaboration members
1
1
Introduction
Various extensions of the standard model (SM) predict new heavy particles for addressing the hierarchy problem caused by the quadratic divergences in the quantum-loop corrections to the Higgs boson (H) mass. The largest corrections, owing to the top quark loop, are canceled in many of these models, for example composite Higgs models [1–4], by the presence of heavy partners of the top quark. This paper describes a search for such spin 1/2 top quark partners,
using data collected by the CMS experiment at√s =13 TeV in 2015. We focus on a top quark
partner with exotic charge +5/3 (in units of the absolute charge of the electron). Such exotically charged fermions need not necessarily contribute to the coupling of the Higgs boson to glu-ons [5], and thus the measurements of the Higgs production rates at the LHC set no cglu-onstraint
on the X5/3 particle. While our previous searches and other literature referred to this particle
as T5/3, in this paper we follow the nomenclature of Ref. [1] and refer to it as X5/3.
The color charge of the X5/3 quark allows it to be produced via quantum chromodynamics
(QCD) interactions in proton-proton collisions with leading-order cross sections that depend
on new physics only via the X5/3mass. We assume that the X5/3quark decays via X5/3 →tW+
followed by t→W+b (charge conjugate modes are implied throughout), which is the dominant
decay mode in most models. Because mixing of the X5/3 quark with the top quark only occurs
through the weak interaction, production via QCD processes always results in the production
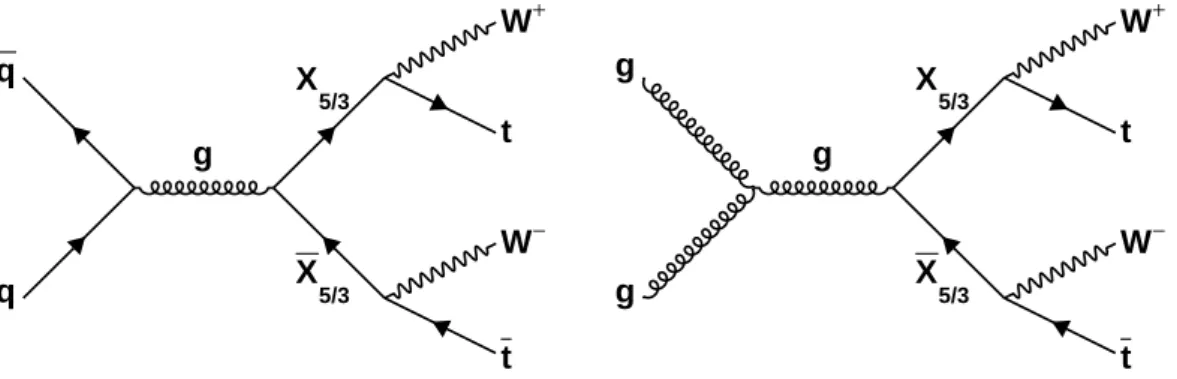
of X5/3pairs (particle and antiparticle), as shown in Fig. 1. The X5/3quark can also be produced
singly in association with a top quark through electroweak processes; however, this production mode is not considered here.
q q g 5/3 X 5/3 X + W t − W t g g g 5/3 X 5/3 X + W t − W t
Figure 1: Leading order Feynman diagrams for the production and decay of pairs of X5/3
par-ticles via QCD processes.
In this paper, the search for the X5/3 particle is focused on two final states. In the “same-sign
dilepton channel” the two (same-charge) W bosons arising from one of the X5/3particles decay
into leptons of the same charge while the other two W bosons decay inclusively. In the “single-lepton channel”, one of the W bosons decays “single-leptonically into a “single-lepton and a neutrino, while
the other three W bosons decay hadronically (including W → τ →hadrons). Throughout the
paper, when referring to a lepton (`), we mean either an electron or muon. In both channels,
leptonic decays from taus are included in the signal region although the lepton identification criteria are optimized for direct decays to either electrons or muons.
A previous search in the same-sign dilepton channel conducted by CMS, using 19.5 fb−1of data
collected at√s = 8 TeV, set a lower limit on the X5/3 mass of 800 GeV [6] at 95% confidence
level (CL). Searches have also been performed by the ATLAS experiment using 20.3 fb−1 of
separately, setting lower limits of 740 and 840 GeV, respectively.
2
The CMS detector
The central feature of the CMS apparatus is a superconducting solenoid of 6 m internal diame-ter, providing a magnetic field of 3.8 T. Within the solenoid volume are a silicon pixel and strip tracker, a lead tungstate crystal electromagnetic calorimeter (ECAL), and a brass and scintilla-tor hadron calorimeter (HCAL), each composed of a barrel and two endcap sections. Forward calorimeters extend the pseudorapidity (η) coverage provided by the barrel and endcap detec-tors. Muons are measured in gas-ionization detectors embedded in the steel flux-return yoke outside the solenoid. The first level of the CMS trigger system, composed of custom hardware processors, selects the most interesting events in a fixed time interval of less than 4 µs, using information from the calorimeters and muon detectors. The high-level trigger processor farm further decreases the event rate to a few hundred Hz, before data storage. A more detailed description of the CMS detector, together with a definition of the coordinate system used and the relevant kinematic variables, can be found in Ref. [9].
3
Simulation
The X5/3 signal processes are generated using a combination of MADGRAPH5 aMC@NLO
2.2.2 [10] and MADSPIN[11] for two coupling scenarios, corresponding to purely left- or
right-handed X5/3 coupling to W bosons, denoted by LH and RH, respectively. The MADGRAPH
generator is used both to produce X5/3 events and decay each X5/3 to a top quark and a W
boson, while the decays of the top quarks and W bosons are simulated with MADSPIN. The
signal events are simulated at leading order (LO) for various mass values between 700 and
1600 GeV in 100 GeV steps, separately for each coupling scenario. The X5/3 cross sections are
then normalized to the next-to-next-to-leading order using Top++2.0 [12–17].
The Monte Carlo (MC) background processes are generated with a variety of event generators.
The MADGRAPH5 aMC@NLOevent generator is used to simulate Z+jets, W+jets, single top in
the s- and t-channels, ttZ, ttW, ttH, and tttt processes, as well as events with a combination of three W or Z bosons and QCD multijet events. The W+jets and multijet events are generated at LO using the MLM matching scheme [18], while the others are simulated to next-to-leading or-der (NLO) using the MLM matching scheme, except for Z+jets and ttW where the FxFx
match-ing scheme [19] is used. The POWHEG 2.0 [20–23] event generator is used to simulate tt and
single top quark events in the tW channel at NLO accuracy. The diboson events involving W
or Z are generated at LO using either MADGRAPH5 [email protected] [24, 25]. Parton
showering, hadronization, and the underlying event are simulated withPYTHIA, using NNPDF
3.0 [26] parton distribution functions (PDF) with the CUETP8M1 underlying event tune [27].
All MC events are processed with GEANT4 [28, 29] for a full simulation of the CMS detector.
Further, for all simulated samples, additional proton-proton interactions (pileup) are modeled by superimposing generated minimum bias interactions onto both the bunch crossing of the simulated events and also in adjacent bunch crossings. A reweighting procedure is used to match the simulated distributions to the number of pileup interactions observed in data.
3
4
Object reconstruction
The analyses described in this paper rely on the reconstruction of four types of objects:
elec-trons, muons, jets, and missing transverse energy (EmissT ). Events are reconstructed using the
particle-flow (PF) approach [30], which consists of reconstructing and identifying each single particle with an optimized combination of all subdetector information. The details of the object selection are provided below.
Candidate events are required to have at least one reconstructed vertex. For events in which there are multiple reconstructed vertices, the one with the the largest sum of squared transverse momenta of associated tracks is chosen as the primary vertex. For the dilepton analysis, at least
two leptons are required to be within the tracker acceptance (|η| <2.4) and to have passed
trig-gers based on dielectron, dimuon or electron-muon requirements. All double lepton trigtrig-gers
used have an |η| < 2.4 requirement and pT requirements ranging from 17 to 27 GeV on the
leading lepton and from 8 to 12 GeV on the sub-leading lepton. The single-lepton analysis
re-quires events to have passed a single-electron trigger (|η| <2.1, pT >27 GeV) or a single-muon
trigger (|η| <2.4, pT >20 GeV).
Electron candidates are reconstructed from a collection of electromagnetic clusters and matched to tracks in the tracker [31]. They are then required to satisfy identification and isolation crite-ria. The identification criteria make use of shower shape variables, track quality requirements, the distance from the track to the primary vertex, and variables measuring compatibility be-tween the track and matched electromagnetic clusters to select good electron candidates. Re-quirements are also imposed to reject electrons produced in photon conversions in the detector
material. The isolation variable (Imini) is defined as the sum of energy around the electron in
a cone of varying size, divided by the transverse momentum (pT) of the electron. The radius
used for the isolation cone (R) is defined as:
R= 10 GeV
min[max(pT, 50 GeV), 200 GeV] .
We define a “tight” (“loose”) electron to have Imini <0.1(0.4).
For the same-sign dilepton analysis, charge misidentification is significantly reduced by
requir-ing that different charge measurements for an electron agree (a∼50% reduction is possible for
requiring all measurements agree for low pTelectrons). Two of the measurements are based on
two different tracking algorithms: the standard CMS track reconstruction algorithm [32] and the Gaussian-sum filter algorithm [33], optimized to take into account the possible emission of bremsstrahlung photons in the silicon tracker. The third measurement is based on the rela-tive position of the calorimeter cluster and the projected track from the pixel detector seed (the pixel hits used to reconstruct an electron’s track). We find good agreement between the three
measurements for electrons with pT < 100 GeV. However, for higher-momentum electrons,
requiring that the third measurement agree with the two track-based determinations leads to a 5–10% loss in signal efficiency. Further, the third measurement is also often incorrect for high
pT electrons. We therefore define a “relaxed” charge consistency requirement where for
elec-trons with pTbelow 100 GeV all three charge measurements are required to agree, while above
100 GeV only the first two measurements are required to agree and the third charge measure-ment is ignored.
Muons are reconstructed using a global track fit of hits in the muon detectors and hits in the silicon tracker. The track associated with a muon candidate is required to have at least six hits in the silicon tracker, at least one pixel detector hit, and a good quality global fit, including at least one hit in the muon detector. The isolation variable for muons is calculated in the
same way as it is for electrons, as described above. We define a category of “tight” muons that
satisfy Imini < 0.2. A second category of “loose” muons requires Imini < 0.4 with somewhat
relaxed identification requirements. Additional requirements are imposed on the minimum
longitudinal distance of the tracker track with respect to the primary vertex (dz < 5 mm) and
the minimum radial distance from the track to the primary vertex (dxy<2 mm).
An event-by-event correction using the effective area method [34] is applied to the computation of the electron and muon isolation in order to account for the effect of pileup. Scale factors to correct for imperfect detector simulation are obtained using the “tag-and-probe” method [35]
for lepton identification and isolation, as a function of lepton pT and η. These scale factors are
normally within a few percent of unity and those falling outside that range tend to be consistent with unity.
Jets are clustered from the reconstructed PF candidates using the anti-ktalgorithm [34, 36–38]
with a distance parameter of 0.4 (AK4) and are required to satisfy pT > 30 GeV and|η| < 2.4.
Additional selection criteria are applied to remove spurious features originating from isolated noise patterns in certain HCAL regions and from anomalous signals caused by particles de-positing energy in the silicon avalanche photodiodes used in the ECAL barrel region. Jets that overlap with leptons have the leptons removed by matching lepton PF candidates to jet con-stituents and subtracting the energy and momentum of the matched candidates from the jet four-vector. Jet energy corrections are applied for residual nonuniformity, nonlinearity of the detector response, and the level of pileup in the event [39].
The missing transverse momentum (~pTmiss) is reconstructed as the negative of the vector pTsum
of all reconstructed PF candidates in an event and its magnitude is denoted as ETmiss. Energy
scale corrections applied to jets are also propagated to EmissT .
5
Same-sign dilepton final state
The X5/3 search in the dilepton channel takes advantage of the same-sign leptons in the final
state as well as the significant amount of jet activity due to the presence of the two bottom quarks and the possibility of hadronic decays for one of the top quark partners.
The background contributions associated with this channel fall into three main categories:
• Same-sign prompt (SSP) leptons: SM processes leading to prompt, same-sign
dilep-ton signatures, where a prompt lepdilep-ton is defined as one originating from the prompt decay of either a W or Z boson. Their contribution is obtained from simulation.
• Opposite-sign prompt leptons: prompt leptons can be misreconstructed with the
wrong charge leading to a same-sign dilepton final state. This contribution is esti-mated using a data-driven method.
• Same-sign events arising from the presence of one or more non-prompt leptons: this
is the primary instrumental background arising from jets misidentified as leptons, non-prompt leptons from heavy flavor decays, fake leptons from conversions, etc. This contribution is also estimated using a data-driven method.
After requiring two tight, same-sign leptons with pT > 30 GeV we impose the following
re-quirements:
• Quarkonia veto: require invariant dilepton mass M``>20 GeV.
• Associated Z boson veto: ignore any event where M``0is within 15 GeV of the mass
5.1 Background modeling 5
in the same-sign pair, but of the same flavor as the first, and with pT >30 GeV.
• Primary Z boson veto: events are rejected if 76.1 < M`` <106.1 GeV for the
dielec-tron channel only. If the muon charge is mismeasured, its momentum will also be mismeasured, so a selected muon pair from a Z boson is unlikely to fall within this invariant mass range.
• Leading lepton pT> 40 GeV.
• Number of constituents≥5.
• HTlep>900 GeV.
The “number of constituents” is defined as the number of AK4 jets in the event passing our jet selection together with the number of other (i.e. not in the same-sign pair) tight leptons with
pT > 30 GeV. The HTlep used in this analysis is the scalar sum of the pT of all selected jets and
tight leptons in the event. With these requirements we find typical signal efficiencies of roughly 40 to 50% and background rejection of greater than 99%.
5.1 Background modeling
5.1.1 Same-sign prompt lepton background
The same-sign prompt lepton background consists of contributions from diboson production (WZ and ZZ) and rarer processes, such as ttW, ttZ, ttH, WWZ, ZZZ, WZZ, and WW+jets. Many of these processes have not been observed at the LHC or are not yet well measured. We estimate the contribution from SM events with two prompt same-sign leptons using simulation (see Table 1).
5.1.2 Opposite-sign prompt lepton background
Processes with two oppositely-charged prompt leptons can contribute to the background if the charge of one of the leptons is incorrectly measured (this background is referred to
through-out as “ChargeMisID”). For muons in the pT range considered in this analysis, the charge
misidentification probability is found to be negligible [40]. For electrons, the magnitude of this contribution can be derived from data by using a sample dominated by Z+jets events. The measurement is performed by first selecting pairs of electrons, with each electron of the pair
being in the same |η| region and having pT < 100 GeV. Each pair is then required to have
an invariant mass within 10 GeV of the Z boson mass. Since the momentum and energy mea-surements of the electrons are driven by the ECAL information, the pair’s invariant mass is insensitive to potential track mismeasurement. Counting the number of pairs with same-sign
charges then provides the charge misidentification probability as a function of|η|for electrons
with pT < 100 GeV. Next, pairs are formed using one electron with pT less than 100 GeV and
one above 100 GeV. Again the number of same-sign pairs is counted to determine the charge misidentification probability; making use of the previously measured probability for electrons
with pT < 100 GeV then gives a measurement of the charge misidentification probability, as
a function of |η|, for electrons with pT > 100 GeV. This separate measurement captures the
effect of the charge consistency requirement being relaxed at high pT(as described in Section 4)
on the charge misidentification rate. We find values for this probability ranging from 10−4for
low pT electrons in the central part of the detector to a few percent for high pTelectrons in the
forward region of the detector.
The number of expected same-sign events due to charge misidentification is estimated by con-sidering the total number of events passing the full selection but having oppositely charged leptons. These events are weighted by the charge misidentification probability parametrized
as a function of |η|. The resulting expected contribution of same-sign events due to charge
misidentification is given in Table 1. A systematic uncertainty of 30% for this background is assigned based on the variation of the charge misidentification probability observed between
simulated Drell–Yan (DY) and tt MC events and also taking into account any potential pT
de-pendence for the statistically limited high-pTregion.
5.1.3 Same-sign non-prompt background
In this category we consider non-prompt leptons that come from heavy-flavor decays, jets misidentified as leptons, decays in flight, or photon conversions. These contributions are es-timated using the “Tight-Loose” method described in Ref. [41] and used in our earlier pub-lication [6]. This method relies on two definitions of leptons: “tight” and “loose”, which are described in Section 4.
Any lepton passing either the tight or the loose selection can originate either from a prompt decay or from a non-prompt source, such as a heavy-flavor hadron, a misidentified hadron, or a photon converting to electrons. We refer to the former as “prompt” leptons and to the latter as “fake” leptons. The background is estimated by using events with one or more loose leptons weighted by the ratios of the numbers of tight leptons to the numbers of loose leptons expected for prompt and non-prompt leptons. The ratio for prompt leptons is determined from observed DY events where the invariant mass of the leptons is within 10 GeV of the Z boson
mass. We find a prompt rate of 0.873±0.001 for electrons (pe) and of 0.963±0.001 for muons
(pµ), where each reported error is the measurement’s statistical error. The “fake rate”, f`, is
defined as the probability that a fake lepton that passes the loose requirements will also pass the tight requirements. It is determined using a data sample enriched in non-prompt leptons. To reduce the contribution of leptons from W and Z boson decays, exactly one loose lepton
is required. We also require at least one jet with pT > 30 GeV and ∆R > 1.0 relative to the
lepton, Emiss
T < 25 GeV, and MT < 25 GeV, where ∆R is defined as
√
(∆φ)2+ (∆η)2, φ is the
azimuthal angle measured in radians, and MT is the transverse mass of the lepton and~pTmiss.
We also reject events if the invariant mass of the lepton and any jet is between 81 and 101 GeV.
Fake rates of 0.286±0.003 and 0.426±0.002 are obtained for electrons and muons, respectively,
where the reported errors are the statistical error on the measurement. The electron prompt and fake rates differ from those of muons because the electron identification and isolation criteria are more stringent than those for muons. The contribution of non-prompt leptons to the total background estimation is presented in Table 1.
The systematic uncertainty in the estimation of backgrounds involving fake leptons is caused by the variations due to the flavor composition of the background (i.e. any dependence of the fake rates on the flavor source of the fake lepton), the level of closure in the method (studied in tt MC events), any potential dependence on kinematic parameters that alter the background
composition (such as HTlep), as well as any potential dependence of the fake rate on η or pT.
The uncertaintiy due to these effects is found to be within 50% and hence we assign a 50% systematic uncertainty to the estimation of backgrounds due to fake leptons.
5.2 Event yields
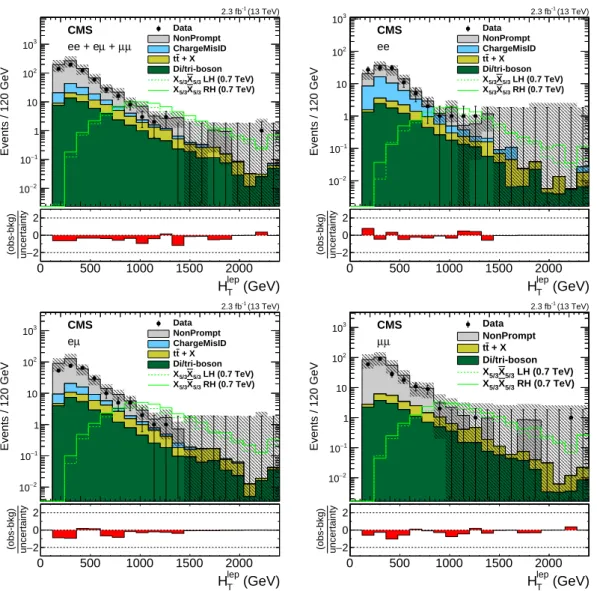
Figure 2 shows the HTlep distributions after applying the quarkonia veto, associated Z boson
veto, primary Z boson veto, and a requirement of at least two AK4 jets in the event. These distributions are for illustrative purposes only: the full selection is not applied because of the limited number of events. The uncertainty bands in the upper and lower panels of each plot include both statistical and systematic uncertainties.
5.2 Event yields 7 (GeV) lep T H 0 200 400 600 800 10001200140016001800200022002400 Events / 120 GeV 2 − 10 1 − 10 1 10 2 10 3 10 Data NonPrompt ChargeMisID + X t t Di/tri-boson LH (0.7 TeV) 5/3 X 5/3 X RH (0.7 TeV) 5/3 X 5/3 X CMS (13 TeV) -1 2.3 fb µ µ + µ ee + e (GeV) lep T H 0 500 1000 1500 2000 uncertainty (obs-bkg) −2 0 2 (GeV) lep T H 0 200 400 600 800 10001200140016001800200022002400 Events / 120 GeV 2 − 10 1 − 10 1 10 2 10 3 10 Data NonPrompt ChargeMisID + X t t Di/tri-boson LH (0.7 TeV) 5/3 X 5/3 X RH (0.7 TeV) 5/3 X 5/3 X CMS (13 TeV) -1 2.3 fb ee (GeV) lep T H 0 500 1000 1500 2000 uncertainty (obs-bkg) −2 0 2 (GeV) lep T H 0 200 400 600 800 10001200140016001800200022002400 Events / 120 GeV 2 − 10 1 − 10 1 10 2 10 3 10 DataNonPrompt ChargeMisID + X t t Di/tri-boson LH (0.7 TeV) 5/3 X 5/3 X RH (0.7 TeV) 5/3 X 5/3 X CMS (13 TeV) -1 2.3 fb µ e (GeV) lep T H 0 500 1000 1500 2000 uncertainty (obs-bkg) −2 0 2 (GeV) lep T H 0 200 400 600 800 10001200140016001800200022002400 Events / 120 GeV 2 − 10 1 − 10 1 10 2 10 3 10 Data NonPrompt + X t t Di/tri-boson LH (0.7 TeV) 5/3 X 5/3 X RH (0.7 TeV) 5/3 X 5/3 X CMS (13 TeV) -1 2.3 fb µ µ (GeV) lep T H 0 500 1000 1500 2000 uncertainty (obs-bkg) −2 0 2
Figure 2: The HTlep distributions after the same-sign dilepton selection, Z/quarkonia lepton
invariant mass vetoes, and the requirement of at least two AK4 jets in the event. The hatched area shows the combined systematic and statistical uncertainty in the background prediction for each bin. The lower panel in all plots shows the difference between the observed and the predicted numbers of events divided by the total uncertainty. The total uncertainty is calculated as the sum in quadrature of the statistical uncertainty in the observed measurement and the uncertainty in the background, including both statistical and systematic components. Also
shown are the distributions for a 700 GeV X5/3 with right-handed (solid line) and left-handed
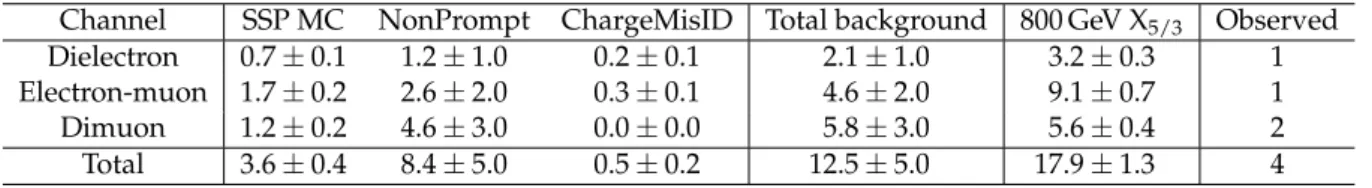
The total number of expected background events are reported in Table 1, together with the
numbers of observed and expected events for a right-handed X5/3 with a mass of 800 GeV. In
total four events are observed, which is consistent with the predicted background, taking its uncertainty into account.
Table 1: Summary of background yields from SM processes with two same-sign prompt tons (SSP MC), same-sign non-prompt leptons (NonPrompt), and opposite-sign prompt lep-tons (ChargeMisID), as well as observed data events after the full analysis selection for the
same-sign dilepton channel, with an integrated luminosity of 2.3 fb−1. Also shown are the
numbers of expected events for a right-handed X5/3 with a mass of 800 GeV. The uncertainties
include both statistical and systematic components, as discussed in Section 7.
Channel SSP MC NonPrompt ChargeMisID Total background 800 GeV X5/3 Observed
Dielectron 0.7 ± 0.1 1.2 ± 1.0 0.2 ± 0.1 2.1 ± 1.0 3.2 ± 0.3 1 Electron-muon 1.7 ± 0.2 2.6 ± 2.0 0.3 ± 0.1 4.6 ± 2.0 9.1 ± 0.7 1 Dimuon 1.2 ± 0.2 4.6 ± 3.0 0.0 ± 0.0 5.8 ± 3.0 5.6 ± 0.4 2 Total 3.6 ± 0.4 8.4 ± 5.0 0.5 ± 0.2 12.5 ± 5.0 17.9 ± 1.3 4
6
Single-lepton final state
The search for X5/3 in the single-lepton final state targets events where one of the W bosons
decays into a lepton and a neutrino, while the other three W bosons decay hadronically. The SM background processes leading to a similar final state can be grouped into three categories: top quark, electroweak and QCD multijet backgrounds. The “top quark background” group, labeled “TOP”, is dominated by tt pair production and also includes single top quark produc-tion processes and the rare SM processes ttW and ttZ (the ttH contribuproduc-tion is negligible). The “electroweak background” group, labeled “EWK”, is dominated by W+jets production, and includes the DY and diboson (WW, WZ, ZZ) contributions.
A preselection of events is made by requiring exactly one lepton with pT > 50 GeV that also
passes the tight identification and isolation requirements described in Section 4. Events
con-taining any additional loose lepton with pT >10 GeV are ignored.
Because of the significant amount of jet activity in the final state for a potential signal, we
require at least three jets, where the pT of the leading jet is greater than 200 GeV and that of
the subleading jet is greater than 90 GeV. To remove the residual multijet events in which jets overlap with the lepton, an additional selection criterion is imposed by requiring that the
lepton and the closest jet either be separated by∆R(`, closest jet)>0.4, or the magnitude of the
lepton pT perpendicular to the jet axis be larger than 40 GeV. In order to suppress the multijet
background contribution, a large missing transverse energy requirement, EmissT > 100 GeV, is
imposed.
A discriminant produced by the combined secondary vertex (CSVv2) algorithm [42] is used to identify jets that are likely to have originated from the production of a bottom quark. At the discriminant value used to select b-tagged jets, the algorithm has a single-jet signal efficiency
of∼65% and a light quark mistag efficiency of only∼1%. We require at least one of the jets in
each event to be b tagged.
Decay products of heavy particles such as X5/3 can have large Lorentz boosts, and their
sub-sequent decay products can merge into a single jet. The substructure of these jets is explored
using larger-radius jets, reconstructed with an anti-ktdistance parameter of 0.8 (AK8), in order
“N-6.1 Background modeling 9
subjettiness” [44] algorithm measures the likelihood of a jet having N subjets (N=1, 2, 3, etc).
Jet grooming techniques are used to remove soft jet constituents so that the mass of the hard constituents can be measured more precisely. The “pruning” [45] and “soft-drop” [46] algo-rithms are used to identify boosted hadronic W boson decays and boosted hadronic top quark
decays, respectively. The W-tagged jets are required to have pT > 200 GeV,|η| < 2.4, pruned
mass between 65 and 105 GeV, and the ratio of N-subjettiness variables [44] τ2/τ1<0.6, which
ensures that the W-tagged jets are more likely to have two subjets than one subjet. The pruned
jet mass scale and resolution, along with the efficiency of the τ2/τ1 selection, are compared
between data and simulation in a control region dominated by tt events with boosted hadronic W boson decays and scale factors are applied in the simulation to match them with the
perfor-mance found in data. The t-tagged jets are required to have pT >400 GeV,|η| <2.4, soft-drop
mass between 110 and 210 GeV, and the ratio of N-subjettiness variables τ3/τ2 < 0.69, which
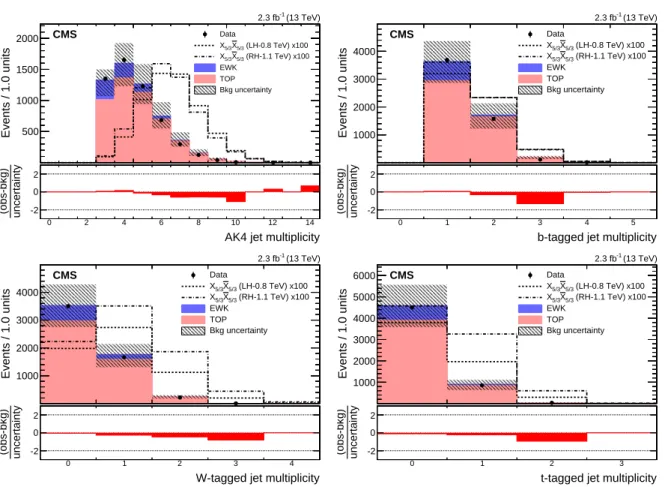
ensures that the t-tagged jets are more likely to have three subjets than two subjets. Figure 3 shows the number of AK4 jets, as well as the numbers of t-, W-, and b-tagged jets. The figure also shows that, at this level of the selection, the sample is largely dominated by top quark events, with some contribution from electroweak processes; the contribution from QCD multi-jet processes is negligible.
In a second step, the selections on the lepton pT, EmissT , jet pT, number of AK4 jets, and on the
distance between the lepton and the subleading jet,∆R(`, j2), are optimized in a procedure that
minimizes the upper limit on the X5/3 cross section expected in the absence of a signal. This
procedure was also cross checked with an alternative method that maximizes the expected significance and similar selection requirements have been found. The final selection demands, in addition to the preselection requirements listed earlier, the presence of at least four jets, the lepton pT >80 GeV, and∆R(`, j2)>1.
The mass constructed from the lepton and b-tagged jet, labeled M(`, b), provides good
dis-crimination between signal and background. In case more than one b-tagged jet is found
in the event, the one that leads to the smallest M(`, b) defines the discriminating variable,
min[M(`, b)], which is used in the analysis to extract or constrain the signal. The
distribu-tion of min[M(`, b)] is shown in Fig. 4, together with the distance between the lepton and the
subleading jet in the event, ∆R(`, j2), for events passing the final selection criteria, except for
the requirement on∆R(`, j2). The distribution of min[M(`, b)] for the background, dominated
by tt events, features a sharp drop around 150 GeV, since, for such events, this variable
repre-sents the visible mass of the top quark in the detector. The ∆R(`, j2) variable shows that the
subleading jets populate both the same and opposite hemisphere relative to the lepton in the
background events, whereas in the X5/3 signal events, the subleading jet is usually opposite
to the lepton. This is used in the final selection to further suppress the background contribu-tion in the signal region as well as to reduce the signal contaminacontribu-tion in the control region, as discussed in the following section.
6.1 Background modeling
In the single-lepton final state analysis, all the SM background processes are estimated using simulation. To cross check the background modeling, we consider two control regions to study the two dominant background processes in this analysis: one enriched in tt events, and the other enriched in W+jets events. In order to define these control regions, events are selected
by imposing the same requirements as for the final selection apart from the∆R(`, j2) and the b
tagging requirements. The selection on∆R(`, j2) is inverted, requiring this variable to be less
AK4 jet multiplicity Events / 1.0 units 500 1000 1500 2000 Data (LH-0.8 TeV) x100 5/3 X 5/3 X (RH-1.1 TeV) x100 5/3 X 5/3 X EWK TOP Bkg uncertainty (13 TeV) -1 2.3 fb CMS
AK4 jet multiplicity
0 2 4 6 8 10 12 14
uncertainty
(obs-bkg) -2 0
2 b-tagged jet multiplicity
Events / 1.0 units 1000 2000 3000 4000 Data (LH-0.8 TeV) x100 5/3 X 5/3 X (RH-1.1 TeV) x100 5/3 X 5/3 X EWK TOP Bkg uncertainty (13 TeV) -1 2.3 fb CMS
b-tagged jet multiplicity
0 1 2 3 4 5
uncertainty
(obs-bkg) -2 0 2
W-tagged jet multiplicity
Events / 1.0 units 1000 2000 3000 4000 Data (LH-0.8 TeV) x100 5/3 X 5/3 X (RH-1.1 TeV) x100 5/3 X 5/3 X EWK TOP Bkg uncertainty (13 TeV) -1 2.3 fb CMS
W-tagged jet multiplicity
0 1 2 3 4
uncertainty
(obs-bkg) -2 0
2 t-tagged jet multiplicity
Events / 1.0 units 1000 2000 3000 4000 5000 6000 Data (LH-0.8 TeV) x100 5/3 X 5/3 X (RH-1.1 TeV) x100 5/3 X 5/3 X EWK TOP Bkg uncertainty (13 TeV) -1 2.3 fb CMS
t-tagged jet multiplicity
0 1 2 3
uncertainty
(obs-bkg) -2 0 2
Figure 3: Distributions of the number of AK4 jets (upper left), the numbers of b-tagged (upper right), W-tagged (lower left), and t-tagged jets (lower right) in data and simulation for com-bined electron and muon event samples, at the preselection level. The lower panel in all plots shows the difference between the observed and the predicted numbers of events divided by the total uncertainty. The total uncertainty is calculated as the sum in quadrature of the statisti-cal uncertainty in the observed measurement and the uncertainty in the background, including both statistical and systematic components. Also shown are the distributions of representative signal events, which are scaled by a factor of 100.
6.2 Event yields 11 min[M(l,b)] (GeV) Events / 20.0 GeV 100 200 300 400 500 600 Data (LH-0.8 TeV) x100 5/3 X 5/3 X (RH-1.1 TeV) x100 5/3 X 5/3 X EWK TOP Bkg uncertainty (13 TeV) -1 2.3 fb CMS min[M(l,b)] (GeV) 0 200 400 600 800 1000 uncertainty (obs-bkg) -2 0 2 ∆R(l,j2) Events / 0.1 units 20 40 60 80 100 120 140 160 180 Data (LH-0.8 TeV) x50 5/3 X 5/3 X (RH-1.1 TeV) x50 5/3 X 5/3 X EWK TOP Bkg uncertainty (13 TeV) -1 2.3 fb CMS ) 2 R(l,j ∆ 0 1 2 3 4 5 uncertainty (obs-bkg) -2 0 2
Figure 4: Distributions of min[M(`, b)] (left) and∆R(`, j2) (right) in data and simulation for
se-lected events with at least four jets and lepton pT>80 GeV. The lower panel in all plots shows
the difference between the observed and the predicted numbers of events divided by the total uncertainty. The total uncertainty is calculated as the sum in quadrature of the statistical un-certainty in the observed measurement and the unun-certainty in the background, including both
statistical and systematic components. Also shown are the min[M(`, b)] (∆R(`, j2))
distribu-tions of representative signal events, which are scaled by a factor of 100 (50) so that the shape differences between signal and background are visible.
The tt background control region is then defined by selecting events that have≥1 b-tagged jets,
while the W+jets control region is obtained by requiring the presence of 0 b-tagged jets. For the W+jets sample, owing to the 0 b-tagged jet requirement, we use each and every selected jet in
the event as a b-jet candidate to obtain the mass discriminant, and denote it as min[M(`, jet)].
In the tt control region, the events are split into two categories, one with exactly 1 b-tagged jet, and the other with two or more b-tagged jets. For the W+jets control region, we also define two categories of events, but now based on the number of W-tagged jets: 0 W-tagged, or 1 or more
W-tagged jets. Figure 5 shows the min[M(`, b)] (min[M(`, jet)]) distributions in the tt (W+jets)
control region. The comparison of the observed and the predicted yields in the control regions for each tagging category is used as a closure test for background modeling. In both control regions, the background predictions based on simulation show good agreement with data, and any deviation from unity of the ratio between data and simulation is well within the combined uncertainties.
6.2 Event yields
In order to maximize sensitivity to the presence of a X5/3signal, in the single-lepton final state
analysis events are divided into 16 categories based on lepton flavor (e, µ), and the numbers
of t-tagged (0, ≥1), W-tagged (0, ≥1), and b-tagged (1, ≥2) jets. Event yields after the final
selection are given in Table 2. In Figs. 6 and 7 we show the distributions of min[M(`, b)] after
the final selections for events in eight different event categories, depending on the numbers of t-, W-, and b-tagged jets, after combining the electron and muon channels. The observed distributions are well reproduced by the SM predictions in all analysis categories.
min[M(l,b)] (GeV) < Events / GeV >10-2 -1 10 1 10 +jets µ e/ 0 W, 1 b ≥ 0 t, ≥ Data EWK TOP Bkg uncertainty (13 TeV) -1 2.3 fb CMS min[M(l,b)] (GeV) 0 200 400 600 800 uncertainty (obs-bkg) -2 0 2 min[M(l,b)] (GeV) < Events / GeV > 10-2 -1 10 1 10 +jets µ e/ 2 b ≥ 0 W, ≥ 0 t, ≥ Data EWK TOP Bkg uncertainty (13 TeV) -1 2.3 fb CMS min[M(l,b)] (GeV) 0 200 400 600 800 uncertainty (obs-bkg) -2 0 2 min[M(l,jet)] (GeV) < Events / GeV >10-2 -1 10 1 10 +jets µ e/ 0 t, 0 W, 0 b ≥ Data QCD TOP EWK Bkg uncertainty (13 TeV) -1 2.3 fb CMS min[M(l,jet)] (GeV) 0 200 400 600 800 uncertainty (obs-bkg) -2 0 2 min[M(l,jet)] (GeV) < Events / GeV > 10-2 -1 10 1 10 +jets µ e/ 1 W, 0 b ≥ 0 t, ≥ Data TOP EWK Bkg uncertainty (13 TeV) -1 2.3 fb CMS min[M(l,jet)] (GeV) 0 200 400 600 800 uncertainty (obs-bkg) -2 0 2
Figure 5: Distributions of min[M(`, b)] in the tt control region, for 1 b-tagged jet (upper left) and
≥2 b-tagged jets (upper right) categories, and of min[M(`, jet)] in the W+jets control region, for
0 W-tagged (lower left) and ≥1 W-tagged jet (lower right) categories for combined electron
and muon event samples. The horizontal bars on the data points indicate the bin widths. The lower panel in all plots shows the difference between the observed and the predicted numbers of events divided by the total uncertainty. The total uncertainty is calculated as the sum in quadrature of the statistical uncertainty in the observed measurement and the uncertainty in the background, including both statistical and systematic components. A small QCD multijet contribution is displayed in the bottom left plot; in all other distributions, it is less than 0.5% and is not shown.
6.2 Event yields 13 min[M(l,b)] (GeV) < Events / GeV >10-2 -1 10 1 10 +jets µ e/ 0 t, 0 W, 1 b Data X5/3X5/3 LH (0.8 TeV) x10 EWK X5/3X5/3 RH (1.1 TeV) x10 TOP Bkg uncertainty (13 TeV) -1 2.3 fb CMS min[M(l,b)] (GeV) 0 200 400 600 800 uncertainty (obs-bkg) -2 0 2 min[M(l,b)] (GeV) < Events / GeV > 10-2 -1 10 1 10 +jets µ e/ 2 b ≥ 0 t, 0 W, Data X5/3X5/3 LH (0.8 TeV) x10 EWK X5/3X5/3 RH (1.1 TeV) x10 TOP Bkg uncertainty (13 TeV) -1 2.3 fb CMS min[M(l,b)] (GeV) 0 200 400 600 800 uncertainty (obs-bkg) -2 0 2 min[M(l,b)] (GeV) < Events / GeV >10-2 -1 10 1 10 +jets µ e/ 1 W, 1 b ≥ 0 t, Data X5/3X5/3 LH (0.8 TeV) x10 EWK X5/3X5/3 RH (1.1 TeV) x10 TOP Bkg uncertainty (13 TeV) -1 2.3 fb CMS min[M(l,b)] (GeV) 0 200 400 600 800 uncertainty (obs-bkg) -2 0 2 min[M(l,b)] (GeV) < Events / GeV > 10-2 -1 10 1 10 +jets µ e/ 2 b ≥ 1 W, ≥ 0 t, Data X5/3X5/3 LH (0.8 TeV) x10 EWK X5/3X5/3 RH (1.1 TeV) x10 TOP Bkg uncertainty (13 TeV) -1 2.3 fb CMS min[M(l,b)] (GeV) 0 200 400 600 800 uncertainty (obs-bkg) -2 0 2
Figure 6: Distributions of min[M(`, b)] in (upper) 0 or (lower)≥1 W-tagged jets and (left) 1 or
(right)≥2 b-tagged jets categories with 0 t-tagged jets for combined electron and muon
sam-ples, at the final selection level. The horizontal bars on the data points indicate the bin widths. The lower panel in all plots shows the difference between the observed and the predicted num-bers of events divided by the total uncertainty. The total uncertainty is calculated as the sum in quadrature of the statistical uncertainty in the observed measurement and the uncertainty in the background, including both statistical and systematic components. Also shown are the distributions of representative signal events, which are scaled by a factor of 10.
min[M(l,b)] (GeV) < Events / GeV >10-2 -1 10 1 10 +jets µ e/ 1 t, 0 W, 1 b ≥ Data X5/3X5/3 LH (0.8 TeV) x10 EWK X5/3X5/3 RH (1.1 TeV) x10 TOP Bkg uncertainty (13 TeV) -1 2.3 fb CMS min[M(l,b)] (GeV) 0 200 400 600 800 uncertainty (obs-bkg) -2 0 2 min[M(l,b)] (GeV) < Events / GeV > 10-2 -1 10 1 10 +jets µ e/ 2 b ≥ 1 t, 0 W, ≥ Data X5/3X5/3 LH (0.8 TeV) x10 EWK X5/3X5/3 RH (1.1 TeV) x10 TOP Bkg uncertainty (13 TeV) -1 2.3 fb CMS min[M(l,b)] (GeV) 0 200 400 600 800 uncertainty (obs-bkg) -2 0 2 min[M(l,b)] (GeV) < Events / GeV > -2 10 -1 10 1 +jets µ e/ 1 W, 1 b ≥ 1 t, ≥ Data X5/3X5/3 LH (0.8 TeV) x10 EWK X5/3X5/3 RH (1.1 TeV) x10 TOP Bkg uncertainty (13 TeV) -1 2.3 fb CMS min[M(l,b)] (GeV) 0 200 400 600 800 uncertainty (obs-bkg) -2 0 2 min[M(l,b)] (GeV) < Events / GeV > -2 10 -1 10 1 +jets µ e/ 2 b ≥ 1 W, ≥ 1 t, ≥ Data X5/3X5/3 LH (0.8 TeV) x10 EWK X5/3X5/3 RH (1.1 TeV) x10 TOP Bkg uncertainty (13 TeV) -1 2.3 fb CMS min[M(l,b)] (GeV) 0 200 400 600 800 uncertainty (obs-bkg) -2 0 2
Figure 7: Distributions of min[M(`, b)] in 0 (upper) and≥1 (lower) W-tagged jets and 1 (left)
and≥2 (right) b-tagged jets categories with≥1 t-tagged jets for combined electron and muon
samples, at the final selection level. The horizontal bars on the data points indicate the bin widths. The lower panel in all plots shows the difference between the observed and the pre-dicted numbers of events divided by the total uncertainty. The total uncertainty is calculated as the sum in quadrature of the statistical uncertainty in the observed measurement and the un-certainty in the background, including both statistical and systematic components. Also shown are the distributions of representative signal events, which are scaled by a factor of 10.
15
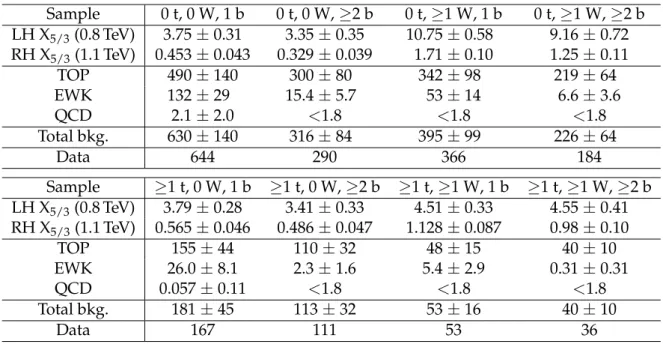
Table 2: Expected (observed) numbers of background (data) events passing the final selection requirements, in the eight tagging categories after combining electron and muon categories,
for the single-lepton channel, with an integrated luminosity of 2.3 fb−1. Also shown are the
numbers of expected events for an LH X5/3with a mass of 800 GeV and an RH X5/3with a mass
of 1.1 TeV. Uncertainties quoted in the table include both statistical as well as the systematic
components listed in Table 5. The Poisson uncertainty upper bound (<1.8) is used for the
categories where the QCD multijet event yield is zero.
Sample 0 t, 0 W, 1 b 0 t, 0 W,≥2 b 0 t,≥1 W, 1 b 0 t,≥1 W,≥2 b LH X5/3(0.8 TeV) 3.75±0.31 3.35±0.35 10.75±0.58 9.16±0.72 RH X5/3(1.1 TeV) 0.453±0.043 0.329±0.039 1.71±0.10 1.25±0.11 TOP 490±140 300±80 342±98 219±64 EWK 132±29 15.4±5.7 53±14 6.6±3.6 QCD 2.1±2.0 <1.8 <1.8 <1.8 Total bkg. 630±140 316±84 395±99 226±64 Data 644 290 366 184 Sample ≥1 t, 0 W, 1 b ≥1 t, 0 W,≥2 b ≥1 t,≥1 W, 1 b ≥1 t,≥1 W,≥2 b LH X5/3(0.8 TeV) 3.79±0.28 3.41±0.33 4.51±0.33 4.55±0.41 RH X5/3(1.1 TeV) 0.565±0.046 0.486±0.047 1.128±0.087 0.98±0.10 TOP 155±44 110±32 48±15 40±10 EWK 26.0±8.1 2.3±1.6 5.4±2.9 0.31±0.31 QCD 0.057±0.11 <1.8 <1.8 <1.8 Total bkg. 181±45 113±32 53±16 40±10 Data 167 111 53 36
7
Systematic uncertainties
The principal systematic uncertainties that are common to both analyses are presented in this section, while the uncertainties specific to each analysis are presented in Sections 7.1 and 7.2. The uncertainties in the object selection are derived from uncertainties on the efficiency of the trigger, lepton reconstruction, lepton identification and isolation. These uncertainties are de-rived from the tag-and-probe studies mentioned in Section 4 and are summarized in Table 3. Lepton identification and isolation uncertainties are applied per lepton, while trigger uncer-tainties are applied per event. We also include a 2.3% uncertainty in the luminosity measure-ment [47]. The above uncertainties are applied only to simulation.
Table 3: Details of systematic uncertainties applied for lepton triggering, identification (“ID”), isolation (“ISO”), and integrated luminosity.
Source Value Application
Electron ID 1% per electron
Electron ISO 1% per electron
Electron trigger 5% per event
Electron-electron trigger 3% per event
Muon ID 1% per muon
Muon ISO 1% per muon
Muon trigger 5% per event
Muon-muon trigger 3% per event
Electron-muon trigger 3% per event
The uncertainties that can affect the shape of the distributions, in particular those related to the jet energy scale (JES) and the jet energy resolution (JER), are assessed by varying the relevant parameters up and down by one standard deviation (s.d.) and repeating the analysis. The PDF uncertainty is evaluated using the complete set of NNPDF 3.0 PDF eigenvectors, following the prescription described in Ref. [48]. The uncertainty due to the renormalization and factoriza-tion scales is taken into account by varying the scales up or down by a factor of two and taking the maximum variation. The uncertainty due to the pileup distribution in the simulation is
assessed by varying the total inelastic cross section used in the pileup reweighting by±5%.
The theoretical uncertainties due to the factorization and renormalization scales and the PDFs lead to negligible uncertainties in the signal acceptance in the same-sign dilepton channel. The single-lepton channel considers the shape variations in the signal distributions as a result of these uncertainties.
7.1 The same-sign dilepton final state
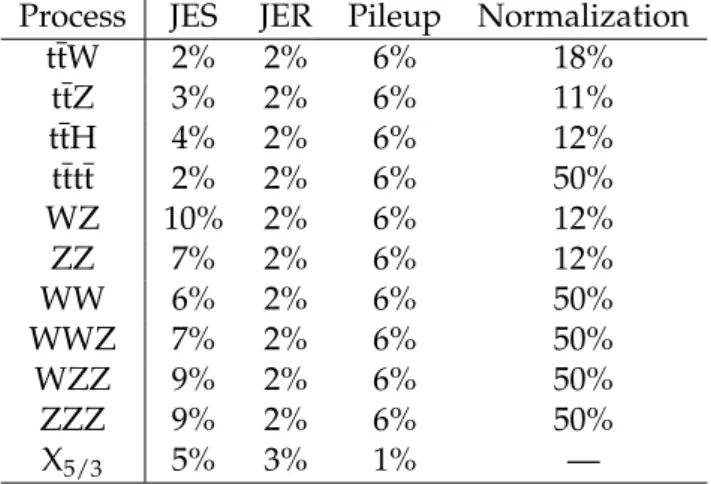
The uncertainties for simulated events are summarized in Table 4, which includes uncertain-ties related to jet energy scale, jet energy resolution, pileup, and the overall normalization un-certainty for each simulated background sample. The normalization unun-certainty takes into account the uncertainty in the cross section and the uncertainty related to the PDFs used to generate the samples. For the rare backgrounds that have either not been observed, or not well measured, we assume a conservative normalization uncertainty of 50%. We see variations of up to 2% for JER and up to 6% for pileup for some of the simulated background samples. For the signal, the JES, JER, and pileup uncertainties in the acceptance correspond to 5%, 3%, and 1%, respectively.
Table 4: Systematic uncertainties in the same-sign dilepton final state, associated with the sim-ulated processes. The “Normalization” column refers to uncertainties from the cross section normalization and the choice of PDF.
Process JES JER Pileup Normalization
ttW 2% 2% 6% 18% ttZ 3% 2% 6% 11% ttH 4% 2% 6% 12% tttt 2% 2% 6% 50% WZ 10% 2% 6% 12% ZZ 7% 2% 6% 12% WW 6% 2% 6% 50% WWZ 7% 2% 6% 50% WZZ 9% 2% 6% 50% ZZZ 9% 2% 6% 50% X5/3 5% 3% 1% —
As described in Sections 5.1.2 and 5.1.3, we also include a 30% uncertainty for the charge misidentification probability and a 50% uncertainty associated with the estimation of the Non-Prompt background. The latter is the dominant source of uncertainty in the total background prediction.
7.2 The single-lepton final state
The sources of uncertainties in the single-lepton final state are classified according to their ef-fect: having the potential to modify normalizations only, shapes only, or both normalizations and shapes. The uncertainties that affects the normalizations only are listed in Table 3.
17
To model the uncertainties that alter shapes, we consider uncertainties related to the JES, JER, b tagging and light quark mistagging efficiencies, W tagging uncertainties, t tagging uncer-tainties, event pileup conditions, PDFs, and renormalization, factorization, and parton shower
energy scales. The effect of reweighting the top quark pT distribution in tt events, following
the prescription of [49], is considered as a one-sided systematic uncertainty. The tt and single top parton shower energy scale uncertainties are assessed by independently varying the scales up and down by a factor of two. A summary of these systematic uncertainties, and how they are applied to signal and background samples is given in Table 5. In the single-lepton channel the uncertainties in the simulated background processes are dominated by the renormalization and factorization scale uncertainties.
Table 5: Summary of all systematic uncertainties considered in the single-lepton channel. Each uncertainty is included in both signal and all background processes unless noted otherwise.
Source Uncertainty Comment
Shape and normalization
JES ±1 s.d.(pT, η)
JER ±1 s.d.(η)
b/c tagging ±1 s.d.(pT)
Light quark mistagging ±1 s.d. W tagging: mass resolution ±1 s.d.(η)
W tagging: mass scale ±1 s.d.(pT, η)
W tagging: τ2/τ1 ±1 s.d.
t tagging ±1 s.d.
Pileup σinel.±5%
PDF ±1 s.d. Only for background
Renorm./fact. energy scale Envelope (×2,×0.5) Only for background Parton shower scale Envelope (×2,×0.5) Only for tt and single top Top quark pT ∆ (weighted, nominal) Only for tt
Shape only
PDF ±1 s.d. Only for signal
Renorm./fact. energy scale Envelope (×2,×0.5) Only for signal
8
Results
We find no significant excess in the data compared to the SM expectations and therefore
pro-ceed to set 95% CL upper limits on the production cross section for pp→X5/3X5/3 →tW+tW−.
Expected and observed limits are calculated using Bayesian statistics [50] with a flat prior
dis-tribution in the signal cross section, for both LH and RH X5/3scenarios. The same-sign dilepton
analysis uses a counting experiment to derive limits based on the full set of requirements de-tailed above, while the single-lepton channel uses a binned likelihood fit to the distribution
of the min[M(`, b)] variable. Systematic uncertainties are represented as nuisance parameters
with log-normal priors for normalization uncertainties, Gaussian priors for shape uncertain-ties with results obtained via the maximum-likelihood value on the signal cross section. Using
the full set of analysis selection criteria and an integrated luminosity of 2.3 fb−1, we obtain
ob-served (expected) limits of 1000 (890) GeV for an RH X5/3and 970 (860) GeV for an LH X5/3 at
95% CL in the same-sign dilepton channel. Using the single-lepton channel, the observed
(ex-pected) limits are found to be 770 (780) GeV for an RH X5/3 and 800 (780) GeV for an LH X5/3,
again at 95% CL. Both the expected and the observed limits after combining all categories in each signature are shown in Fig. 8, where the PDF, and renormalization and factorization scale uncertainties in the signal cross section are shown as the band around the theoretical
predic-tions. The observed limit being consistently lower than the expected limit for the same-sign dilepton results in figure 8 is simply due to the analysis requirements being independent of signal mass. mass (GeV) 5/3 X 700 800 900 1000 1100 1200 1300 1400 1500 )(pb) 5/3 X 5/3 X( σ 2 − 10 1 − 10 1 10 (13 TeV) -1 2.3 fb CMS - LH 5/3 X 5/3 X 95% CL observed 68% expected Median expected 95% expected Signal cross section
mass (GeV) 5/3 X 700 800 900 1000 1100 1200 1300 1400 1500 )(pb) 5/3 X 5/3 X( σ 2 − 10 1 − 10 1 10 (13 TeV) -1 2.3 fb CMS - RH 5/3 X 5/3 X 95% CL observed 68% expected Median expected 95% expected Signal cross section
mass (GeV) 5/3 X 700 800 900 1000 1100 1200 1300 1400 1500 )(pb) 5/3 X 5/3 X( σ -2 10 -1 10 1 10 (13 TeV) -1 2.3 fb CMS 95% CL observed 68% expected Median expected 95% expected Signal cross section
- LH 5/3 X 5/3 X mass (GeV) 5/3 X 700 800 900 1000 1100 1200 1300 1400 1500 )(pb) 5/3 X 5/3 X( σ -2 10 -1 10 1 10 (13 TeV) -1 2.3 fb CMS 95% CL observed 68% expected Median expected 95% expected Signal cross section
- RH
5/3
X
5/3
X
Figure 8: The expected and observed upper limits at 95% CL for a left-handed (left) and
right-handed (right) X5/3 for the same-sign dilepton signature (upper) and the single-lepton
signa-ture (lower) after combining all channels in each signasigna-ture. The theoretical prediction for the
X5/3pair production cross section is shown as a band including its uncertainty.
A combination of the results from the analyses of the two final states discussed in this paper, same-sign dilepton and the single-lepton signatures, is shown in Fig. 9. In the combination, the
observed (expected) exclusion limit on the mass of an RH X5/3 is found to be 1020 (910) GeV.
For the LH X5/3signal, the observed (expected) lower limit on the mass is 990 (890) GeV.
9
Summary
A search has been performed for the production of heavy partners of the top quark with charge
5/3 decaying into a top quark and a W boson, using 2.3 fb−1 of proton-proton collision data
collected by the CMS experiment at 13 TeV. Events with two different signatures are analyzed: final states with either a pair of same-sign leptons or a single lepton, along with jets. No sig-nificant excess is observed in the data above the expected standard model background. Upper bounds at 95% confidence level are set on the production cross section of heavy top quark
partners. The X5/3masses with right-handed (left-handed) couplings below 1020 (990) GeV are
excluded at 95% confidence level. These are the most stringent limits placed on the X5/3 mass
19 mass (GeV) 5/3 X 700 800 900 1000 1100 1200 1300 1400 1500 )(pb) 5/3 X 5/3 X( σ -2 10 -1 10 1 10 (13 TeV) -1 2.3 fb CMS 95% CL observed 68% expected Median expected 95% expected Signal cross section
- LH 5/3 X 5/3 X mass (GeV) 5/3 X 700 800 900 1000 1100 1200 1300 1400 1500 )(pb) 5/3 X 5/3 X( σ -2 10 -1 10 1 10 (13 TeV) -1 2.3 fb CMS 95% CL observed 68% expected Median expected 95% expected Signal cross section
- RH
5/3
X
5/3
X
Figure 9: The expected and observed upper limits at 95% CL after combining the same-sign
dilepton and the single-lepton signatures for left-handed (left) and right-handed (right) X5/3
scenarios. The theoretical prediction for the X5/3 pair production cross section is shown as a
band including its uncertainty.
Acknowledgments
We congratulate our colleagues in the CERN accelerator departments for the excellent perfor-mance of the LHC and thank the technical and administrative staffs at CERN and at other CMS institutes for their contributions to the success of the CMS effort. In addition, we grate-fully acknowledge the computing centres and personnel of the Worldwide LHC Computing Grid for delivering so effectively the computing infrastructure essential to our analyses. Fi-nally, we acknowledge the enduring support for the construction and operation of the LHC and the CMS detector provided by the following funding agencies: BMWFW and FWF (Aus-tria); FNRS and FWO (Belgium); CNPq, CAPES, FAPERJ, and FAPESP (Brazil); MES (Bulgaria); CERN; CAS, MoST, and NSFC (China); COLCIENCIAS (Colombia); MSES and CSF (Croatia); RPF (Cyprus); SENESCYT (Ecuador); MoER, ERC IUT, and ERDF (Estonia); Academy of Fin-land, MEC, and HIP (Finland); CEA and CNRS/IN2P3 (France); BMBF, DFG, and HGF (Ger-many); GSRT (Greece); OTKA and NIH (Hungary); DAE and DST (India); IPM (Iran); SFI (Ireland); INFN (Italy); MSIP and NRF (Republic of Korea); LAS (Lithuania); MOE and UM (Malaysia); BUAP, CINVESTAV, CONACYT, LNS, SEP, and UASLP-FAI (Mexico); MBIE (New Zealand); PAEC (Pakistan); MSHE and NSC (Poland); FCT (Portugal); JINR (Dubna); MON, RosAtom, RAS, RFBR and RAEP (Russia); MESTD (Serbia); SEIDI, CPAN, PCTI and FEDER (Spain); Swiss Funding Agencies (Switzerland); MST (Taipei); ThEPCenter, IPST, STAR, and NSTDA (Thailand); TUBITAK and TAEK (Turkey); NASU and SFFR (Ukraine); STFC (United Kingdom); DOE and NSF (USA).
Individuals have received support from the Marie-Curie programme and the European Re-search Council and Horizon 2020 Grant, contract No. 675440 (European Union); the Leventis Foundation; the A. P. Sloan Foundation; the Alexander von Humboldt Foundation; the Belgian Federal Science Policy Office; the Fonds pour la Formation `a la Recherche dans l’Industrie et dans l’Agriculture (FRIA-Belgium); the Agentschap voor Innovatie door Wetenschap en Tech-nologie (IWT-Belgium); the Ministry of Education, Youth and Sports (MEYS) of the Czech Republic; the Council of Science and Industrial Research, India; the HOMING PLUS pro-gramme of the Foundation for Polish Science, cofinanced from European Union, Regional Development Fund, the Mobility Plus programme of the Ministry of Science and Higher Ed-ucation, the National Science Center (Poland), contracts Harmonia 2014/14/M/ST2/00428,
Opus 2014/13/B/ST2/02543, 2014/15/B/ST2/03998, and 2015/19/B/ST2/02861, Sonata-bis 2012/07/E/ST2/01406; the National Priorities Research Program by Qatar National Research Fund; the Programa Clar´ın-COFUND del Principado de Asturias; the Thalis and Aristeia pro-grammes cofinanced by EU-ESF and the Greek NSRF; the Rachadapisek Sompot Fund for Post-doctoral Fellowship, Chulalongkorn University and the Chulalongkorn Academic into Its 2nd Century Project Advancement Project (Thailand); and the Welch Foundation, contract C-1845.
References
[1] A. De Simone, O. Matsedonskyi, R. Rattazzi, and A. Wulzer, “A first top partner hunter’s guide”, JHEP 04 (2013) 004, doi:10.1007/JHEP04(2013)004, arXiv:1211.5663. [2] J. Mrazek and A. Wulzer, “A strong sector at the LHC: Top partners in same-sign
dileptons”, Phys. Rev. D 81 (2010) 075006, doi:10.1103/PhysRevD.81.075006,
arXiv:0909.3977.
[3] G. Dissertori, E. Furlan, F. Moortgat, and P. Nef, “Discovery potential of top-partners in a realistic composite Higgs model with early LHC data”, JHEP 09 (2010) 019,
doi:10.1007/JHEP09(2010)019, arXiv:1005.4414.
[4] R. Contino and G. Servant, “Discovering the top partners at the LHC using same-sign dilepton final states”, JHEP 06 (2008) 026, doi:10.1088/1126-6708/2008/06/026, arXiv:0801.1679.
[5] A. Azatov and J. Galloway, “Light custodians and Higgs physics in composite models”, Phys. Rev. D 85 (2012) 055013, doi:10.1103/PhysRevD.85.055013,
arXiv:1110.5646.
[6] CMS Collaboration, “Search for top-quark partners with charge 5/3 in the same-sign dilepton final state”, Phys. Rev. Lett. 112 (2014) 171801,
doi:10.1103/PhysRevLett.112.171801, arXiv:1312.2391.
[7] ATLAS Collaboration, “Analysis of events with b-jets and a pair of leptons of the same
charge in pp collisions at√s=8 TeV with the ATLAS detector”, JHEP 10 (2015) 150,
doi:10.1007/JHEP10(2015)150, arXiv:1504.04605.
[8] ATLAS Collaboration, “Search for vector-like B quarks in events with one isolated lepton,
missing transverse momentum and jets at√s=8 TeV with the ATLAS detector”, Phys.
Rev. D 91 (2015) 112011, doi:10.1103/PhysRevD.91.112011, arXiv:1503.05425. [9] CMS Collaboration, “The CMS experiment at the CERN LHC”, JINST 3 (2008) S08004,
doi:10.1088/1748-0221/3/08/S08004.
[10] J. Alwall et al., “The automated computation of tree-level and next-to-leading order differential cross sections, and their matching to parton shower simulations”, JHEP 07 (2014) 079, doi:10.1007/JHEP07(2014)079, arXiv:1405.0301.
[11] P. Artoisenet, R. Frederix, O. Mattelaer, and R. Rietkerk, “Automatic spin-entangled decays of heavy resonances in Monte Carlo simulations”, JHEP 03 (2013) 015,
doi:10.1007/JHEP03(2013)015, arXiv:1212.3460.
[12] M. Czakon and A. Mitov, “Top++: A program for the calculation of the top-pair cross-section at hadron colliders”, Comput. Phys. Commun. 185 (2014) 2930,
References 21
[13] M. Czakon, P. Fiedler, and A. Mitov, “Total top-quark pair-production cross section at
hadron colliders throughO(α4S)”, Phys. Rev. Lett. 110 (2013) 252004,
doi:10.1103/PhysRevLett.110.252004.
[14] M. Czakon and A. Mitov, “NNLO corrections to top pair production at hadron colliders: the quark-gluon reaction”, JHEP 01 (2013) 080, doi:10.1007/JHEP01(2013)080. [15] M. Czakon and A. Mitov, “NNLO corrections to top-pair production at hadron colliders:
the all-fermionic scattering channels”, JHEP 12 (2012) 054, doi:10.1007/JHEP12(2012)054.
[16] P. B¨arnreuther, M. Czakon, and A. Mitov, “Percent-level-precision physics at the
Tevatron: Next-to-next-to-leading order QCD corrections to q ¯q→t¯t+X”, Phys. Rev. Lett.
109(2012) 132001, doi:10.1103/PhysRevLett.109.132001, arXiv:1204.5201.
[17] M. Cacciari et al., “Top-pair production at hadron colliders with next-to-next-to-leading logarithmic soft-gluon resummation”, Phys. Lett. B 710 (2012) 612,
doi:10.1016/j.physletb.2012.03.013.
[18] J. Alwall et al., “Comparative study of various algorithms for the merging of parton showers and matrix elements in hadronic collisions”, Eur. Phys. J. C 53 (2008) 473,
doi:10.1140/epjc/s10052-007-0490-5, arXiv:0706.2569.
[19] R. Frederix and S. Frixione, “Merging meets matching in MC@NLO”, JHEP 12 (2012) 061, doi:10.1007/JHEP12(2012)061, arXiv:1209.6215.
[20] P. Nason, “A new method for combining NLO QCD with shower Monte Carlo algorithms”, JHEP 11 (2004) 040, doi:10.1088/1126-6708/2004/11/040,
arXiv:hep-ph/0409146.
[21] S. Frixione, P. Nason, and C. Oleari, “Matching NLO QCD computations with parton shower simulations: the POWHEG method”, JHEP 11 (2007) 070,
doi:10.1088/1126-6708/2007/11/070, arXiv:0709.2092.
[22] S. Alioli, P. Nason, C. Oleari, and E. Re, “A general framework for implementing NLO calculations in shower Monte Carlo programs: the POWHEG BOX”, JHEP 06 (2010) 043,
doi:10.1007/JHEP06(2010)043, arXiv:1002.2581.
[23] S. Alioli, S.-O. Moch, and P. Uwer, “Hadronic top-quark pair-production with one jet and parton showering”, JHEP 01 (2012) 137, doi:10.1007/JHEP01(2012)137,
arXiv:1110.5251.
[24] T. Sj ¨ostrand, S. Mrenna, and P. Z. Skands, “A brief introduction to PYTHIA 8.1”, Comput. Phys. Commun. 178 (2008) 852, doi:10.1016/j.cpc.2008.01.036,
arXiv:0710.3820.
[25] T. Sj ¨ostrand et al., “An introduction to PYTHIA 8.2”, Comput. Phys. Commun. 191 (2015) 159, doi:10.1016/j.cpc.2015.01.024, arXiv:1410.3012.
[26] NNPDF Collaboration, “Parton distributions for the LHC Run II”, JHEP 04 (2015) 040,
doi:10.1007/JHEP04(2015)040, arXiv:1410.8849.
[27] P. Skands, S. Carrazza, and J. Rojo, “Tuning PYTHIA 8.1: the Monash 2013 tune”, Eur. Phys. J. C 74 (2014) 3024, doi:10.1140/epjc/s10052-014-3024-y,
[28] GEANT4 Collaboration, “GEANT4—a simulation toolkit”, Nucl. Instrum. Meth. A 506 (2003) 250, doi:10.1016/S0168-9002(03)01368-8.
[29] J. Allison et al., “Geant4 developments and applications”, IEEE Trans. Nucl. Sci. 53 (2006) 270, doi:10.1109/TNS.2006.869826.
[30] CMS Collaboration, “Particle-flow reconstruction and global event description with the CMS detector”, (2017). arXiv:1706.04965. Submitted to JINST.
[31] CMS Collaboration, “Performance of electron reconstruction and selection with the CMS
detector in proton-proton collisions at√s=8 TeV”, JINST 10 (2015) P06005,
doi:10.1088/1748-0221/10/06/P06005, arXiv:1502.02701.
[32] CMS Collaboration, “Description and performance of track and primary-vertex reconstruction with the CMS tracker”, JINST 9 (2014) P10009,
doi:10.1088/1748-0221/9/10/P10009, arXiv:1405.6569.
[33] W. Adam, R. Fr ¨uhwirth, A. Strandlie, and T. Todorov, “Reconstruction of electrons with the Gaussian-sum filter in the CMS tracker at LHC”, J. Phys G 31 (2005) N9,
doi:10.1088/0954-3899/31/9/N01, arXiv:physics/0306087.
[34] M. Cacciari and G. P. Salam, “Pileup subtraction using jet areas”, Phys. Lett. B 659 (2008) 119, doi:10.1016/j.physletb.2007.09.077, arXiv:0707.1378.
[35] CMS Collaboration, “Measurement of the inclusive W and Z production cross sections in
pp collisions at√s =7 TeV”, JHEP 10 (2011) 132, doi:10.1007/JHEP10(2011)132,
arXiv:1107.4789.
[36] M. Cacciari, G. P. Salam, and G. Soyez, “The anti-ktjet clustering algorithm”, JHEP 04
(2008) 063, doi:10.1088/1126-6708/2008/04/063, arXiv:0802.1189.
[37] M. Cacciari, G. P. Salam, and G. Soyez, “The catchment area of jets”, JHEP 04 (2008) 005,
doi:10.1088/1126-6708/2008/04/005, arXiv:0802.1188.
[38] M. Cacciari, G. P. Salam, and G. Soyez, “FastJet user manual”, Eur. Phys. J. C 72 (2012) 1896, doi:10.1140/epjc/s10052-012-1896-2, arXiv:1111.6097.
[39] CMS Collaboration, “Jet energy scale and resolution in the CMS experiment in pp collisions at 8 TeV”, JINST 12 (2017) P02014,
doi:10.1088/1748-0221/12/02/P02014, arXiv:1607.03663. [40] CMS Collaboration, “Search for new physics in same-sign dilepton events in
proton-proton collisions at√s=13 TeV”, Eur. Phys. J. C 76 (2016) 439,
doi:10.1140/epjc/s10052-016-4261-z, arXiv:1605.03171.
[41] CMS Collaboration, “Search for new physics with same-sign isolated dilepton events with jets and missing transverse energy at the LHC”, JHEP 06 (2011) 077,
doi:10.1007/JHEP06(2011)077, arXiv:1104.3168.
[42] CMS Collaboration, “Identification of b quark jets at the CMS experiment in the LHC Run 2”, CMS Physics Analysis Summary CMS-PAS-BTV-15-001, 2016.
[43] CMS Collaboration, “Top tagging with new approaches”, CMS Physics Analysis Summary CMS-PAS-JME-15-002, 2016.
References 23
[44] J. Thaler and K. Van Tilburg, “Maximizing boosted top identification by minimizing N-subjettiness”, JHEP 02 (2012) 093, doi:10.1007/JHEP02(2012)093,
arXiv:1108.2701.
[45] S. D. Ellis, C. K. Vermilion, and J. R. Walsh, “Techniques for improved heavy particle searches with jet substructure”, Phys. Rev. D 80 (2009) 051501,
doi:10.1103/PhysRevD.80.051501, arXiv:0903.5081.
[46] A. J. Larkoski, S. Marzani, G. Soyez, and J. Thaler, “Soft drop”, JHEP 05 (2014) 146,
doi:10.1007/JHEP05(2014)146, arXiv:1402.2657.
[47] CMS Collaboration, “CMS luminosity measurement for the 2015 data-taking period”, CMS Physics Analysis Summary CMS-PAS-LUM-15-001, 2017.
[48] J. Butterworth et al., “PDF4LHC recommendations for LHC Run II”, J. Phys. G 43 (2016) 023001, doi:10.1088/0954-3899/43/2/023001, arXiv:1510.03865.
[49] CMS Collaboration, “Measurement of the differential cross section for top quark pair
production in pp collisions at√s =8 TeV”, Eur. Phys. J. C 75 (2015) 542,
doi:10.1140/epjc/s10052-015-3709-x, arXiv:1505.04480.
[50] T. M ¨uller, J. Ott, and J. Wagner-Kuhr, “Theta—a framework for template-based modeling and inference”, (2010). http://www-ekp.physik.uni-karlsruhe.de/˜ott/
25
A
The CMS Collaboration
Yerevan Physics Institute, Yerevan, Armenia
A.M. Sirunyan, A. Tumasyan
Institut f ¨ur Hochenergiephysik, Wien, Austria
W. Adam, E. Asilar, T. Bergauer, J. Brandstetter, E. Brondolin, M. Dragicevic, J. Er ¨o, M. Flechl,
M. Friedl, R. Fr ¨uhwirth1, V.M. Ghete, C. Hartl, N. H ¨ormann, J. Hrubec, M. Jeitler1, A. K ¨onig,
I. Kr¨atschmer, D. Liko, T. Matsushita, I. Mikulec, D. Rabady, N. Rad, B. Rahbaran, H. Rohringer,
J. Schieck1, J. Strauss, W. Waltenberger, C.-E. Wulz1
Institute for Nuclear Problems, Minsk, Belarus
V. Chekhovsky, V. Mossolov, J. Suarez Gonzalez
National Centre for Particle and High Energy Physics, Minsk, Belarus
N. Shumeiko
Universiteit Antwerpen, Antwerpen, Belgium
S. Alderweireldt, E.A. De Wolf, X. Janssen, J. Lauwers, M. Van De Klundert, H. Van Haevermaet, P. Van Mechelen, N. Van Remortel, A. Van Spilbeeck
Vrije Universiteit Brussel, Brussel, Belgium
S. Abu Zeid, F. Blekman, J. D’Hondt, I. De Bruyn, J. De Clercq, K. Deroover, S. Lowette, S. Moortgat, L. Moreels, A. Olbrechts, Q. Python, K. Skovpen, S. Tavernier, W. Van Doninck, P. Van Mulders, I. Van Parijs
Universit´e Libre de Bruxelles, Bruxelles, Belgium
H. Brun, B. Clerbaux, G. De Lentdecker, H. Delannoy, G. Fasanella, L. Favart, R. Goldouzian, A. Grebenyuk, G. Karapostoli, T. Lenzi, J. Luetic, T. Maerschalk, A. Marinov, A. Randle-conde,
T. Seva, C. Vander Velde, P. Vanlaer, D. Vannerom, R. Yonamine, F. Zenoni, F. Zhang2
Ghent University, Ghent, Belgium
A. Cimmino, T. Cornelis, D. Dobur, A. Fagot, M. Gul, I. Khvastunov, D. Poyraz, S. Salva, R. Sch ¨ofbeck, M. Tytgat, W. Van Driessche, W. Verbeke, N. Zaganidis
Universit´e Catholique de Louvain, Louvain-la-Neuve, Belgium
H. Bakhshiansohi, O. Bondu, S. Brochet, G. Bruno, A. Caudron, S. De Visscher, C. Delaere, M. Delcourt, B. Francois, A. Giammanco, A. Jafari, M. Komm, G. Krintiras, V. Lemaitre, A. Magitteri, A. Mertens, M. Musich, K. Piotrzkowski, L. Quertenmont, M. Vidal Marono, S. Wertz
Universit´e de Mons, Mons, Belgium
N. Beliy
Centro Brasileiro de Pesquisas Fisicas, Rio de Janeiro, Brazil
W.L. Ald´a J ´unior, F.L. Alves, G.A. Alves, L. Brito, C. Hensel, A. Moraes, M.E. Pol, P. Rebello Teles
Universidade do Estado do Rio de Janeiro, Rio de Janeiro, Brazil
E. Belchior Batista Das Chagas, W. Carvalho, J. Chinellato3, A. Cust ´odio, E.M. Da Costa,
G.G. Da Silveira4, D. De Jesus Damiao, S. Fonseca De Souza, L.M. Huertas Guativa,
H. Malbouisson, C. Mora Herrera, L. Mundim, H. Nogima, A. Santoro, A. Sznajder, E.J. Tonelli
![Figure 4: Distributions of min[M( ` , b)] (left) and ∆R( ` , j 2 ) (right) in data and simulation for se-](https://thumb-eu.123doks.com/thumbv2/9libnet/3995970.54298/13.892.121.776.165.395/figure-distributions-min-m-left-right-data-simulation.webp)
![Figure 5: Distributions of min[M( ` , b)] in the tt control region, for 1 b-tagged jet (upper left) and](https://thumb-eu.123doks.com/thumbv2/9libnet/3995970.54298/14.892.116.778.308.782/figure-distributions-min-control-region-tagged-upper-left.webp)
![Figure 6: Distributions of min[M( ` , b)] in (upper) 0 or (lower) ≥ 1 W-tagged jets and (left) 1 or](https://thumb-eu.123doks.com/thumbv2/9libnet/3995970.54298/15.892.113.778.328.802/figure-distributions-min-upper-lower-tagged-jets-left.webp)
![Figure 7: Distributions of min[M( ` , b)] in 0 (upper) and ≥ 1 (lower) W-tagged jets and 1 (left)](https://thumb-eu.123doks.com/thumbv2/9libnet/3995970.54298/16.892.118.781.325.805/figure-distributions-min-upper-lower-tagged-jets-left.webp)