Determination of starting level of heat stress on daily milk yield in
Holstein cows in Bursa city of Turkey
Serdar DURU
Uludağ University, Faculty of Agriculture, Department of Animal Science, Bursa, Turkey.
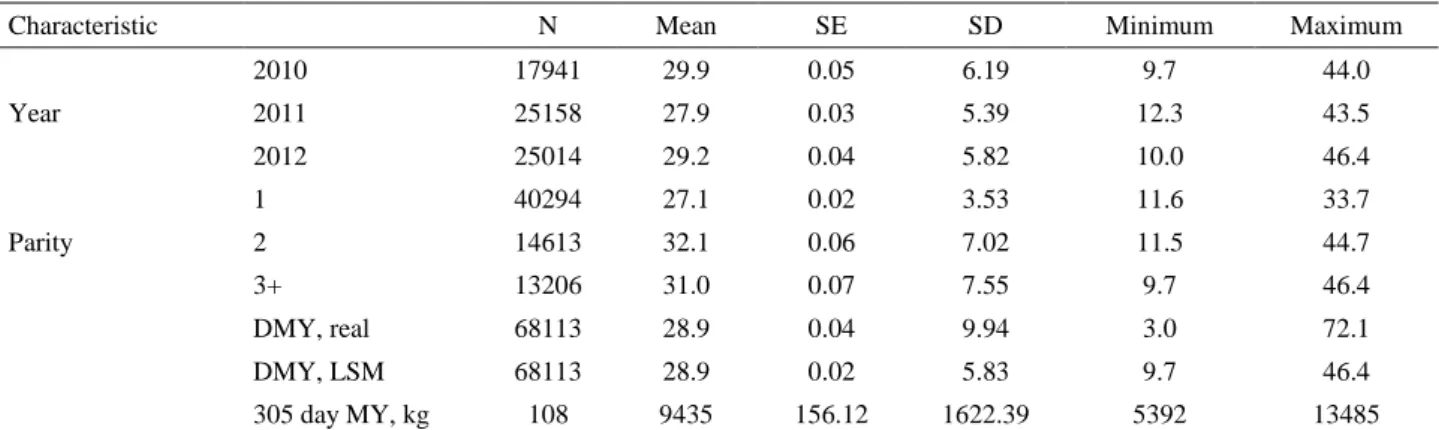
Summary: The aim of this study was to investigate the starting levels of heat stress on daily milk yield (DMY) in Holstein cows reared in Marmara region in Turkey. For this purpose, a total of 68113 daily milk records of 212 Holstein Friesian cows raised in Bursa, a city in Marmara region, during 2010-2012 were evaluated. The temperature humidity index (THI) was used to investigate the effect of heat stress. The effects of year, lactation number, days in milk (DIM) and THI on milk yield were found significant (P<0.01). DMY's smallest, largest, average values were 3.0, 72.1, 28.9±0.04, respectively, and the 305-day average milk yield was 9435±156.12 kg. DMY smallest adjusted average occurred in August (24.0 kg), while the highest occurred in April (31.5 kg). THI ranged between 26 and 79, the first THI value having adverse effect on milk yield was 65, and THI threshold value irreversibly affecting the milk yield is 70. THI value of 70 and above were detected more than 268 days from May to September in three years. The correlation coefficient between THI and the daily milk yield was calculated as -0.771. Also on farms in similar climatic conditions, precautions must be taken against heat stress. Continuous recording of temperature and humidity and the operation of the cooling system in the barns according to the THI can be more effective against heat stress.
Keywords: Dairy cattle, heat stress, Holstein, milk yield.
Türkiye’nin Bursa şehrindeki Siyah Alaca ineklerde günlük süt verimi için ısı stresi başlangıç
seviyesinin belirlenmesi
Özet: Bu çalışmanın amacı, Türkiye’de Marmara Bölgesinde yetiştirilen Siyah Alaca sığırlarda günlük süt verimi (GSV) için ısı stresinin başlangıç seviyelerini araştırmaktır. Bu amaçla Marmara Bölgesinde bulunan Bursa’da 2010-2012 yılları arasında yetiştirilen 212 baş Siyah Alaca ineğe ait toplam 68113 süt verim kaydı değerlendirilmiştir. Isı stresinin etkisini araştırmak için sıcaklık nem indeksi (SNİ) kullanılmıştır. Yıl, laktasyon sayısı, sağılan gün sayısı (SGS) ve SNİ’nin süt verimine etkileri önemlidir (P<0.01). GSV’nin en küçük, en büyük, ortalama değeri sırasıyla, 3.0, 72.1, 28.9±0.04, ve 305 gün süt verimi ortalaması ise 9435±156.12 kg bulunmuştur. En küçük düzeltilmiş GSV ortalama Ağustos ayında (24.0 kg) iken en yüksek Nisanda (31.5 kg) bulunmuştur. SNİ 26-79 arasında değişirken, süt verimini olumsuz etkilemeye başlayan SNİ değeri 65, süt verimini geri dönülemeyecek şekilde etkileyen SNİ eşik değeri 70’tir. SNİ 70 ve üzerini, 3 yılda mayıs-eylül arasında toplam 268 gün aşmıştır. SNİ ve günlük süt verimi arasındaki korelasyon katsayısı -0.771 hesaplanmıştır. Ahır içinde sıcaklık ve nemin sürekli kaydedilmesi ve ahırlarda serinletme sisteminin SNİ’ne göre çalıştırılması ısı stresine karşı daha etkili olabilir.
Anahtar sözcükler: Isı stresi, Siyah Alaca, süt verimi, sütçü sığır.
Introduction
Milk yield is affected by genetic and environmental factors. Knowing the level of influence and aspects of these factors helps to reach the desired level for milk yield in the herd. Moreover, this crucial information is also needed in models used for genetic evaluations. Effects of various environmental factors on milk yield characteristics of Holstein cows were examined in many studies. These factors are calving year, calving month or season, lactation number, cow's age, lactation period, daily milking time and milking frequency (16, 21, 22).
Heat and humidity are also important for dairy cows. Different combinations of these two factors have different effects on the animals. Especially the negative effect of
high temperature and relative humidity on cattle is more evident (5, 9). The most appropriate zone where the changes in body temperatures of cattle are the least and can be kept in balance is defined as “thermoneutral zone”. In other words, the zone which can be described as thermal comfort zone refers to the temperature interval in which cattle is not affected by cold and hot temperatures (15). Although it changes according to breed and age, it is stated that the most appropriate environmental temperature conditions for dairy cows are 13-18 ºC, 60-70% of relative humidity, moderate level solar radiation and 5-8 km/h wind speed (28). Heat stress is shaped by the combination of such environmental factors as temperature, relative humidity, solar radiation, wind speed and precipitation (6,
28). In cows exposed to heat stress, dry matter consumption, weight gain, reproductive performance and milk yield decrease. Besides, the risk of catching a disease increases (15, 28). It is also reported that milk temperature increases as a result of heat stress (28). Dairy cows are more affected by heat stress compared to cold stress.
In order to determine the effect of heat stress in dairy cows, a few indices have been developed. One of these is the “comprehensive climate index, CCI” composed of temperatures corrected according to solar radiation, wind speed and relative humidity (19). Another is Benezra's thermal comfort index, which is based on rectal temperature and respiratory rate (3). However, the Temperature Humidity Index (THI) based on temperature and relative humidity is used more commonly (8, 12, 14, 15, 18). It is reported that the indices attaching more importance to humidity should be used in humid regions; whereas, the indices which attach more importance to temperature should be used in semi-arid regions (6). In the meantime, it is also reported that rectal temperature can be an important indicator of heat stress; and, further that even rectal temperature or THI should be included in selection programs (5, 11, 23). The purpose of this study was to determine the effect of heat stress on daily milk yield in Holstein cattle in Bursa city of Turkey and the threshold THI value where the cows get stressed.
Materials and Methods
Data collection: In the study, daily milk yields
(DMY) of 212 Holstein cows raised in the herd, belongs to, Cattle Breeders’ Association of Bursa, (40°.12'.00 N; 28°.25'.00 E) in Bursa between 1 January 2010 and 31 December 2012 were used. In the farm, there was a semi-open free stall and no precautions were taken against heat stress during the research study. The cows roamed freely in the roaming area inside and outside the cowshed and similar roughage and compact feed were given in total mixed ration (TMR) during the year round. During the three years, 68113 DMY obtained from 298 lactations of 212 cows were evaluated. 108 of 298 lactations started within the duration of the study and completed in 305 days. Also, 190 lactations were either started before 2010 and finished within the duration of the study or started within the duration of the study and finished after 2012. Recording of milk yield was started to be recorded on the 5th day following the calving. The ones with daily milk yield (DMY) of less than 3 kilograms, the ones with days in milk (DIM) of less than 30 days and the ones with DIM of over 500 days were not taken into evaluation. Moreover, the ones with 3 or more lactations were combined due to the insufficient data. The daily milk yield was determined by the herd management software and was taken from the farm every week and was not corrected.
Data analysis: In order to determine the effect of
heat stress on milk yield, a model, in which THI was a discrete variable, was used. In this model, year, number of lactations, THI and DIM was included as discrete variables for the analysis, General Linear Model (GLM) was used (20). The mathematical model used in the study is as follows:
𝑌𝑖𝑗𝑘𝑙𝑚𝑛= 𝜇 + 𝑌𝑒𝑎𝑟𝑖+ 𝐿𝑁𝑗+ 𝐷𝐼𝑀𝑘+ 𝑇𝐻𝐼𝑙+
𝑌𝑒𝑎𝑟𝑖𝑥𝐿𝑁𝑗+ 𝑌𝑒𝑎𝑟𝑖𝑥𝐷𝐼𝑀𝑘+ 𝐿𝑁𝑗𝑥𝐷𝐼𝑀𝑘+
𝐿𝑁𝑗𝑥𝑇𝐻𝐼𝑙+ 𝑒𝑖𝑗𝑘𝑙𝑚𝑛 (model 1)
where;
𝑌ijklm:n. is the daily milk yield, Yeari: i. is the year
(i=2010, 2011, 2012), LNj: j. is the lactation number (j=1, 2, 3 and over), DIMk: the effect of kth DIM category (DIM was divided into 50 categories, each including 10 days
k=1, 2, … 50), THIl: the effect of lth THI, (l=26, 27, …,
79), 𝑌𝑒𝑎𝑟𝑖𝑥𝐿𝑁𝑗 the interaction of year and lactation
number, 𝑌𝑒𝑎𝑟𝑖𝑥𝐷𝐼𝑀𝑘 is the interaction of year and DIM,
𝐿𝑁𝑗𝑥𝐷𝐼𝑀𝑘 is the interaction of lactation number and DIM,
𝐿𝑁𝑗𝑥𝑇𝐻𝐼𝑙 is the interaction of lactation number and THI
and 𝑒ijklm= is the effect of error with a mean of 0 and a
variance of 𝜎𝑒2.
Physiological thresholds are frequently shaped by an environmental parameter (e.g., THI) and sudden changes between this parameter and physiological reactions to this parameter. The relationship between THI and milk yield can be shaped by sudden changes. In order to fully determine the THI value where the milk yield starts to decrease, the variable of THI was reevaluated as can be seen below and reported by Bohmanova et al. (6).
𝑌𝑖𝑗𝑘𝑙𝑚𝑛= ⋯ + 𝜶. 𝒕 + ⋯ (model 2)
where; t was defined as follows:
𝒕 = ( 0 𝑇𝐻𝐼 ≤ 𝑡𝑟𝑒𝑠ℎ𝑜𝑙𝑑 𝑣𝑎𝑙𝑢𝑒 (𝑛𝑜 𝑠𝑡𝑟𝑒𝑠𝑠)
𝑇𝐻𝐼 𝑡𝑟𝑒𝑠ℎ𝑜𝑙𝑑 𝑣𝑎𝑙𝑢𝑒 𝑇𝐻𝐼 > 𝑡𝑟𝑒𝑠ℎ𝑜𝑙𝑑 𝑣𝑎𝑙𝑢𝑒 (ℎ𝑒𝑎𝑡 𝑠𝑡𝑟𝑒𝑠𝑠)).
Moreover, 𝜶 was shown as the slope of the milk yield decreased corresponding to each THI on the threshold. Bohmanova et al. (6) calculation for threshold values between 64 and 86. However, in the study, because no adverse effect was observed between THI 50 and 60, calculations were made for the 21 threshold values of THI between 50 and 60-79
During the study, the daily dry thermometer temperatures and the relative humidity averages were taken from the meteorology station which was 8 kilometers away. The THI was calculated according to the following equation (18). The obtained results were rounded to whole numbers to make the THI discrete. 𝑇𝐻𝐼 = (0.8 ∗ 𝐷𝑟𝑦𝐵𝑢𝑙𝑏. 𝑇𝑒𝑚𝑝. ℃) + ((𝑅𝑒𝑙. 𝐻𝑢𝑚./
In addition to these, for the daily milk yields, the correlation coefficients were calculated between the least square means (LSM) and the THI as well.
Results
Descriptive statistics: The descriptive statistics for
the milk yield were given in Table 1. The effects of year, lactation number and the interactions in the model on milk yield were found significant (P<0.01). The duration of reaching average peak yield was found to be 67 days and the peak yield average was calculated as 34.9 kilograms.
Climatic profile of the region: During the study,
while relative humidity decreased in the summer months, temperature and THI increased. The lowest daily average temperature was measured as -3.6 ºC on 2 February 2012 and the highest daily average was measured as 29.1 ºC on 6 August 2010 and on 26 July 2011. The lowest humidity was determined as 28% on 2 December 2010 and the highest humidity was determined as 100% on 18 and 20 March 2011. The average temperature and humidity were 15.3 ºC and 71.8%. The lowest, the highest and the average THI values were calculated as 26, 79 and 58.5, respectively. In the study, the THI value of 70 was reached in May and on some days until October it increased above this level. The THI 70 and above level were reached a total of 268 days in three years between May and October (in 540 days) (49.6%).
Effects of DIM and heat stress (THI) on daily milk yield: The effect of DIM on milk yield was found
important as expected (P<0.01). The daily milk yield reached the peak value on 67 days during the lactation and later it followed a course which was similar to the normal
lactation slope (Figure 1). The effect amount of DIM for milk yield decreased below zero approximately after the 250th day.
The correlation coefficient between 365 daily milk yield calculated over the average LSM of the last three years and the average THI was found as -0.771 (P<0.01). In the present study also the correlation coefficients were calculated again without including the THI values below 50. The correlation coefficients between THI (50 and over) and the first, second, third and all the lactation milk yields were found as -0.298, -0.847, -0.875 and -0.822, respectively. Regression analyses were made on milk yield of THI in the same periods and the regression curves were shown in Figure 2 and 3. Here, since the determination coefficient was higher, the polynomial regression was applied.
The effect of THI (heat stress) on milk yield was found important (P<0.01). In some THI values, the LSMs obtained from Model 1, the effect sizes and the regression curve were shown in Figure 2. It can be observed that the milk yield fluctuated a bit from THI 50 to 65 and stayed above 27 kilograms. Therefore, it can be stated that the decreasing tendency starting at 65 tried to build up to 70 and, for this reason, the value of 65 can be top point of the thermo-neutral zone. However, the milk yield decreased irretrievably especially after 70 and this decrease became sharper after 75. Hence, it can be asserted that animals enter heat stress after THI 70. In order to see the reactions of the cows in different lactations to heat stress, similar graph was created for the first, second and third lactation. However, here, for each lactation, only the cubic regression curve was given (Figure 3).
Table 1. Descriptive statistics for milk yield in Holstein cows. Tablo 1. Siyah Alaca ineklerde süt verimi için tanımlayıcı istatistikler.
Characteristic N Mean SE SD Minimum Maximum
Year 2010 17941 29.9 0.05 6.19 9.7 44.0 2011 25158 27.9 0.03 5.39 12.3 43.5 2012 25014 29.2 0.04 5.82 10.0 46.4 Parity 1 40294 27.1 0.02 3.53 11.6 33.7 2 14613 32.1 0.06 7.02 11.5 44.7 3+ 13206 31.0 0.07 7.55 9.7 46.4 DMY, real 68113 28.9 0.04 9.94 3.0 72.1 DMY, LSM 68113 28.9 0.02 5.83 9.7 46.4 305 day MY, kg 108 9435 156.12 1622.39 5392 13485
N = number of record, SE = standard error of mean, SD = standard deviation, DMY = daily milk yield, 305 day MY = 305 day average milk yield, LSM = least squares means.
N = kayıt sayısı, SE = ortalamanın standart hatası, SD = standart sapma, DMY = günlük süt verimi, 305 day MY = ortalama 305 gün süt verimi, LSM = en küçük kareler ortalamaları.
Figure 1. Changes of milk yield and effect size according to DIM in Holstein cows.
Şekil 1. Siyah Alaca ineklerde SGS’na göre süt verimi ve etki miktarındaki değişimler.
Figure 2. The trend line of milk yield and effect size for THI in Holstein cows.
Şekil 2. Siyah Alaca ineklerde SNİ için süt verimi ve etki miktarlarının eğilim çizgisi.
Figure 3. Regression curves of milk yield on THI for each lactation in Holstein cows.
Şekil 3. Siyah Alaca ineklerde her laktasyon için SNİ üzerine süt veriminin regresyon eğrileri.
The THI threshold values examined in the study and the variation of the regression coefficients predicted from the model (model 2) used to determine the decrease in the milk yield at these values were shown in Figure 4. In the figure, the regression coefficients at different THI thresholds for three lactations (α_LN1, α_LN2, α_LN3) and general (α) are seen. While at all the lactations the
regression coefficient was about zero at THI 61, it increased rather slowly in the negative direction by remaining quite stable from 61 to 70 and followed a course above -0.02. However, rapidly increasing in the negative direction after 70, at 75 it was estimated as -0.04408 and at 78 as -0.0723. In other words, at THI 78, the milk yield showed a decrease of 0.0723 kg. In the research data, the critical value (THI=65) was reached at a temperature of at least 19 ºC and the relative humidity of 60%, 70 was reached at a temperature of 22 ºC and the humidity of 68%, and 78 was reached at a temperature of 27 ºC and the humidity of 75%.
Variation of milk yield according to THI all year round was given in Figure 5. The milk yield began to decrease slowly starting from April and decreased sharply after May in which the THI started to exceed 65-70. Especially in summer months in which it exceeded 70, it continued to decrease. The milk yield starting to increase again until the end of August and reached its average value for May in October.
Figure 4. Variations of regression coefficients at THI thresholds obtained from Model 2 (first, second, third lactation; α_LN1, α_LN2, α_LN3 and general; α).
Şekil 4. Model 2’den elde edilen SNİ eşiklerindeki regresyon katsayılarındaki değişim (birinci, ikinci üçüncü laktasyon; α_LN1, α_LN2, α_LN3 ve genel; α).
Figure 5. Variation of the milk yield and THI for calendar day yield in Holstein cows.
Şekil 5. Siyah Alaca ineklerde takvim yılı için SNİ ve süt veriminin değişimi.
Discussion and Conclusion
In some studies, the time to peak yield was estimated as 48.8, 56.8-63.6, 25-47, 33.2, and 38 days (13, 24, 25, 26, 27). According to these results, the average peak duration calculated in the present study from real data is longer.
Some researchers investigating the relationship between THI and milk yield determined a lower limit for THI. This limit was determined in some studies as 50, 69 and 60 (5, 7, 10). It is known that cows with high yield are more sensitive to heat stress. It is reported that if milk yield increases from 35 to 45 kilograms per day, stress threshold temperature should be decreased by 5 ºC in cows (4). In the present study, it was observed that the cows in the 2nd
and 3rd lactations were more sensitive to the THI (Figure
3). While the third lactation milk yield was higher at THI 50 than the first lactation, it decreased to the level of the first lactation at THI 64. And after 65, the difference between them became more evident. Similarly, the second lactation milk yield was the highest at the beginning and remained the same until THI 74. However, at 74, it reached the same level as the first lactation. After this point, the first lactation milk yield reached the top level. In fact, the first lactation milk yield showed an increasing tendency, even a little, from 50 to 70 and later it showed a decreasing tendency.
In the model used to determine the THI threshold values and decrease in milk yield at these values, the regression coefficient in cows at the 2nd and 3rd lactations
have a negative value before THI 60 (Figure 4). However, it remained nearly the same until 70 and later increased in the negative direction and became -0.0849 for the 2nd
lactation and -0.1002 for the 3rd lactation at THI 78.
Conversely, it was observed that the cows in the first lactation were more resistant to the increase in THI; the THI’s milk yield curve’s intersection points were zero for 70; the regression coefficient at higher THI values continuously increased negatively. That is to say, while the regression of THI on milk yield was zero for 70 in cows at the first lactation, it was found as -0.02092 for 75 and -0.02987 for 78. One reason why the curve remained constant between THI 78 and 79 might be that the THI reached 79 for a very limited number of days (5 days).
However, comfort depends on the age of the animal as young animals are more sensitive to stress. Bohmanova et al. (6) reported that a unit of increase in THI caused different decrease rates in the milk yield and they varied between -0.23 and -0.59 kg. Bouraouia et al. (7) also found that the milk yield decreased by 0.41 kg at each unit of increase in THI of 69 and over. Barash et al. (2) reported that a unit of temperature increase caused a decrease of 0.38 kg in the milk yield and 0.01 kg in protein yield. Collier et al. (10) reported that when THI increased to 65 and over, the loss in the milk yield became important and
calculated an average daily loss of 2.2 kg between 65 and 73. While Brügemann et al. (9) reported that the milk yield started to increase from THI of 30 on, later remained constant and started to decrease after 60, Linvill and Pardue (17) reported that THI of over 65 created stress. Kadzere et al. (15) reported that the milk yield would decrease by 33% at above 35 ºC; it would decrease by 50% at above 40 ºC, but a THI of 70 and below would be accepted as comfortable. Ravagnolo et al. (23) reported that every increase above 72 would have decreased the milk yield by 0.2 kg. Similar findings for the relationship between THI and the 305 day milk yield reported by Kunaka and Makuza (16) and Bakır and Kaygısız (1). Bouraouia et al. (7) reported the correlation between THI and the daily milk yield as -0.76. This value shows great similarity to the correlation coefficient calculated in this study.
Throughout the present study, although THI increased to 68 for only one day in April, it was observed that it reached the value of 65 in May and in the same month it increased to 72. When it is considered that February had 29 days in 2012 and the research lasted 1096 days, it can be stated that the cows spent 24.45% of three years or, if proportioned, about one year at THI of 70 and above, that is to say, under heat stress. In addition, it can be stated that the cows were exposed to heat stress in three years especially 88 days in July and 84 days in August, that is to say, nearly in the whole of these months and in half of June (48 days), after all, this is seen very clearly in Figure 5. The milk yield which was about 30 kg at the beginning of summer started to decrease together with the increase in THI and decreased to 24 kg in the mid-summer. It is also necessary to state that the cooling systems of some other farms in the region start to work at 25 ºC only depending on temperature. However, the THI
values to affect cows negatively can be reached below 25
ºC as well. For this reason, when the research results are
taken into consideration, it can be sated that although it depended on the relative humidity, the cows were not cooled enough and exposed to heat stress in this establishment.
In conclusion, the critical THI value where milk yield of Holstein cows starts to decrease is 65 in Bursa conditions. However, it can be asserted that the threshold value which milk yield starts to decrease irretrievably is 70. Since cows are affected rather negatively by heat stress especially in summer months, sufficient precautions should definitely be taken against heat stress in establishments in similar climatic conditions. It will be useful that establishments evaluate relative humidity as well as temperature and take precautions accordingly. It is known that precautions to be taken against heat stress in dairy cows can prevent yield decreases resulting from stress. Also instead of the average daily temperature and
humidity data, the temperature and humidity values obtained from the barn at regular intervals can be said to be more useful. The research results may help to take necessary precautions to decrease the negative effects of hot environment on dairy cows. These precautions can be as building shades, changing feed and feeding times, using various feed additives, giving animals cold water and putting showers and fans.
References
1. Bakır G, Kaygısız A (2013): Milk yield characteristics of Holstein cows and the effect of calving month on milk yield. KSU J Nat Sci, 16, 1-7.
2. Barash H, Silanikove N, Shamay A, et al. (2001): Interrelationships among ambient temperature, day length, and milk yield in dairy cows under a Mediterranean climate. J Dairy Sci, 84, 2314-2320.
3. Benezra, MV (1954): A new index measuring the adaptability of cattle to tropical conditions. J Anim Sci, 13, 1015.
4. Berman A (2005): Estimates of heat stress relief needs for Holstein dairy cows. J Anim Sci, 83, 1377-1384.
5. Bernabucci U, Biffani S, Buggiotti L, et al. (2014): The effects of heat stress in Italian Holstein dairy cattle. J Dairy Sci, 97, 471-486.
6. Bohmanova J, Misztal I, Cole JB (2007): Temperature-Humidity Indices as indicators of milk production losses due to heat stress. J Dairy Sci, 90, 1947-1956.
7. Bouraouia R, Lahmar M, Majdoubc A, et al. (2002): The relationship of temperature-humidity index with milk production of dairy cows in a Mediterranean climate. Anim Res, 51, 479-491.
8. Brouček, J, Ryba S, Mihina S, et al. (2007): Impact of thermal-humidity index on milk yield under conditions of different dairy management. J Anim Feed Sci, 16, 329-344. 9. Brügemann K, Gernand E, von Borstel UK, et al. (2012): Defining and evaluating heat stress thresholds in different dairy cow production systems. Arch Tierzucht, 55, 13-24. 10. Collier RJ, Zimbelman RB, Rhoads RPP, et al. (2011): A
Re-evaluation of the impact of Temperature Humidity Index (THI) and Black Globe Humidity Index (BGHI) on milk production in high producing dairy cows. In: Western Dairy Management Conference. 113-126, Reno, NV.
11. Dikmen S, Cole JB, Null DJ, et al. (2012): Heritability of rectal temperature and genetic correlations with production and reproduction traits in dairy cattle. J Dairy Sci, 95, 3401-3405.
12. Dikmen S, Hansen PJ (2009): Is the temperature-humidity index the best indicator of heat stress in lactating dairy cows in a subtropical environment? J Dairy Sci, 92, 109-116. 13. Hansen J V, Friggens NC, Højsgaard S (2006): The
influence of breed and parity on milk yield, and milk yield acceleration curves. Livest Sci, 104, 53-62.
14. Joksimović-Todorović M, Davidović V, Hristov S, et al. (2011): Effect of heat stress on milk production in dairy cows. Biotechnol Anim Husb, 27, 1017-1023.
15. Kadzere CT, Murphy MR, Silanikove N, et al. (2002): Heat stress in lactating dairy cows: A review. Livest Prod Sci, 77, 59-91.
16. Kunaka K, Makuza SM (2005): Environmental factors affecting milk production in Holstein-Friesian population of Zimbabwe. Pakistan J Biol Sci, 8, 989-994.
17. Linvill DE, Pardue FE (1992): Heat stress and milk production in the South Carolina coastal plains. J Dairy Sci,
75, 2598-2604.
18. Mader TL, Davis MS, Brown-Brandl T (2006): Environmental factors influencing heat stress in feedlot cattle. J Anim Sci, 84, 712-719.
19. Mader TL, Johnson LJ, Gaughan JB (2010): A comprehensive index for assessing environmental stress in animals. J Anim Sci, 88, 2153-2165.
20. Minitab Inc. Minitab, (2010): Minitab Assist White Pap. 25, 2010.
21. Naceur M, Bouallegue M, Frouja S, et al. (2012): Effects of environmental factors on milk yield, lactation length and dry period in Tunisian Holstein cows. In: Milk Production an Up to Date Overview of Animal Nutrition, Management and Health. InTech; 153-164.
22. Nielsen HM, Friggens NC, Løvendahl P, et al. (2003): Influence of breed, parity, and stage of lactation on lactational performance and relationship between body fatness and live weight. Livest Prod Sci, 79, 119-133. 23. Ravagnolo O, Misztal I, Hoogenboom G (2000): Genetic
component of heat stress in dairy cattle, development of heat index function. J Dairy Sci, 83, 2120-2125.
24. Rekik B, Ben Gara A, Ben Hamouda M, et al. (2003): Fitting lactation curves of dairy cattle in different types of herds in tunisia. Livest Prod Sci, 83, 309-315.
25. Schutz MM, Hansen LB, Steuernagel GR, et al. (1990): Variation of milk, fat, protein, and somatic cells for dairy cattle. J Dairy Sci, 73, 484-493.
26. Silvestre AM, Martins AM, Santos VA, et al. (2009): Lactation curves for milk, fat and protein in dairy cows: A full approach. Livest Sci, 122, 308-313.
27. Tekerli M, Akıncı Z, Doğan İ, et al. (2000): Factors affecting the shape of lactation curves of Holstein cows from the Balıkesir province of Turkey. J Dairy Sci, 83, 1381-1386.
28. West JW (2003): Effects of heat-stress on production in dairy cattle. J Dairy Sci, 86, 2131-2144.
Geliş tarihi: 15.12.2016 / Kabul tarihi: 13.03.2017
Address for correspondence:
Asst. Prof. Dr. Serdar DURU
Uludağ University, Faculty of Agriculture, Department of Animal Science,
16059, Nilüfer, Bursa, Turkey. e-mail: [email protected] phone: +90 224 2941551