DEVELOPING KNOWLEDGE BASED DECISION SUPPORT
TOOL FOR ENTERPRISE RESOURCES PLANNING (ERP)
SOFTWARE SELECTION
Yrd. Doç. Dr. ismail Erol Abant Izzet Baysal ÜniverSitesi Iktisadi ve Idari Bilimler FakOllesi
•••
Dr. Mehmet Barut Wichiıa Sıate University Barton School of Business
Kamusal Kaynak Planlaması Yazılımı Seçiminde Bilgiye Dayalı Karar
Destek Aracı Geliştirilmesi
Özet
Kurumsal kaynak planlaması (ERP)gibi kapsamlı bir yazılım sistemini satın almak, yoğun bir finansal etkiye sahip olan ve buna ek olarak sayısal ve sayısal olınayan bilgiye dayalı bir projedir. Bu tip durumlarda, analitik arac;larıkullanmak büyük bir yarar sağlar. Bununla birlikte, temelolarak farklı olan bilgileri bir modelde bir araya getirmek büyük bir zorluk meydana getirir. Bu makale, sayısal ve sayısal olınayan faktörler ve birden fazla amacı göz önüne almak arzu edilen bir durum olduğunda en iyi ERP paketini seçebilecek bir metod öneriyor. Bu metod, üç bölümden olu°maktadır: (1) Bilgi toplanması ve ölçümlemesi, (2) toplam kullanıcı tercihlerinin hesaplanması, ve (3) birden fazla amaçlı optimizasyon. İlk iki bölüm, sonradan birden fazla amac;lıoptıınizasyon modeline girdi olacak sayısal olınayan bilgileri sayısal parametrelere dönü'türüyor. Metod, A.B.Dödekibir elektronik parça üreticisinin ERPseçim sürecine uygulanıyor ve sonuc;larsunuluyor.
Anahtar Sözcükler: Kurumsal kaynak planlaması, bilgiye dayalı karar sistemleri, karışık tamsayılı amaç programlaması, müşteri memnuniyeti, bulanık mantık.
Abstract
?urchasing a large software system like Enterprise Resourees Planning (ERP) is a project with significant financia! impaet and involves making a decision based on both quaIitative and quantitative information. in these types of situations, analytical tools are invaluable; however, combining fundamentally different data into a single model is quite a challenge. This paper proposes a methodology to select the best ERP produet when it is desirable to consider multiple objectives with both qualitative and quantitative factors. The methodology involves three elements: (1) data acquisition and assessment, (2) calculation of total user preferences, and (2) multiobjective optimization. The first two elements translate quaIitative information into quantitative parameters that are then input to the final element, multiobjective optimization. The methodology is appIied to an electronic component manufaeturer's ERPselection process and the results are presented.
Key Words: ERP, knowledge based decision support systems, mixed integer goal programming, customer satisfaction, fuzzy logic.
72 •
Ankara üniversitesi SBF Dergisi. 58-1Developing Knowledge Based Decision Support
Tool for Enterprise Resources Planning (ERP)
Software Selection
1.
Introduction
Today's companies are striving to make their operations leaner and agile whose obvious implications are speed and flexibility. To ensure that, companies must invest in certain structural prerequisites such as continuous improvement, R&D, advanced technologies, and integration of people and systems. Among these, the latter is the most cha11enging prerequisite and requires an enterprise wide integration in order to generate and communicate information more rapidly and accurately. This endeavor usually entails making the right decision among a limited number of alternatives. A purchasing decision of an enterprise-wide information system such as Enterprise Resources Planning (ERP) is a quite complicated decision since both qualitative and quantitative issues need to be considered. Due to large investment of time and money involved, the selection process of ERP system s has become a big business for consulting firms as well as for the software vendors themselves. Selecting the right software for the operation can be an extremely difficult undertaking, even with outside assistance. While quantitative tools are extremely valuable in alleviating this process, effectively combining fundamentally different data into a single model such that the relative importance accurately reflects the reality is quite a cha11enge. This paper presents a methodology for making such a selection when both qualitative and quantitative data must be considered. in addition, our experience suggests that not only do selection problems contain both qualitative and quantitative data, but also most are actually multi-objective, which reflects the compromise between user satisfaction and total cost.
The purpose of this research, therefore, is to build a knowledge-based dedsion support (KBDS)tool that integrates fuzzy quality function deployment (QFD) and the method of total preferences with multi-objective optimization to address the selection problem described.
ısmaıl Erol- Meluııet Barut. Develaping Knowledge Based Decision SUpport TooI for Enlerprise Resouraıs
.73
The paper is organized as follows: we first present a review of the existing literature on the techniques used. This is followed by a brief discussion concerning ERP seleetion and the neeessity of a knowledge based tool. After describing the proposed methodology in detail, we report the results of a real case study that illustrates an electronic component manufaeturer's ERP software seleetion process employing the proposed KBOS tool. Finally, we discuss the implications of using this tool.
2. Literature review
There is an abundance of excellent researeh concerning the problem of seleeting from among a fixed number of alternatives, most of whieh direeted towards specific applications. Bemroider and Koreh (2001) detailed the results from an empirical study concerning differences in eharacteristics of the enterprise resource planning (ERP) system seleetion process between smail or medium and large sized organizations. In particular, they addressed the fields of software packages considered and ehosen, the weights assigned to different seleetion criteria, the size and structure of the team responsible for the decision, the methods employed and the effort expended. Lai, Wong and Cheung (2002) displayed a case study where the analytic hierarehy process (AHP) was used to support the selection of a multi-media authorizing system in a group decision environment. Min (1992) used AHP to seleet the proper logistics software. in addition, many researehers have addressed the problem of seleeting suppliers or vendors, whieh are nothing but selecting from limited alternatives. in his meta-analysis, Weber (1991) reviewed 74 papers that represented the supplier seleetion literature between 1966 and 1991. Moore and Fearon (1973) were the first to discuss the possible use of lınear Programming (LP) model for vendor seleetion. Anthonyand Buffa (1977) used a LP model to minimize total purehasing and storage costs in scheduling vendor deliveries. Pan (1989) developed an LP model to minimize total purehase price. Handfield, Walton, Sroufe and Melnyk (2002) used AHP to evaluate supplier performances in terms of environmental dimensions. Ghodsypour and O'Brian (1998) proposed a model that integrated AHP and LP to consider both tangible and intangible factors in choosing the best suppliers and placing the optimum order quantities among them sueh that the total value of purehasing is maximized. Kasilingam and Lee (1996)proposed a Mixed Integer lınear Programıning (MILP) model for seleeting vendors and determining order quantities. Some authors addressing multiple objectives includes Buffa and Jackson (1983) employing goal programming to consider quality, price and delivery criteria and Weber (1993) developing an approaeh to minimize the total cost, the total number of Iate deliveries, and the total number of rejeeted units. Other researeh has broaehed the issue of uncertainty a decision-maker may experience in assigning scores to
74 •
Ankara üniversnesi SBF Dergisi. 58-1criteria. For example, Thompson (1990) proposed apoint rating approach for vendor selection that utilizes Monte Carlo simulation to produce an overall ranking.
Other types of problem s that typify selection from limited alternatives have served as the source of solid research as well. Korpela and Lehmusvaara (1999) used the AHP to provide input to a MILP to address the warehouse assignment problem. Min and Schilling (1990) reviewed 45 artides using multiobjective models to resolve the facility location problem.
in summary, the research in the general area of selecting from among a limited number of alternatives is excellent and covers a number of important issues related to the topic. Our work is focused on aniche that we believe is quite important in practice, namely, multiobjective decision making from among a limited number of alternatives when the decision maker must consider both quantitative and qualitative factors simultaneously. The methodology outlined in this paper seeks to address the fundamental ERP software selection problem in a comprehensive and integrated yet practical fashion.
3.
ERPselection and necessity of a knowledge based tool
Most enterprises can expect to change their ERP information system either
to a new system or a major upgrade, at least 5 to 7 years (PTAK /
SCHRAGENHEİM, 2000). With rapidly developing technologyand the
emerging needs of customers, it is crucial that the company make the best choice possible in a new system. This involves the hardware platform, database tool and the overall philosophy of the ERP system. Some ERP systems are well designed for decentralized controls while others offer an excellent fit for corporate standardized business processes. Given that there are hundreds of ERP system s available globally,.how can a company be sure that they got the one that is the best fit?
in a nutshell, the issues prospective teams deal with are as follows: (1) ERP products are all different but each package has different strengths and different weaknesses and they emphasize different parts of the process enablement, (2) the broad functionality of ERP systems makes the selection process just that much more difficult, (3) their selection project teams have no effective way to define their business requirements and thereby identify critical vendor and product criteria necessary to successfully initiate the evaluation process, (4) when these criteria have eventually been pinpointed and submitted to the most appropriate vendors, project teams often lack the ability to effectively prioritize the different criteria relative to their importance to supporting the requirements. Therefore, priorities are derived from internal
ısmaıl Erol. Meluııet lanıt. Developing Knowledge Based Decision Support TooI for Enlerprise Resources
.75
political agendas rather than the true needs and requirements, and (5) they !ad< an analytical tool to find the best product considering conflicting objectives.
As a result, choosing the right package is not easy (or at least not simple), and choosing the wrong one can be a costIy disaster since the implementation of an ERP system requires a large investment of time and money. To facilitate the process, this paper proposes a KBDS tool that consists of ways to rationally input information and then to evaluate the information according to the value requirements of the stakeholders.
4. The proposed methodology
Although the problem has thus far been described in terms of decision making and selection, it can also be viewed as an engineering design problem and this observation provides insight into developing a viable strategy for resolution. in particular, a design effort begins by identifying the expectations of a user for a potential product. Expectations, so called "customer requirements", collected as the voice of the user, are subsequently translated into technical specifications on the product so that the designer can manipulate the design features to meet the specifications. ERP software selection problem to meet enterprise-wide expectations has many of the same features. The decision maker is confronted with selecting from among a set of alternatives that meet user expectations to the greatest extent possible. These enterprise-wide expectations are satisfied, to some degree, by attributes possessed by the features of the software. it should be noted that the attributes associated with ERP software or its vendor might be quantitative in nature !ike the cost or qualitative such as perceived reliabillty and service support. To accommodate the selection framework, we define 'performance aspects' as the features that the dedsion maker wishes to consider in the selection process and 'enablers' as the characteristics of each alternatiye that have the potential to satisfy these performance aspects. For example, an enabler for ERP software or its vendor might be the infrastructure used or the length of the time required for the implementation. The overall selection problem, as a result, is to simu1taneously consider the various enablers associated with each alternatiye relative to their potential impact on the performance aspects. Based on this analysis, the best compromise alternatiye is chosen.
The proposed methodology is a result of adapting engineering design strategy to the ERP selection problem. The three main elements of the methodologyare: 1) data acquisition and assessment, 2) calculation of total user preferences, and 3) multi-objective optimization. Although the first element, data acquisition and assessment, is not the focus of this research, it is incredibly important to any implementation that a practitioner might contemplate; hence,
76 •
Ankara Üniversnesi SBF Dergisi. 58-1we provide a brief discussion of data colleetion, organizing the data in a <::eRtra! repository, and making preliminary assessments. in the second element, the qualitative data is converted into a quantitative format using the method of total preferences with fuzzy QFD. And, the fina! phase is to use parameters obtained from the previous phase in a multi-objeetive optimization model. This model is the appropriate technical tool for the seleetion problem that is used by dedsion-makers to fina1ize a seleetion by considering resource constraints.
4.1 Data acqulsltlon and assessment
For a given situation, data regarding alternatiye ERP vendors must be colleeted from a wide variety of diverse places. Approximately 40 or 50 vendors may be included in the analysis. it is imperative that performance aspects and enablers used in the third element, the total calculation of total user preferences, be determined in the beginning of data acquisition to ensure that the required data are gathered. At this point, Group Support Systems (GSS) can be a useful tool to support team interaction and more effeetively focus on identifying performance aspects and enablers. They come in a variety of form s, ranging from use of e-mail to software to support meeting room s, as well as Extranet to expedite communication with vendors and Intranet to fadlitate communication within an organization. These system s have been given credit for saving tremendous amounts of organizational time. Olson (2001) states that GSSs can aid group dedsion process a number of ways: (l) GSS anonymity can reduce individual inhibition and focus attention on ideas in the problem recognition phase of dedsion making, and (2) Simultaneous input provides more efficient means to generate information and avoid domination by influential group members.
GSSs are espedally good at supporting the brainstorming process that involves generating ideas. An additional feature of most GSSs is the abillty for all partidpants to evaluate the comments and ideas that have been generated by the brainstorming process. There is, however, one drawback of brainstorming which is the fact that individuals with dominating personalities can take over brainstorming sessions
Another method that is supported by GSSs is the Delphi Method. The first phase of the Delphi method is anonymous generation of opinions and ideas related to the issue at hand by partidpants. These anonymous papers are then circulated to all partidpants who revise their thoughts in light of these other ideas. Anonymous ideas are exchanged for either given number of rounds or until convergence of ideas. The disadvantage is that the Delphi Method is much more time consuming than brainstorming (OLSON, 2001).
ısmaıl Erol. Mehmet Barut. Develaping Knowledge Based Decision Support Toollor Enlerprise Resources
.77
Once performance aspects and enablers have been determined using either brainstorming or the Delphi Method, the next step is to summarize them for potentia1 vendors. A project team generally uses three basic types of documents to achieve this step: a request for quotation (RFQ), a request for proposal (RFP) and a request for information (RFI).With a RFQ a vendor quotes a price for the listed product(s) that meet(s) an organization's requirements and then quotes the price(s). With a RFP, the vendor selects the product(s) that meets. Several software packages exist that assist organizations in creating a professional RFP. Just as the depth of an information system varies so does the length of an RFQ or RFP. Some can be as short as a couple of pages while others consist of more than one hundred pages. Instead of an RFQ or RFP, some companies prefer to use RFI that uses a standard form to request information about a product or service (Sheliy, Cashman and Vermaat, 2002). Once vendors have received these documents, they send them bad< to the customer with completed quotations and proposals, which will be employed in the second and third element of the proposed methodology.
Another source for data gathering is ERP software. scorecard from APICS's Performance Advantage. it is an analysis of the ERP systems currently available and supported in the North American market to determine whether a system can be a good fit for a company of a specific size, doing business in a specific industry, and operating in a specific manufacturing environment.
Oearly, quality and integrity problems are the paramount concems because populating even the best models with poor data will generate poor results. it is important to carefully scrutinize the data using manual and/or electronic means. Inconsistent data must either be evaluated to determine if it is real or if it is spurious. This raw data must then be stored and catalogued, preferably in a data warehouse. A data warehouse is a specialized database that provides integrated, relevant and consistent information (FIORE, 1999). it holds a wide variety of information that might inciude vendors, characteristics of their products and their performance evaluations. As mentioned before, this step is
critical in applying this methodologyand will probably be the most
time-eonsuming.
in this element, screening is also very desirable because it reduces the dimension of the decision problem by eliminating altematives that cannot meet one or more of the requirements.
4.2 Calculatlon of lotalllser Preferences
This element of the methodology determines team member's preferences for alternatiye ERP products by using fuzzy QFD and the method of total preferences.
78 •
Ankara üniversnesi. SaF Dergisi. 58-14ıı FuzzyQFD
QFD, origrnated in Japan in the Iate 19~s, is a concept and mechanism for translating the voice of the customer into product features through various stages of product planning, engineering and manufacturing (AKAO, 1990).This translation process begins with determining the underıying constituents of QFD, which are performance aspects and enablers. Then, the importance of performance aspects and the relationships between performance aspects and enablers are computed. The fina! process is to obtain the degree to which each enabler affects performance aspects. Until the early 199Os, researchers used traditional approaches to cakulating the importance of performance aspects and the relationship scores. For example, whereas some numerical seales, such as 1-3-5, 1-3-9 or 1-5-9, were the basis of the relationships between performance aspects and enablers, percentage values between O and 1 were assigned to quantify the importance of performance aspect.
There are two problem s associated with this approach: O) even though each individual may have varying perceptions of a particular linguistic variable, numerical scales assign the same value to it, and (2) the choice of scales can influence the outcome dramatically.
To overcome the subjectiveness factor that may degrade the value of QFD as a design methodology, Masud and Dean (993) treated the weights of customer requirements and the relationships between customer and technical requirements as triangular fuzzy numbers. Lu (994) became the first to apply the AHP to determine the importance of performance aspects. Kho and Ho (996) used fuzzy numbers in order to represent the uncertainty of judgments in the assignment of relationship strength. Temponi, Yen and Tiao (999) stated that using fuzzy logic to capture the meaning of the linguistic terms not only allow different parties to communicate in natural language but also facilitate expression of customer's needs and expert's knowledge. They considered different impacts of satisfying a requirement on the satisfaction degree of another requirement and identified four types of significant relationships between requirements: mutually exclusive, irrelevant, conflicting and cooperative. Then, they developed fuzzy if-then heuristic rules to reason about partially conflicting or partlally cooperative relationships. Vanegas and Labib (2001) used fuzzy numbers to represent the imprecise nature of the judgments and to define more appropriately the relationships between customer requirements and technical requirements. They also employed fuzzy QFD to determine the importance of customer requirements and proposed the new fuzzy weighted average to determine the effect of engineering characteristics on customer satisfaction. Kim, Moskowitz, Dhingra and Evans (2000) developed fuzzy regression model to ealculate the parameters of QFD. Sohn and Choi
ısmaıl ErDI- Melunet Barut. Developing Knowledge Based Decision SUpport 1001 for Enlerprise Resources
.79
(2001) established a fuzzy QFD approach in order to find the optimallevels of design variables.
Fuzzy QFD approach in this research employs fuzzy arithmetie to establish a structured methodology that eonverts qualitative data into numerical values. However, it also uses fuzzy information processing based on the methodology developed by Juang, Huang and Elton (1991) who presented a new method uti1izing Monte Carlo simulation. it is imperative at this point to emphasize that sinee fuzzy QFD approach proposed in this paper does not require determining the optimallevels of enablers but simply the significanee of them in terms of performance aspects, we baskaliy apply fuzzy arithmetie to the linguistic expressions on the relationships and the importance of performance aspects.
Consistent with conventional QFD, the proposed fuzzy QFD uses a process with several distinct steps to link performance aspects and enablers. The first step involves ranking each performance aspect relative to the other performance aspects and providing a measure of the strength of interaetion between each performance aspect and enabler. Let the ranking of the performance aspect i relative to ali other performance aspects ~d the strength of the relationship between performance aspect i and enabler j be di and Rij, respectively. The absolute technical importance ratings (ATIRs) are computed
by:
i
AT/Rj =
L
4
*
Rjj Vj =1 ...Jj
=
1 (l)and represent the degree to which each enabler can satisfy the set of performance aspects. In order to easily compare the effectiveness of the ATlRs, theyare frequently normalized to form the relative technical importance ratings (RTlRs) using the uquations
AT/R. .
RT/Rj = J J VJ = 1= ... J
L
AT/Rj j=l(2)
The difference between traditional QFD and our proposed fuzzy QFD is the methodology used to determine the djs and Rjjs. The goal is to more aecurately quantify the human input and provide consistency in computations so that the concems listed earlier are addressed knowing the fact that there is no generaliy accepted method to determine these parameters. Our version of fuzzy QFD simultaneously employs fuzzy sets and Monte Carlo simulation to calculate these parameters.
80 •
Ankara Oniwrsilesi SBF Dergisi. 58-1The approach begins with human input from a number of team members using one of a finite number of linguistic variables, LVk, k=l, 2, ..., K. For example, suppose the team members are asked to characterize the relationship between a particular performance aspect and enabler as 5-point-interval scale: very strong, strong, medium, weak, or none. These are assigned the notation LVı= very strong, LV2=strong, LV3=medium, LV4=weak, and LVs=none. Each of these descriptors is then treated as a fuzzy set, bounded to a predetermined interval, and characterized by a single probabillty distribution. if the range for this example is the interval O, 10, one set of assignments for each linguistic variable can be illustrated as in Figure 1.
~(x) 0.5
2.5
FYgure 1:Fuzzy conversion score
Notice that intervals associated with different linguistic variables may overlap to reflect the existence of inherent fuzziness of adjacent word s, such as strong and very strong.
This appears reasonable because naturallanguage terms are inherently vague and the boundary of a term should be a region where the term gradually moves from being applicable to non-applicable (CHEN, 1992). The triangle distribution used to model the membership function is chosen because it is frequently used totranslate linguistic terms to fuzzy numbers when the exact form of the distribution is not known (PEGDEN, 1995). Values in these intervals are then used as inputs to a Monte Carlo simulatian whose output is then used for further computations.
Before describing how linguistic responses are quantified, we emphasize one of the key concepts from fuzzy set theory used in this research, which is called a membership function. A membership function of a fuzzy setA relates the possible quantitative values the linguistic response may take and probabillty values that will be selected. For example, Figure 2 illustrates a triangle membership function that describes a single linguistic response.
ısmaıl Erol. Mehmet Barut. Developing Knowledge Based Decision Support Toollor Enlerprise Resources
.81
if x, a, b, C e R, a<b<c, and R = (-00, 00), the membership function, ıLA (x), is defined as:
i
(x - a)/(b - a), ıLA(x)= \
(c - x)/(e - b), O, a$xSb bSxSc otherwİseFYgure2:Triangular membership ji.ınction
To quantify a human response, Monte Carlo simulation is used to generate a value of the membership function corresponding to associated !inguistic variable. if desired, several replications can be used and averaged; however, since we are using a well-defined triangle distribution to offset laek of better information, a single replication is called to be suffident.
Relative to this research, the methodology assumes that several experts are available to express their rankings of the performance aspects and the relationships between performance ası;>ectsand enabler pairs. The proposed fuzzy QFD uses Monte Carlo simulation to quantify each response from the membership function and then averages the responses to achieve the final result. Table 1 provides a mathematical illustration of the membership functions displayed in Figure 1.
~.
Membership timetion- DomaIiı Triangular (min, mod:max) Fuzzy set
Very strong f1(x)=(x-7.5)/(1O.0-7.5) 7.5~X~ 10.0 7.5,10.0, 10.0 Strong f1(x)=(lO.0-x)/(10.0-7.5) 7.5~X ~10.0 5.0,7.5, 10.0 5.0~X~ 7.5 Medium f1(x)=(7.5-x)/(7.5-5.0) 5.0 ~x~ 7.5 2.5,5.0,7.5 Weak 2.5 ~x ~ 5.0 f1(x)=(5.0-x)/(5.0-2.5) 2.5 ~x~ 5.0 0.0,2.5,5.0 None 0~x~2.5 f1(x)=(2.5-x)/(2.5-0) O~x ~2.5 0.0,0.0,2.5
(3)
82 •
Ankara üniversitesi SBF Dergisi. 5&-1Now suppose M experts provide their opınıon on the relationship between performance aspect i and enabler j using these linguistic variable s given. The relationship score is calculated by:
M
.
L
[triang(LVf)]~j=m=l Viandj
M
where
MSC [triang (Lvr>J
=
Monte Carlo simulationvalue for linguisticvariable thatwaschosen by the expert mThe same process is repeated for each performance aspect - enabler pair to generate the entire set of relationship scores.
The relative importance of the performance aspect is similarly computed. The opinion of human experts concerning the ranking of each performance aspect is obtained. Although the terms used for the descriptions are likely different from those used to describe the relationship, we again denote the possible expressions LVk and define:
M
L
MCS [triang (LVf)]d;m=l Vi
M
Once diS and RijShave been calculated, RTIRjs are determined using equations (1) and (2). Hence, the degree to which each enabler satisfies performance aspects are computed.
4.2.2 The Method of Total Preferences
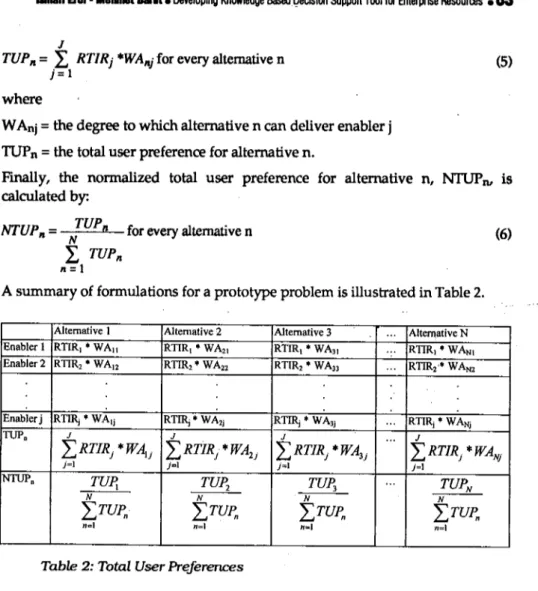
At this point, the linguistic input from cross functional team members has been quantified and an overall measure of how effectively each enabler satisfies the set of performance aspect has been computed via the ATIRs and RTlRs. Recall that the class of problems addressed by this methodology is restricted to decisions that require selecting from a finite set of alternative ERP products when there are multiple, conflicting objectives and the third functional element in the methodology is a multiobjective optimization modeL. The next step is to convert the information thus far developed into a format suitable to a mathematical programming modeL. The method of total preferences performs this function by using the RTIRs with additional member opinion to develop a single measure that reflects the total user preference for an alternative n, denoted by TUPn,which is computed as
ısmaıl Erol- MelımetBant. Developing Knowledge BasedQecisiOll SUpport Toollor Enlerprise Resources
.83
J
TUPıı =
L
RTIRj *WAııjfor every alternatiyen j=l(5)
(6) where
WAnj=the degree to which alternatiye n can deliver enabler j TUPn=the total user preference for alternatiye n.
Fınally, the normalized total user preference for alternatiye n, NTUPDI is
ca1culated by:
NTUP11= NTUP11 for everyalternatiyen
L
TUPıı11
=
1A summary of formulations for a prototype problem is illustrated in Table 2.
Alternative ı Alternative 2 Alternative 3 000 Alternative N
EnablerıRTlR, .WAıı RTIR1.WA21 RTIR •• WA3I 000 RTlR,. WAN1
Enabler2 RTlR2• WA'2 RTlR2• WA22 RTIR2• WA33 000 RTlR2'. WAN2
Enabler j RTl~.WAlj RT~.WA2j RTlRj• WA3j 000 R~.WANj
LUP. J J J 000 J
'LRTlRj *WAıj 'LRTlRj *WA2j 'LRTfRj *WA3j 'LRT1Rj *WANj
j~l j=l j=l j=l
NTIJP. TUPı
TUPı TUPı 000
TUPN
N N N N
'LTUp" 'LTUp" 'LTUp" 'LTUp"
n=l n~ı n=l "n==l
Table 2: Total User Preferences
Oearly, there is a missing piece in the above calculations, namely, how to determine the degree to which each enabler n can deliver enabler j,WAnj. These variables must be computed from input provided by the decision maker in his or her language. Note that the data gathered in data acquisition and assessment element is employed here in order for decision makers to generate their Unguistic responses regarding alternatives in terms of each enabler. We propose that the same strategy used to compute the djs be used to compute the WAnjs. As before, let LVk denote a linguistic response describing the degree to which the decision maker believes a particular enabler can be deliyered by a specified alternative. The Unguistic variables are then translated into fuzzy sets and the fuzzy sets are converted into numbers using Monte Carlo simulation. Hence,
84 •
Ankara üniversitesi SBF Dergisi. 58-1M
L
MSC(LVf')WAııjm=1 M n=l •...• Nandj=l •...• J
where
MCS [triang
(Lvr>]
Monte Carlo simulation value for linguistic variable LVkthat was chosen by expert ro
(7)
At this point, the data from the first functional element is in an appropriate format for the multiobjective model that will assist the human decision maker. The quantitative data was not alteredi however, the qualitative data has been quantified in the form of the NTUPs.
4.3 Multi-ObJective Model
The last element of the KBOS tool in an ERP selection problem is the multiobjective modeL. Obviously, no single model is capable of being applicable to all selection problem Sirather, at this point in the methodology a model must be built that represents the situation at hand. Here, we consider the classic conflict that frequently exists between maximizing user satisfaction and minimizing cost. Using the NTUPndeveloped above and letting TCnrepresent the total cost of alternatiye n, these objective functions of this general class of problems can be represented as:
N N
Maximize
rus
=L
NTUPn *XIIandMinimize TC =L
TCn*Xıın=1 n=1
st
XeS where
rus
=
Total User Satisfacation TC=
Total CostNTUPn
=
Norma1ized total User Preferences for vendor nTCn=Total Cost of vendor n
S=Feasible region
X _ { 1 if vendor n is selected
n - O otherwise .
To resolve this problem, a strategy that parallels preemptive goal programming is employed. The first sub-problem will treat the highest priority
ısmaıl Erol- Melımet Barut. Developing Knowledge Based Decision Support Toollor Enlerprise Resouraıs
.85
objective as the objective function. The constraints will inciude the secondary objective at a threshold level and, if needed, a threshold level for the primary objective as well. For example, suppose that there is a minimum acceptable level for rus, a maximum acceptable TC, and that rus is the primary objective. The first sub-problem that must be solved would be:
N
Maximize TUS
=
L
NTUPıı*Xıı11=1 st N
L
TCıı*x
ii ~ TCmaximlUft 11=1 NL
NTUPıı*Xıı ~ TUSminimlUft 11=1...•
KeS
Xne
(0,1) Vn where,TCmaximum Maximum allowable value of TC initially specified by the
decision maker
ruSminimum = Minimum allowable value of rus initially specified by the decision maker
The solution to this problem would yield an optimum value of ruS" which is then treated as the target rus for the second sub-problem in which minimizing TC is the objective.
N Minimize TC
= L
TCıı*Xıı 11=1 st NL
TCıı*Xıı ~ TCmaximum 11=1 NL
NTUPıı*Xıı ~ TUSminimum 11=1 ...•KeS
Xne (0,1) Vn86 •
Ankara üniversnesi SBF Dergisi. 58-1in real situations, however, it is unusual that the model can capture all aspects that a human dedsion maker must consider before a final selection is made. As such, providing onlyone solution is frequenUy undesirable. An alternatiye is to provide a number of feasible, compromise solutions that allows the dedsion maker to consider the strengths and weaknesses of each and integrate this information into the broader concems of the decision making process. Tp achieve this objective, we propose a sequential relaxation of the target value in the second sub-problem that relates to the optimal value from the first sub-problem. in the above example, altemative solutions would be generated by repeatedly solving the second sub-problem as the value of TUStargetis relaxed to deereasing levels. The decision maker is then presented a series of compromise solutions from which he or she can proceed having a quantitative-based starting point.
5. Ulustrative example
in this section, application of the proposed approach to an electronic components manufacturer that wished to replace its legacy information system with a state-of-the art ERP product is displayed. (Upon the company's request, we keep the name of the company confidential). The company is located in the southem part of the USA. The main purpose of this endeavor was to select an ERP product that would comprehensively serve all computing needs of this midsized company whose customers are industrial distributors and OEMs
(Original Equipment Manufacturers).
The first step in the selection process was to form a cross-functional team with a representative from each functional area to determine performance aspects and enablers and to gather the required data. The cross functional team with 5 members was then organized and trained on how to use the proposed
KBOS too!. Especially, some members with the basic mathematical
programming background assisted us a great deal in explaining the power and the robustness of this tool.
Once the team obtained the necessary knowledge about the tool, the discussion processes started and the team agreed that the evaluation eriteria ought to be comprehensive and relevant for an ERP software selection of a
midsized electronic components manufacturer. After conducting some
brainstorming sessions through team meetings and the company intranet, 4 performance aspects and 17 enablers as listed in Table 3 were identified that would be employed in further steps of the KBOS too!. The main objective of the team, in these sessions, was to account for the varying needs of each department.
ısmaıl Erol. Mehmet Barııt. Develaping Knowledge Based Decision SUpport Tool for Enlerprise Resources
.87
The following is the demonstration of translating input into parameters that can be used in a multiobjective model to seek the best ERP product for the company.
5.1. The Importanee of performance aspeets
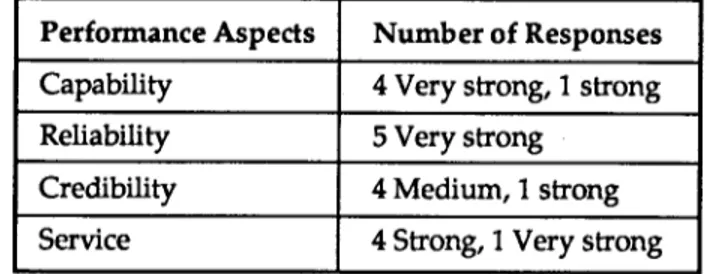
Once performance aspects and enablers have been determined, opinions of S team members have been obtained in the form of !inguistic variables such as "very strong", "strong", "medium", "weak" and "none" for each performance aspect as shown in Table 3 .
Performance Aspects Number of Responses
Capability 4 Very strong,
ı
strongReliability S Very strong
Credibility 4 Medium,
ı
strongService 4 Strong,
ı
Very strongTable 3: Frequency of Expert responses
For example, as four members considered capability "very strong", one daimed that it is a strong performance aspect. Then, deapability is ealculated using equation (4) as follows
4
L
MCS [ triang (L~ery suong)] +MCS [triang (LVstrong)]dcapability ==m_=~ı~ _
5
9.04 +9.68 +9.78 +9.6 +5.86
=
8.795
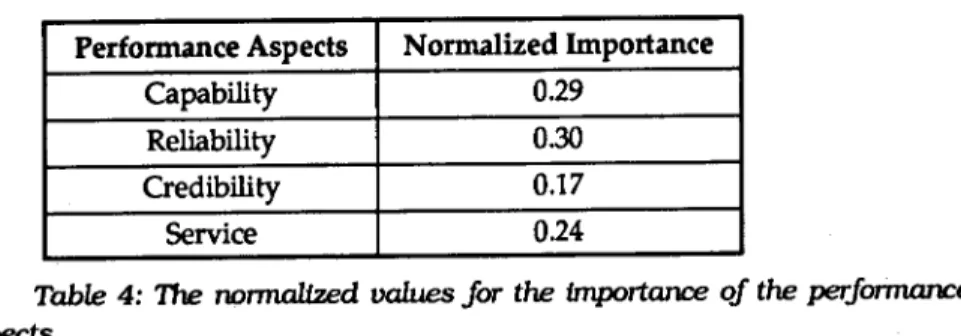
Note that performance aspects that are represented by !inguistic variable very strong are valued most by team members. The importance of each performance aspect was calculated in the same way using the inputs in Table 3. The normalized values for the importance of the performance aspects are provided in Table4.
88 •
Ankara üniversitesi S8F Dergisi. 58-1Performance Aspects Normalized Importance
Capability 0.29
Reliability 0.30
Credibility 0.17
Service 0.24
Table 4: Thenomıalized va1.uesfor the importance of the perfomıarıce aspects
5.2. Relatlonshlp scores
Team memher opinions have also been received regarding the
relationship hetween performance aspects and enablers. For example, 5 memhers claimed that the relationship hetween capability and increased transparency is very strongo Then, Rcapability-increasedtranspareneywas calculated using equation (3)
5
L
M C S [ triang (L~ery sırong)]Rcapability-irıcreased transpareney
=
=m_=~l _5
=
7.8 +8.82 +9.8+9.46 +9.55 - 9.0865
Once dis and Rijs have been calcUıated, the ATIRs and RTlRs were computed. As an example, consider the enabler "increased organizationa! flexibility" in which equations (1) and (2) yield,
ATlRincreasedorganizationa!flexibility=0.29it9.17 + 0.3it8.84
=
162RTIR increasedorganizationa!flexibility
=
162/2171.113=
0.07The results of the calculations for the remaining enablers are shown in Table 5 (Fuzzy QFD).
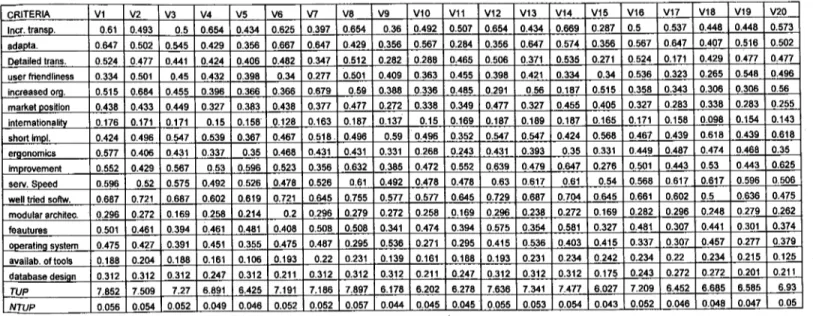
Once RTlRs have been obtained, the TUPs and NTUPs that will he input to the multi-objective modeling were calculated by using RFQs, RFPs and RFls that summarize the technical requirements for potential vendors. At this point, screening, which is very useful in cutting down the dimensions of the dedsion problem, was used. The company initially received 50 RFQs, RFPs and (or) RFls bad< from software vendors. However, 30 of them failed to meet some of the preliminary conditions of enablers and (or) cost, and they were rejected preemptively. As illustrated in Table 6, the table of TUPs consists of the possible ERP vendors arrayed across the top and the enablers listed along the side. in this example, the team considered 17 enablers from the fuzzy QFD process and 20 alternatiye vendors as candidates after screening.
-~ ~ en () ~ () ;ıı CD ~ @ ;ii ;ii ~. e' olc" olc" B-3 ~ ~ ~ ol ::ı :il ol ~ co ..., !" CD ol ~
t
-
..,
~ :..., <il CD CD c !=' c..,
-
c..,
Normalized importance ratings~ ..., (..ı CD
C
-
ol CDıncreased transpareney and belter information f10w
o ol
'"
o..., c ol ol
C
-
CD oladaptability and flexibility of software
o
'"
:... ~..., ol ol
C
~ ol ..., Detailed transaelion visibility
o :..., :ı..
o> ol
..,
CDC
~ CD ol
g
..,
ix> user friendliness'"
o> ~c
-
ol !"o ol
~ nereased organization flexibility
...,
'"
...,c
-
!" ...,market position of vendor
o
'"
'"
ol C'"
CD O" C ~ gı o :-ı CD internationality of software'"
-
..,
ol o-<il" c-
ol ol ol o'"
'" '"
sh ort implementation time..., ol ol ..., C
-
..., ..., ~rgonomie software o'"
..,
ix> ol o>'"
'"
c-
ol ol o'"
~'"
ımprovement of organizational struelure..., ol ol
C
-
!" olIspeed of the service support
o
'"
-
'"
..., c o>
'"
c
-
ol !" !LOf,veIJtried software system
o ~ (..ı
-ol ~
'"
...,c ..., ol
n,odular arehiteelure of software
o ~ ~
'"
ix> c ~ o> !" o'"
-
eatures/funelions ...,'"
CD ol C-
...,o> operating system independeney
o ~
'"
ol ol'"
C'"
o>availability of tools for software adoption
o !" :...,
'"
-
'"
c ..., ol database design ~. ...,:..., ~ ~~a
:::! ;o!!!.--'"
eRITERIA VL V2 V3 V4 V5 V6 v7 V8 V9 VL0 VLL V12 V13 V14 V15 V16 V17 V18 V19 V20 Iner. IranSD. 0.61 0.493 0.5 0.654 0.434 0.625 0.397 0.654 0.36 0.492 0.507 0.654 0.434 0.669 0.287 0.5 0.537 0.448 0.448 0.573 adaDıa. 0.647 0.502 0.545 0.429 0.356 0.667 0.647 0.429 0.356 0.567 0.284 0.356 0.647 0.574 0.356 0.567 0.647 0.407 0.516 0.502 Delailed lrans. 0.524 0.477 0.441 0.424 0.406 0.482 0.347 0.512 0.282 0.288 0.465 0.506 0.371 0.535 0.271 0.524 0.171 0.429 0.477 0.477 user friendliness 0.334 0.501 0.45 0.432 0.398 0.34 0.277 0.501 0.409 0.363 0.455 0.398 0.421 0.334 0.34 0.536 0.323 0.265 0.548 0.496 inereased ora. 0.515 0.684 0.455 0.396 0.366 0.366 0.679 0.59 0.388 0.336 0.485 0.291 0.56 0.187 0.515 0.358 0.343 0.306 0.306 0.56 mar1<el oosillon 0.438 0.433 0.449 0.327 0.383 0.438 0.377 0.477 0.272 0.338 0.349 0.477 0.327 0.455 0.405 0.327 0.283 0.338 0.283 0.255 inlemallonalitv 0.176 0.171 0.171 0.15 0.158 0.128 0.163 0.187 0.137 0.15 0.169 0.187 0.189 0.187 0.165 0.171 0.158 0.098 0.154 0.143 short imdI. 0.424 0.496 0.547 0.539 0.367 0.467 0.518. 0.496 0.59 0.496 0.352 0.547 0.547 0.424 0.568 0.467 0.439 0.618 0.439 0.618 eraonomics 0.577 0.406 0.431 0.337 0.35 0.468 0.431 0.431 0.331 0.268 0.243 0.431 0.393 0.35 0.331 0.449 0.487 0.474 0.468 0.35 Imorovemenl 0.552 0.429 0.567 0.53 0.596 0.523 0.356 0.632 0.385 0.472 0.552 0.639 0.479 0.647 0.276 0.501 0.443 0.53 0.443 0.625 serv.5Deed 0.596 0.52 0.575 0.492 0.526 0.478 0.526 0.61 0.492 0.478 0.478 0.63 0.617 0.61 0.54 0.568 0.617 0.617 0.596 0.506 welllried soflw. 0.687 0.721 0.687 0.602 0.619 0.721 0.645 0.755 0.577 0.577 0.645 0.729 0.687 0.704 0.645 0.661 0.602 0.5 0.636 0.475 modular arehilee. 0.296 0.272 0.169 0.258 0.214 0.2 0.296 0.279 0.272 0.258 0.169 0.296 0.238 0.272 0.169 0.282 0.296 0.248 0.279 0.262 feaulures 0.501 0.461 0.394 0.461 0.481 0.408 0.508 0.508 0.341 0.474 0.394 0.575 0.354 0.581 0.327 0.481 0.307 0.441 0.301 0.374 ODeralına svslem 0.475 0.427 0.391 0.451 0.355 0.475 0.487 0.295 0.536 0.271 0.295 0.415 0.536 0.403 0.415 0.337 0.307 0.457 0.277 0.379 avaiiab. oflools 0.188 0.204 0.188 0.161 0.106 0.193 0.22 0.231 0.139 0.161 0.188 0.193 0.231 0.234 0.242 0.234 0.22 0.234 0.215 0.125 dalabase desion 0.312 0.312 0.312 0.247 0.312 0.211 0.312 0.312 0.312 0.211 0.247 0.312 0.312 0.312 0.175 0.243 0.272 0.272 0.201 0.211 rup 7.852 7.509 7.27 6.891 6.425 7.191 7.186 7.897 6.178 6.202 6.278 7.636 7.341 7.477 6.027 7.209 6.452 6.685 6.585 6.93 NTUP 0.056 0.054 0.052 0.049 0.046 0.052 0.052 0.057 0.044 0.045 0.045 0.055 0.053 0.054 0.043 0.052 0.046 0.048 0.047 0.05
Table 6: TIJPSand NIUPsfor eoch ven.dor
8
•
~ ~ o ~. cil ""' ~. ~ ~ ~:•
!
ısmail Erol. Mehmet Barut. Developing Knowledge Based Decision Support Tool for Enlerprise Resources
.91
The entries in Table 6 are the TUP and NTUPs assodated with each enabler for
each software package. For example, average of the Monte Carlo simulation
values for the !inguistie variable "very strong" that the project team used to
describe the enabler "detailed transaetion visibility" was 8.9. Then,
TUP detailed transactionvisibility-V 1
=
RTlRdetailed transactionvisibility"WA detailed transactionvisibility-V 1
=
0.06 ••8.9=
0.525Then, NTUP is calculated using equation (6);
NTUPdet ailedtransactionvisibility-vı =L852.. = 0.056 139.22
This process was repeated until TUP and NTUP values eomputed for each
possible enabler - alternatiye pair. The results are displayed in Table 6.
5.3 Multi-Objective modeling
Onee the first and second elements of KBDS tool were eompleted, the
company, in this phase, used the eost information included in the RFQs and
ba1aneed the eost of the ERP software against the NTUPs. Note that the east
values are simpIified to facilitate readers' understanding. The eosts of the
produets obtained from RFQs for the products are displayed in Table 7.
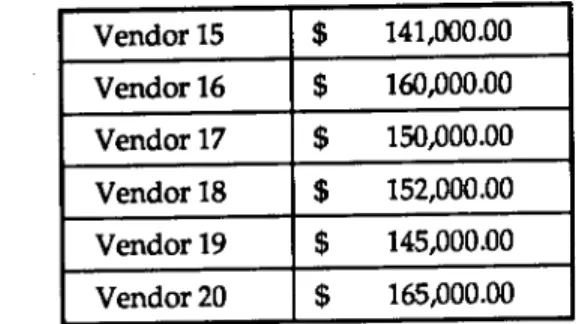
Vendor1 $ 195,000.00 Vendor2 $ 175,000.00 Vendor3 $ 159,000.00 Vendor4 $ 155,000.00 Vendor5 $ 145,000.00 Vendor6 $ 153,000.00 Vendor7 $ 168,000.00 Vendor8 $ 200,000.00 Vendor9 $ 138,000.00 Vendor 10 $ 125,000.00 Vendor II $ 156,000.00 Vendor 12 $ 165,000.00 Vendor13 $ 156,000.00 Vendor14 $ 155,000.00
92 •
Ankara üniversitesi SBFDergisi. 58-1 Vendor15 $ 141,000.00 Vendor16 $ 160,000.00 Vendor17 $ 150,000.00 Vendor18 $ 152,000.00 Vendor19 $ 145,000.00 Vendor20 $ 165,000.00Table 7: Total cost for each vendor's software
The project team then selected NTUP as the most important eriterion and TC as the secondary eriterion. They also dedded along with the managers in accounting department that TC mu st not be greater than $183,000. Since the NTUP has been selected as the most important criterion, the first problem to be solved was: 20 MaximizeNTUP
=
L
NTUPi*Xi i=ı st 20L
Ci*Xi ~ 183,000 i=ı XiE (0,1) i=
1,...,20The optimal solution to this problem was NTUP =0.0548TC =$165,000 and X. =Vendor 12.
The next problem was formulated relaxing NTUP to 0.053 and
minimizing TC as the objective function. Note that decreased NTUP value was used as a constraint. 20 Minimize TC
=
L
TCi*Xi i= ı st 20L
NfUPi*Xi ~ 0.053 i= ı 20L
TCi~ 165 i= ı Xi E (0,1) i=
1,...,20the optimal solution is TC.
=
$ 155,000NTUP=
0.0537 and the company should choose vendor 14.ısmaılErDI.Helımet Bant. Developing Knowledge Based Decision Support Toollor Enlerprise ResduralS.
93
By further relaxing the minimum acceptable NTUP, another alternatiye solution was generated as described previously and illustrated in Table 8. An important feature of the methodology was that the company would make a decision not only knowing the optimal solution for the preconceived target for the objective but also a quantitative sense for the tradeoff associated with accepting a lower level of NTUP to save some money. This type of information is invaluable in decision-making processes like software, material, vendor and equipment selection.NTUP TC Selected Vendor
0.0548 $165,100.00 Vendor12
0.0537 $155,000.00 Vendor14
0.0517 $153,000.00 Vendor16
Table 8Altemative solutions
Once the alternatiye vendors were generated using the multiobjective model, the company decided to analyze their products broadly by down1oading the demonstration copies from their Web sites and performing a comprehensive benefit analysis to finalize the selection process.
6. Discussion of the implications
An important advantage of the proposed multi-objective strategy is that it generates preferred alternatives while maintaining all parameters at acceptable levels. For example, user satisfaction is not sacrificed to an undesirable level to improve total cost. on the other hand, if the acceptable levels of the parameters cannot be satisfied, the problem dearly becomes infeasible and the decision maker must look for other alternatives or mu st modify inputs to the modeL. We believe that these features make this approach attractive to managers or practitioners.
in addition, the KBDS tool is based on a spreadsheet format that indudes Monte Carlo simulation and a solver, which makes it easy to opera te and affordable. However, it is imperative to note that the proposed KBDSSis a tool that is a part of a process not the complete process. in essence, for complex selections, such as this one, the decision maker-tool combination must work together to drive the solution since it is impossible to indude every aspect of the selection process in the modeL. in addition, long term effects of the products on the company's bottom-line must be considered before a fina! decision is made. 1£ this is achieved effectively, the results benefit the process and the pitfalls of past selection processes are avoided.
94 •
Ankara üniversitesi SBF Dergisi. 58-1The second element of the proposed tool, fuzzy QFD, enabled the organization to develop a concurrent working environment. Cross functional team members considered QFD structure very useful in team-based decision making processes and they contended that(l) the underıying idea behind QFD is based on team work, (2) it helped the team effectively use the other technical tools to support and complement each other and address the priority issue (3) it helped to pinpoint those areas of user concem where the team involvement and the use of spedalized tools could be most benefidal, and (4) because QFD had its origin with the user, it assisted the organization in gaining user focus. it was only through this focus that the organization began to understand what was needed to increase user satisfaction.
Further, the third element of the KBOS tool, a multiobjective model, was found to be valuable due to its simple structure and what-if capabilities. As highlighted previously, two members' basic knowledge of mathematical programming fadlitated the training sessions and enabled us to better communicate the capabilities of the proposed approach to the team while trying to satisfy multiple objectives that conflict.
7. Conclusion
Purehasing an information system, such as ERP is a project with significant finandal impact and involves making a decision based on both qualitative and quantitative information. Due to the significance of such a project, this study attempted to propose KBOS tool to al1eviate the difficulties encountered in ERP software selection projects. Further, a real case of an electronic component manufacturer's ERP selection process that used the proposed approach to assist the company was presented and discussed. KBOS tool was successfully used to narrow down the alternatives considered by the company. However, as emphasized before, the proposed tool does not substitute for a comprehensive benefit analysis to fina!ize the selection process in terms of long-term results of implementing altemative software packages. Also, we strongly believe that using demonstration copies and performing a detailed long-term benefit analysis before making the fina! decision is invaluable.
References
Al"ITHONY.T.F. / BUFFA. F.P. (1917) •• Strateglc purchase schedullng.' Journal of Purchasing and Mareria/s Management, Sprlng: 27.31.
AKAO. Y. (1990). Quality FuncUon Deployment: IntegraUng customer requirements irı/D Product Design
ısmaıl Erol. Melım8t Barllt. Develaping Kna.vledge Based Decision SUpport TooI for Enlerprise ReSources
.95
BERNROIDER, E.iKORCH, S. (2001), 'ERP selectlon process In mldslze and large organizations,' Buslness Process MarıagementJournal, Yol. 7, No. 3: 251.257.
BC.IFFA,F.P. (1983), 'Strateglc purcha5e scheduUng,' ..bumal of PWr:JıaSirıgand Materia/s Marıagement, Fall: 31-40.
CHEN, S. J. iHWANa, C. L (1992), FU74J Multiple AUribute Dec/sion Malcing: Method and Applicalions (New York: Sprlnger.Yerlııg).
F1ORE, J. (1999), APfCS Perfotrrıa=e Advanlage. September: 12. 15.
GHOOSYPQ(.JR, S.H.iO'BRIEN, C.O. (1998~ 'A declslon support system for suppIJer se\ectlon uslng an Integrated AHP and LP,' Intemaliona/..burnal o{ Production Econanics, 56.57: 199.212. HANDFlElD, R.I WALTON, S.Y.iSROOFE, R.iMEl.NYK, S.A. (2002), 'Applylng envlronmentlll crlterla to
suppller a&sessınent: A sb.ıdy in the appIJcatlon of the Analytlcal Hlerarchy Process,' European Journal o{OperaUonal Reseatr:h, 141: 70-87.
JUANG, C. H. iHUANG, X. H. i ELTON, D.J. (1991), 'Fuzzy Information Processıng by Mete Cario SImulation technlque,' ..burnal of Civil Engineering Systems, Vol. 8, No. 1: 19.25.
KASlUNGAM, R.G.iLEE, C.H. (1996), 'Se\ectlon of vendors.A m1xed.lnteger programmlng approach,'
Computer and Industri.al Engineering, 31: 347.350.
KHOO, LP iHO, N.C. (1996), 'Framework of a Fuzzy Quallty Functlon Deployınent System,' IntematIDnal Journal o{ ProducUon Researc:h, 34: 299.3 ıı.
KIM, K.iMOSKOWITZ, H.iDHINGRA, A.iEVANS, G. (2000), 'Fuzzy MuItl.Crlterla models for quallty functlon deployment,' European ..burnal of OperaUonal Researr:h, 121: 504.518.
KORPELA, J. iLEHMUSVAARA,A. (1999), 'A customer orlented approach to warehouse network evaIuation and design,' IntemaUonal..burnal ofProductIDn Economies, 59: 135.146.
LAI, V.S.iWONG, B.K.iCHEUNG, W. (2002), 'Group Declslon Maklng In a Multiple Crlterla envlronment: A case using the AHP In software selectlon,' European ..burnal of OperaUonal Researc:h, 137:
134.144.
W, /it i MADU, C.N. i WINOKUR, D. (1994), 'Integrating QFD, AHP and Benchmarklng In strategk marketing,' ..burnal o{Business Induslrial MarkeUng, 9 (ı):41.50.
MASUD,/it Abu (1993), 'Usıng Fuzzy sets In Quallty Functlon Deployment,' 200 Induslria/ Engineering
Researc:h Con{ererıee Proceedirıg!r.270.274.
MIN, H. (1992), 'The selectlon of Software: The Analytıc Hlerarchy Process,' IntemaUonal..bumal o{Physlcal Distribuuon and LogisUcs Management, Vol. 22 No. 1: 157.165.
MIN, J.H.iSCHIWNG, D. (1990), 'Multlobjectlve Analysls of Faclllty location Declslons,' European ..burnal
ofOperaUonal Researr:h, 49: 295.307.
MOORE, D.L i FEARON, H.E. (1973), 'Computer Asslsted Declslon.Maklng In Purchaslng,' ..burnal o{ Purc:hasirıg, Vol. 9, No. 4 (November): 5.25.
OLSON, D. L (2001), IntroducUon to lrı{omıaUon Systerns Project Marıagement (New York: Irwln.JIo\cGraw Hill).
PrAK, A.C.iSCHRAGENHEIM, E. (2000), ERP TooIs, Techrıiques and AppllcaUons {ar IntegraUng the Supply
Chain (Boca Raton, Florlda: CRC Press/APlCS Series on Resource Management, LLe). PAN, A. C. (1989), 'Ailocation of Order Quantlty among SuppIJers,' ..bumal o{ Purr:hasirıg and Materials
Management, .Vol.25, No. 3 (Autumn): 36.39.
PEGDEN, D.C.iSAHONNON, R.E. ISADOWSKI, R.P. (1995), IntrodueUon to Simulation Usifıg Siman (New York: JIo\cGrawHill).
96 •
Ankara Üniversitesi SBF Dergisi. 58-15OHN. S.Y.I CHO!. i. S. (2001), "Fuzzy QFD for supp1y cha!n management wlth rellabJlIty conslderatlon,"
Reliabillty engineering and System Safety, 72: 327.334.
SHEll.Y. Q. B.iCASHMAN, T. J. iVERMAAT. fo\. E. (2002), DlscolJerirıg Computos 2002: Concepts {or a
Digital World (Course Technology, Thomas Leamlng).
TEMPONI, C. IYEN, J.I TlAO, W. A. (1999), "House of Quallty: A fuzzy logic based requirement analysls,"
European Journal o{OperaliDnal Research. 117: 340.354.
THOMPSON, K.N. (1990), "Vendor proflle analysls," Journal Of Purr:Jıasirıg and Materia/s Management.
Winter: 11.18.
VANEQAS, LV.I LABlB, A. W. (2001). "A Fuzzy Qua\lty Functlon Deployment model for derlvlng optlnuım largets," IntemaliDnalJournal o{ProducUoıı Research. Vol. 39. No. 1: 99.120.
WEBER, C.E.I CURRENT. J.R. (1993). "A multi objective approach to vendar selectlon," European Journal
ofOperaUoııs Research, 68: 173.184.
WEBER. C.E.I CURRENT, J.R.I BENTON. W.C. (1991). "Vendor Selectlon Crlterla and Methods," European