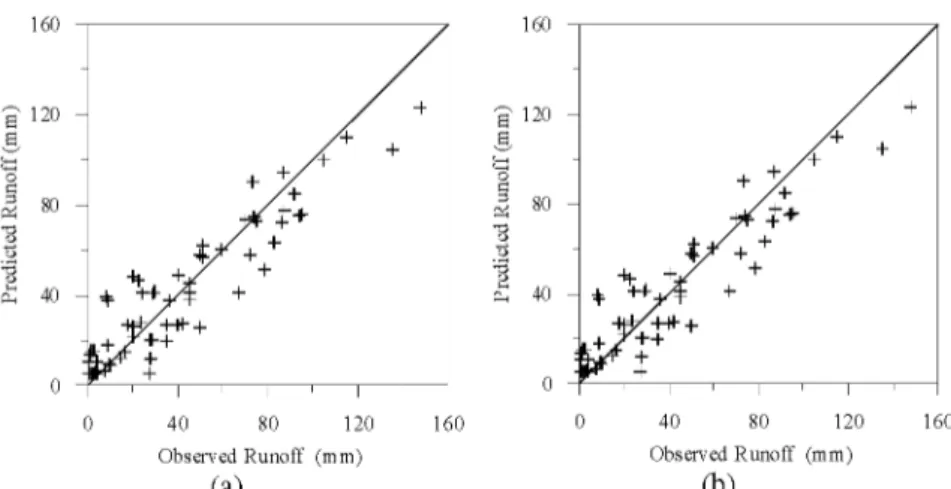
A Hierarchical Cluster-Based Fuzzy Rainfall-Runoff Model
Tam metin
Şekil
Benzer Belgeler
This study aims to use k-means cluster analysis to improve the standard setting process, to determine the passing score in two samples by three methods, to examine the
The role of Helicobacter pylori infection in the cause of squamous cell carcinoma of the larynx. Nomura A, Stemmermann GN, Chyou PH, Kato I, Perez-Perez GI,
Bu baba, çevre sinde çok küçük yaştan beri güzel sanatların heyecanı ile yoğrulm uş, eli kalem tutmaya hakim olduğu andan itibaren güzel yazı ve resim
So we can conclude that using fuzzy logic for preference relations on each possible pair of alternative candidates, and for expressing self-confidence levels on the
In this thesis, we searched a decision making model for the same problem using fuzzy-valued Choquet integral instead of the Sugeno integral to calculate the fuzzy utility
Radyo ve televizyonun, Türk olduğundan kuşku duyan Av rupalIlara, Türk ve müslüman ol duğunu ispatlamak zorunda kalan bu büyük adamı aramayışıdır. Batı
Bu yönlerle ilişkili oranlarının çevrimleri alınarak minör aralıkları temsil eden yönler belirlenir, örneğin minör altılı aralık büyük üçlü yönü- nün çevrimi
Bu çalışmada, elektif sezaryen operasyonlarında peri- operatif iv uygulanan parasetamolün analjezik etkisi, postoperatif hasta kontrollü analjezi (HKA) yöntemi ile
