2020/05/14
CMS-EXO-19-012
Search for high mass dijet resonances with a new
background prediction method in proton-proton collisions
at
√
s
=
13 TeV
The CMS Collaboration
∗Abstract
A search for narrow and broad resonances with masses greater than 1.8 TeV decay-ing to a pair of jets is presented. The search uses proton-proton collision data at
√
s = 13 TeV collected at the LHC, corresponding to an integrated luminosity of 137 fb−1. The background arising from standard model processes is predicted with the fit method used in previous publications and with a new method. The dijet in-variant mass spectrum is well described by both data-driven methods, and no signif-icant evidence for the production of new particles is observed. Model independent upper limits are reported on the production cross sections of narrow resonances, and broad resonances with widths up to 55% of the resonance mass. Limits are presented on the masses of narrow resonances from various models: string resonances, scalar diquarks, axigluons, colorons, excited quarks, color-octet scalars, W0 and Z0 bosons, Randall–Sundrum gravitons, and dark matter mediators. The limits on narrow res-onances are improved by 200 to 800 GeV relative to those reported in previous CMS dijet resonance searches. The limits on dark matter mediators are presented as a func-tion of the resonance mass and width, and on the associated coupling strength as a function of the mediator mass. These limits exclude at 95% confidence level a dark matter mediator with a mass of 1.8 TeV and width 1% of its mass or higher, up to one with a mass of 4.8 TeV and a width 45% of its mass or higher.
”Published in the Journal of High Energy Physics as doi:10.1007/JHEP05(2020)033.”
c
2020 CERN for the benefit of the CMS Collaboration. CC-BY-4.0 license
∗See Appendix A for the list of collaboration members
els. String resonances [1, 2] originate from the Regge excitations of quarks and gluons. Scalar diquarks [3] are predicted by a grand unified theory based on the E6gauge symmetry group. Mass-degenerate excited quarks (q∗) [4, 5] appear in quark compositeness models. Axigluons and colorons, axial-vector and vector particles, are expected in the chiral color [6, 7] and the flavor-universal coloron [7, 8] models, respectively. Color-octet scalars [9] appear in dynamical electroweak (EW) symmetry breaking models, such as technicolor. New gauge bosons (W0and Z0) can exist with standard model (SM) like or leptophobic couplings [10]. Randall–Sundrum (RS) gravitons are predicted in the RS model of extra dimensions [11]. Dark matter (DM) me-diators arise from an interaction between quarks and DM [12–15]. The natural width,Γ, of a new particle increases with its coupling strength to other states, and may vary from narrow to broad, as defined in comparison to the experimental resolution.
This paper describes a model-independent search for a narrow or broad s-channel dijet reso-nance with a mass above 1.8 TeV, in proton-proton (pp) collisions at√s = 13 TeV. This search uses data corresponding to an integrated luminosity of 137 fb−1collected in 2016–2018 with the CMS detector at the LHC. Similar searches have been published previously by the ATLAS and CMS Collaborations at√s = 13 TeV [16–21], 8 TeV [22–25], and 7 TeV [26–32] using strategies reviewed in Ref. [33]. Results of the search are interpreted using as benchmarks the models described above. As no excess above the SM was observed, we set limits on the production cross sections of new particles decaying to the parton pairs qq (or qq), qg, and gg. We then use these limits to constrain the benchmark models, with the same choices of parameters as those that were used in the most recent CMS search [17], which used data corresponding to an integrated luminosity of 36 fb−1. In the color-octet scalar model, the squared anomalous coupling k2s = 1/2 [34] is used. For the RS graviton model, the value of the dimensionless coupling k/MPlis chosen to be 0.1, where k is the curvature scale in the 5-dimensional anti de Sitter space and MPlis the reduced Planck scale defined as MPl/√8π. For the DM mediator, we follow the recommendations of Ref. [15] on model choice and coupling values. We use a simplified model [14] of a spin-1 mediator decaying only to quark-antiquark (qq) and DM par-ticle pairs, with an unknown mass mDM, and with a universal quark coupling gq =0.25 and a DM coupling gDM=1.0.
Similar to past searches, and for dijet mass (mjj) greater than 1.5 TeV, the main background from quantum chromodynamics (QCD) multijet production is predicted by fitting the mjj dis-tribution with an empirical functional form. For mjj > 2.4 TeV, a new data-driven method is introduced, which predicts the background from a control region where the pseudorapidity separation of the two jets,|∆η|, is large. This new ”ratio method” yields smaller systematic un-certainties when performed in the same dijet mass range as the ”fit method”, and the sensitivity for broad resonance searches is improved by up to a factor of two depending on the resonance width and mass. In addition, the total integrated luminosity for this search is roughly a factor of four larger than that used by the previous CMS search [17], so the sensitivity of both narrow and broad resonance searches has also increased by up to an additional factor of two.
2
The CMS detector
A detailed description of the CMS detector and its coordinate system, including definitions of the azimuthal angle φ and pseudorapidity η, is given in Ref. [35]. The central feature of the CMS apparatus is a superconducting solenoid of 6 m internal diameter providing an
ax-ial magnetic field of 3.8 T. Within the solenoid volume are located the silicon pixel and strip tracker (|η| <2.4), and the barrel and endcap calorimeters (|η| <3.0), where these latter
detec-tors consist of a lead tungstate crystal electromagnetic calorimeter and a brass and scintillator hadron calorimeter. An iron and quartz-fiber hadron calorimeter is located in the forward region (3.0 < |η| < 5.0), outside the solenoid volume. The muon detection system covers
|η| <2.4 with up to four layers of gas-ionization chambers installed outside the solenoid and
embedded in the layers of the steel flux-return yoke.
3
Jet reconstruction and event selection
A particle-flow (PF) event algorithm aims to reconstruct and identify each individual particle in an event, with an optimized combination of information from the various elements of the CMS detector [36]. Particles are classified as muons, electrons, photons, charged hadrons, or neutral hadrons. To reconstruct jets, the anti-kTalgorithm [37, 38] is used with a distance parameter of 0.4, as implemented in the FASTJETpackage [39]. At least one reconstructed vertex is required. Charged PF candidates not originating from the primary vertex are removed prior to the jet finding. The candidate vertex with the largest value of summed physics-object p2T, where pT is the transverse momentum, is taken to be the primary pp interaction vertex. The physics objects are the jets, clustered using the jet finding algorithm mentioned above, with the tracks assigned to candidate vertices as inputs, and the associated missing transverse momentum, taken as the negative vector sum of the pT of those jets. For jets, an event-by-event correction based on jet area [40, 41] is applied to the jet energy to remove the estimated contribution from additional collisions in the same or adjacent bunch crossings (pileup).
Events are selected using a two-tier trigger system [42]. Events satisfying loose jet requirements at the first-level (L1) trigger are examined by the high-level trigger (HLT) system. Single-jet triggers that require a jet in the event to exceed a predefined pT threshold are used. Triggers that require HT to exceed a threshold, where HT is the scalar sum of jet pT for all jets in the event with pT > 30 GeV and|η| < 3.0, are also used. The HLT requires: HT > 1050 GeV or at
least one jet reconstructed with an increased distance parameter of 0.8 and pT >550 GeV. The jet momenta and energies are corrected using calibration factors obtained from simulation, test beam results, and pp collision data at√s=13 TeV. The methods described in Ref. [41] are used and all in-situ calibrations are obtained from the current data. Jets are required to have pT > 30 GeV and|η| <2.5. The two jets with the largest pT are defined as the leading jets. Jet
identification criteria are applied to remove spurious jets associated with the calorimeter noise as well as those associated with muon and electron candidates that are either misreconstructed or isolated [43]. For all jets, we require that the neutral hadron and photon energies are less than 90% of the total jet energy. For jets within the fiducial tracker coverage, we additionally require the jet to have nonzero charged-hadron energy, and electron and muon energies to be less than 90% and 80% of the total jet energy respectively. An event is rejected if either of the two leading jets fails these jet identification criteria.
Each of the two leading jets is formed into a “wide jet” using an algorithm introduced for previous CMS dijet searches in Ref. [23]. This wide-jet algorithm, designed for dijet resonance event reconstruction, reduces the sensitivity of the analysis to gluon radiation (g) from the final-state partons. The two leading jets are used as seeds and the four-vectors of all other jets, if within a distance defined as
√
(∆η)2+ (∆φ)2 < 1.1, are added to the nearest leading jet to obtain two wide jets, which then form the dijet system. The dijet mass is then found as the invariant mass of the system of these two wide jets. The wide-jet algorithm thereby collects
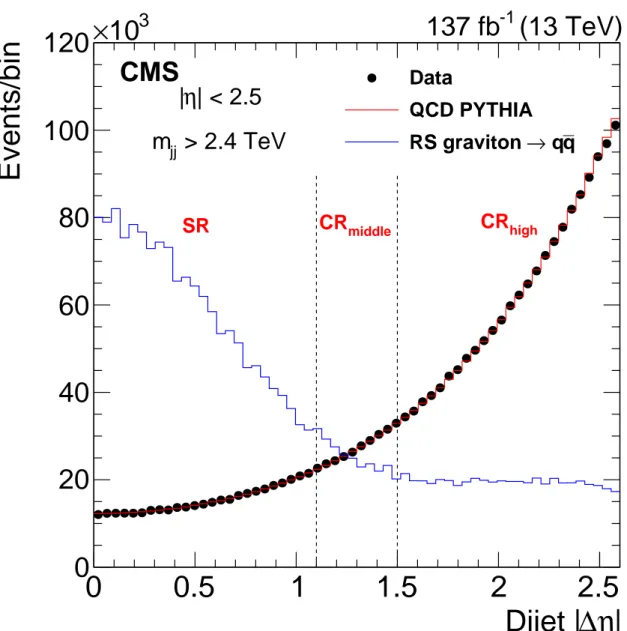
The background from t-channel dijet events has the same angular distribution as Rutherford scattering, approximately proportional to 1/[1−tanh(|∆η|/2)]2, which peaks at large values of |∆η|, the pseudorapidity separation of the two jets. The signal region (SR) is defined by requir-ing|∆η| <1.1, which maximizes the search sensitivity for isotropic decays of dijet resonances in the presence of QCD dijet background. For the ratio method of estimating the background, two control regions (CRs) are defined from events within 1.1< |∆η| <2.6. The primary control region, CRhigh, which contains events that satisfy 1.5< |∆η| <2.6, is used to predict the main QCD background in the SR. The secondary control region, CRmiddle, which contains events that satisfy 1.1< |∆η| <1.5, is used to constrain theoretical and experimental systematic uncertain-ties. The CRhighis defined such that it has four to five times more background events than the SR, and at the same time fewer signal events by a factor of two. The SR is used to search for the presence of resonances and to estimate the QCD background for the fit method.
Events with mjj >1.5 TeV are selected offline, for which the|∆η|between the two jets is in the interval|∆η| < 2.6, where the dijet mass and|∆η|are reconstructed using wide jets. For this selection the combined L1 trigger and HLT was found to be fully efficient, as measured using a sample acquired with an independent trigger requiring at least one muon with pT >50 GeV at the HLT. The|∆η| <1.1 requirement makes the trigger efficiency increase sharply and plateau at a value of 100% for relatively low values of dijet mass. This is because the jet pTthreshold of the trigger at a fixed dijet mass is more easily satisfied at low|∆η|, as seen by the approximate relation mjj ≈ 2pTcosh(|∆η|/2). Hence, the trigger efficiency reaches 100% in the SR at a lower value of dijet mass (1.5 TeV) than in both CRs (2.4 TeV). Therefore the fit method is used for mjj > 1.5 TeV and the ratio method, which requires data from the CRs with 100% trigger efficiency, is used for mjj>2.4 TeV.
4
Data and simulation comparison
As the dominant background for this analysis is expected to be the QCD production of two or more jets, the selected dijet data are compared with QCD predictions. The predictions come from 270 million simulated events produced by thePYTHIA8.205 [44] program with the CUETP8M1 tune [45, 46] using the parton distribution function (PDF) set NNPDF2.3LO [47], including a GEANT4-based [48] simulation of the CMS detector. The data-over-simulation
ra-tio of event yields is 0.94. This search uses the signal shapes of narrow and broad resonances presented in Ref. [17], which are also from aPYTHIAsimulation.
The dijet|∆η|separation between the two wide jets is shown in Fig. 1. The data distribution shows that dijet production is dominated by t-channel parton exchange, as predicted by QCD, with a production rate that increases with increasing|∆η|. By contrast, most s-channel signals from dijet resonances decrease with increasing|∆η|, as the signal shown does. Figure 1 shows the division of the|∆η|distribution into the signal and control regions.
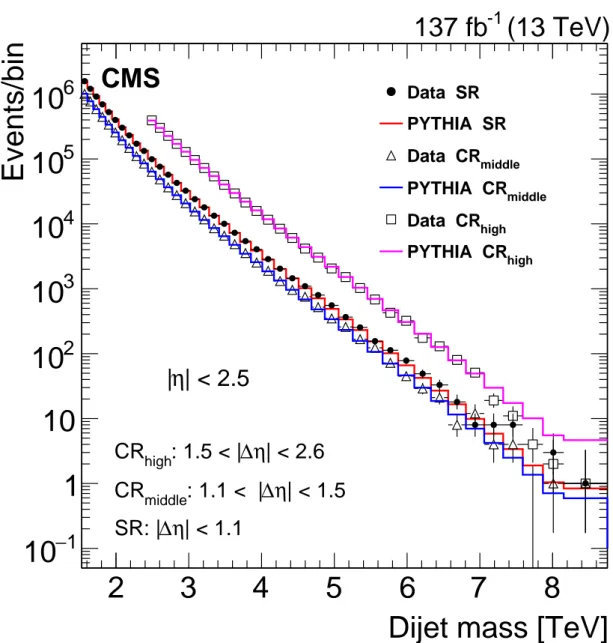
Figure 2 shows, for both data and the QCD background, the dijet mass spectra in the signal and control regions, which fall steeply and smoothly as a function of dijet mass. The observed dijet mass distributions are compared to the QCD background prediction fromPYTHIA, which simulates processes at leading order (LO).
We inspect the characteristics of the 23 events with mjj > 7 TeV, to determine if they have the two-jet topology typical of the QCD background and to check for the presence of detector and
|
η
∆
Dijet |
0
0.5
1
1.5
2
2.5
Events/bin
0
20
40
60
80
100
120
3
10
×
CMS
(13 TeV)
-1137 fb
SR
CR
middleCR
high| < 2.5
η
|
> 2.4 TeV
jjm
Data
QCD PYTHIA
q
q
→
RS graviton
Figure 1: The pseudorapidity separation between the two wide jets for the signal and control regions. Data (black points) are compared to QCD predictions from the PYTHIAMC with de-tector simulation (red histogram) normalized to data. A signal from an RS graviton decaying into a qq pair is also shown (blue histogram) normalized to data.
Dijet mass [TeV]
2
3
4
5
6
7
8
Events/bin
1
−
10
1
10
2
10
3
10
4
10
5
10
6
10
Data SR PYTHIA SR middle Data CR middle PYTHIA CR high Data CR high PYTHIA CRCMS
(13 TeV)
-1137 fb
| < 1.1
η
∆
SR: |
| < 1.5
η
∆
: 1.1 < |
middleCR
| < 2.6
η
∆
: 1.5 < |
highCR
| < 2.5
η
|
Figure 2: The dijet mass spectra of the data and PYTHIA simulation in the signal region at low |∆η|(black points and red histogram), control region at middle |∆η|(triangles and blue histogram), and control region at high|∆η|(squares and magenta histogram). The simulation is normalized to data.
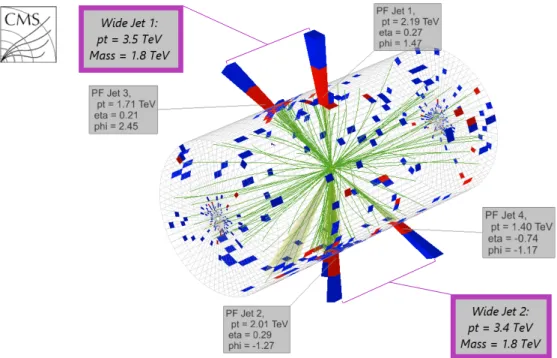
reconstruction pathologies, and we find the one unusual event, shown in Fig. 3. This event is the one with the second highest dijet mass, 8 TeV, and is unusual because it is composed of four jets, in two pairs, which are combined into the two wide jets. It is also unusual because the wide jet mass, equal to the pair mass of the jets, has the same value 1.8 TeV for each of the two wide jets. The leading wide jet has a pT of 3.5 TeV, and the other wide jet has a pT of 3.4 TeV. The wide jets are back-to-back in azimuthal angle (∆φ = 3.1) and nearby in pseudorapidity (|∆η| =0.4). Each one of the two wide jets is composed of two jets with cone size 0.4, with pT,
η, and φ values as shown in Fig. 3.
Figure 3: Three-dimensional display of the event with the second-highest dijet invariant mass of 8 TeV. The display shows the energy deposited in the electromagnetic (red) and hadronic (blue) calorimeters and the reconstructed tracks of charged particles (green). The grouping of four observed jets into two wide jets (purple) is discussed in the text.
The possibility that this event originates from a resonance decaying to a pair of dijet resonances has been recently explored in a phenomenology paper [49].
5
Background prediction methods
In the fit method, utilized here and in previous dijet resonance searches [17, 19–32, 50], the main background in the SR coming from QCD is parametrized with an empirical function of the form
dσ dmjj =
P0(1−x)P1
xP2+P3ln(x), (1)
where x = mjj/√s, and P0, P1, P2, and P3 are four free parameters. The search for resonances proceeds with fitting the dijet mass distribution in the SR using this background parametriza-tion and the signal template obtained from simulaparametriza-tion, a procedure denoted as a signal plus background fit. In this fit, P0, P1, P2, and P3are treated as freely floating nuisance parameters. In order to examine the compatibility of the data with the background-only description, and the
of the background-only fit is χ /NDF=36.63/38, as shown in Fig. 5.
The ratio method is a data-driven prediction of the QCD background in the SR, obtained by multiplying the data in CRhighby a mass-dependent transfer factor determined from the simu-lated angular distribution of QCD dijet production. The transfer factor is the ratio, R, between the simulated dijet mass distribution of background events in the SR and CRhigh. The method makes use of the following definitions:
N(i)PredictionSR = R(mjj/√s)N(i)DataCR high,
R(mjj/√s) =C(mjj/√s)N(i)Sim.SR /N(i)Sim.CR high,
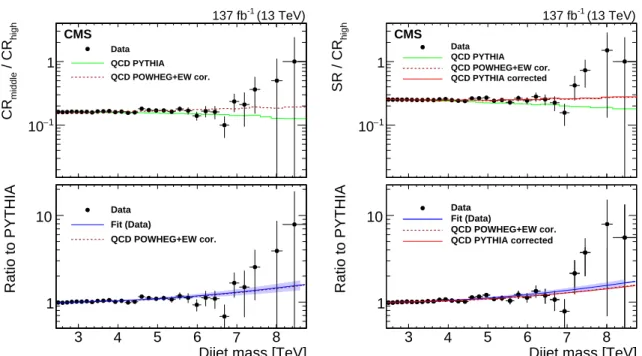
where N(i)is the number of events in a given bin, i, of dijet mass and C(mjj/√s)is a correction to the simulated transfer factor. This correction is required because, as seen in the upper right panel of Fig. 4, differences are present between data and the simulation usingPYTHIA. These
are due to both theoretical and experimental effects. The theoretical effects arise because the
PYTHIAsimulation uses a QCD calculation at LO, and higher order QCD corrections have some effect, and so do missing EW corrections. Figure 4 shows, with a smaller sample of events, that a better agreement is obtained when these corrections are included, by generating events at next-to-leading order (NLO) in QCD withPOWHEGv2.0 [51–53] and incorporating an estimate of EW effects [54]. Experimental effects include differences between data and simulation at higher jet pseudorapidities outside the barrel calorimeter region (|η| >1.3). The higher-order
QCD and EW effects, and the differences between data and simulation at higher jet pseudo-rapidity values, produce a similar effect on the shape of the transfer factor, affecting mainly the high dijet mass region. We correct the simulated transfer factor to include these effects in a data-driven way, using the second control region, CRmiddle, which is a|∆η|sideband to the SR. This second control region contains dijet events with values of jet pseudorapidity very similar to those in the SR, and has a very small signal contamination. As such, the dijet mass distribu-tion of this control region is very similar to that of the SR, and the differences between data and simulation in this control region are caused by similar theoretical and experimental effects as observed in the SR. Hence, this second CR allows the definition of an auxiliary transfer factor, Raux, shown in Eq. (2).
Raux(i) =N(i)CR
middle/N(i)CRhigh. (2)
We then estimate the correction, C, to the main transfer factor, R, by performing a fit to the data-over-simulation ratio of Raux(Eq. (3)):
RDataaux /RSim.aux, (3) with the correction parametrized using a two-parameter empirical function, shown in Eq. (4).
C(mjj/√s) = p0+p1(mjj/√s)3. (4) The data to simulation ratios of the two transfer factors, Rauxand R, along with their background-only fits, performed separately in order to examine their compatibility, are shown in the lower panels of Fig. 4 and agree to within their uncertainty at 95% confidence level (CL). Specifically,
the values of the parameters and their statistical uncertainties from the background-only fits of the data to simulation ratios of Raux are p0 = 0.977±0.004 and p1 = 2.07±0.33, and of R are p0 = 0.972±0.004 and p1 = 2.52±0.28, and are entirely compatible. This agreement is ex-pected given that the events in CRmiddleand SR have, by construction, very similar jet η and mjj distributions. Parameters p0and p1are treated as free nuisance parameters in the final signal plus background simultaneous fit of the SR, CRmiddleand CRhigh, taking the signal contamina-tion in the control regions into account as described in the next paragraph. The simultaneous background-only fit yields p0 = 0.973±0.003 and p1 = 2.38±0.23, consistent with the sep-arate background-only fits shown in Fig. 4 (lower panels), and with smaller uncertainty. The systematic uncertainty in the background, for both methods, is automatically evaluated via profiling. This effectively refits for the optimal values of the background parameters, allowing them to float freely, for each value of the resonance cross section.
The signal contamination in the CRs depends on the angular distribution of the model. For the models considered in this search, the signal contamination is small compared to the back-ground. This is because we search for dijet resonances produced in the s-channel annihilation of two partons, while the QCD background is predominantly a t-channel process. We assume the signal has the same angular distribution as a vector resonance decaying to qq pairs. The signal contamination is taken into account in the simultaneous fit. The change in extracted signal is negligible if the angular distribution of any of our other benchmark models is chosen instead. Our benchmark models include scalars coupled to qq or gg pairs, fermions coupled to qg pairs, vectors coupled to qq pairs, and tensors coupled to qq or gg pairs.
Detailed signal injection tests are performed to investigate the potential bias in each back-ground prediction method, and the bias is found to be negligible when either the fit method or the ratio method is employed. The signal injection tests are performed as follows: pseudo-data distributions are generated, varying the parameters of the background prediction and inject-ing a signal with a cross section equal to i) zero, ii) the 95% CL observed limit, and iii) two times the 95% CL observed limit. These distributions are created for several resonance masses and widths, spanning the entire range for which results are reported. Then, the same fitting procedure followed in the analysis of the actual data is repeated for each pseudo-data distribu-tion, and the fitted signal cross secdistribu-tion, along with its 68% CL standard deviadistribu-tion, is obtained. We examine the distribution of the bias in units of standard deviations, namely the difference between the injected signal cross section and the fitted signal cross section, divided by the stan-dard deviation of the fit. For all resonance masses, widths, and signal strengths considered, the mean bias is less than one half a standard deviation, and in the vast majority of the cases it is well below this criterion. In addition, pseudo-data distributions are generated using different empirical functional forms than the ones used in the actual data fits, and the entire procedure is repeated, again yielding negligible biases.
The ratio method is an independent approach compared to the fit method, yielding consistent results. The ratio method provides a background estimate that is derived primarily from con-trol regions, while the fit method uses only the signal region. The ratio method also provides a background estimate that is more accurate than the fit method. This is because the ratio method fits the data with only two parameters, while the fit method requires four, and because the estimate from the ratio method is additionally constrained by the control region CRmiddle. The advantages of this method, as opposed to the fit method, are the following: i) it provides a background estimate independent of the signal region, which results in an independent and less biased value of the observed signal significance, ii) as the resonance width increases the ra-tio method has smaller background uncertainty compared to the fit method, and hence higher sensitivity. Therefore, we estimate the background using the ratio method instead of the fit
3000 4000 5000 6000 7000 8000 high / CR middle CR −1 10 1 Data QCD PYTHIA QCD POWHEG+EW cor. CMS (13 TeV) -1 137 fb
Dijet mass [TeV]
Ratio to PYTHIA 1 10 3 4 5 6 7 8 Data Fit (Data) QCD POWHEG+EW cor. 3000 4000 5000 6000 7000 8000 high SR / CR 1 − 10 1 Data QCD PYTHIA QCD POWHEG+EW cor. QCD PYTHIA corrected CMS (13 TeV) -1 137 fb
Dijet mass [TeV]
Ratio to PYTHIA
1
10 Data Fit (Data)
QCD POWHEG+EW cor. QCD PYTHIA corrected
3 4 5 6 7 8
Figure 4: The ratio Raux, the auxiliary transfer factor, calculated for data,PYTHIA, andPOWHEG
with electroweak corrections (left, upper panel). The double ratio of the same quantities in the upper left panel to RauxfromPYTHIA, along with the fit of the double ratio for data with the cor-rection function (left, lower panel). The ratio R, the transfer factor, calculated for data,PYTHIA,
POWHEGwith electroweak corrections, and correctedPYTHIA(right, upper panel). The double
ratio of the same quantities in the upper right panel to R fromPYTHIA, along with the fit of the
double ratio for data with a correction function, and corrected PYTHIA using CRmiddle (right, lower panel). The fits in the two lower panels agree with each other within their uncertainty at 95% CL (shaded bands).
method for mjj>2.4 TeV.
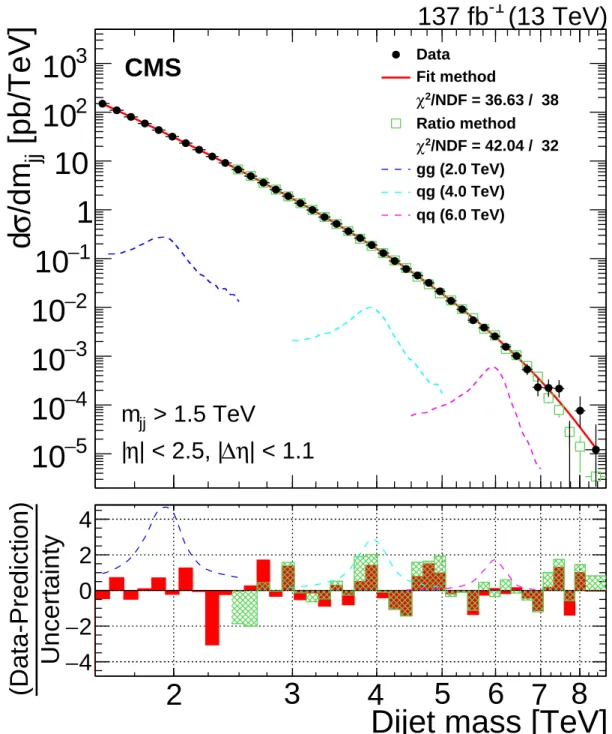
Figure 5 shows the dijet mass spectrum, defined as the observed number of events in each bin divided by the integrated luminosity and the bin width. The bin widths depend on the dijet mass and are chosen to correspond to dijet mass resolution. The bin edges were chosen to be the same as those used by previous dijet resonances searches performed by the CMS Collaboration, as introduced in Ref. [31]. Figure 5 also shows the background prediction from the fit method, compared to all data, and the background prediction from the ratio method, compared to data with mjj > 2.4 TeV. The χ2/NDF of the background-only fit, masking the signal region, with the ratio method is 42.04/32 as shown in Fig. 5. The dijet mass spectrum is well modeled by both background prediction methods, which also agree with one another.
6
Limits on the resonance cross section, mass, and coupling
We use the dijet mass spectrum from wide jets, the background parameterizations, and the dijet resonance shapes shown previously to set limits on the production cross sections of new particles decaying to the parton pairs qq (or qq), qg, and gg. A separate limit is determined for each final state (qq, qg, and gg) because of the dependence of the dijet resonance shape on the types of the two final-state partons.
The dominant sources of systematic uncertainty are the jet energy scale and resolution, the integrated luminosity, and the values of the parameters within the functional form modeling the background shape in the dijet mass distribution. The uncertainty in the jet energy scale is within 2% for all values of the dijet mass and is determined from√s = 13 TeV data using the methods described in Ref. [41]. This uncertainty is propagated to the limits by shifting the dijet mass shape for the signal by±2%. The uncertainty in the jet energy resolution translates into an uncertainty of 10% in the resolution of the dijet mass [41], and is propagated to the limits by observing the effect of increasing and decreasing by 10% the reconstructed width of the dijet mass shape for the signal. The uncertainty in the integrated luminosity is 2.5% in 2016 [55] and 2018 [56], and 2.3% in 2017 [57], and is propagated to the normalization of the signal. Changes in the values of the parameters describing the background introduce a change in the signal yield, which is accounted for as a systematic uncertainty, as discussed in the next paragraph. The modified frequentist criterion [58, 59] is used to set upper limits on signal cross sections, following the prescription described in Refs. [60, 61] using the asymptotic approximation of the test statistic. We use a multi-bin counting experiment likelihood, which is a product of Poisson distributions corresponding to different bins. We evaluate the likelihood independently at each value of resonance pole mass from 1.8 to 8.7 TeV in 100-GeV steps. The fit method is used to estimate the background for resonance masses from 1.8 to 2.9 TeV, and the ratio method is used for resonance masses from 3.0 to 8.7 TeV. The minimum values of resonance mass for the two methods, 1.8 and 3.0 TeV, are chosen to maintain reasonable acceptances for the minimum mjjrequirements, 1.5 and 2.4 TeV, respectively. The sources of systematic uncertainty are implemented as nuisance parameters in the likelihood model, with Gaussian constraints for the jet energy scale and resolution, and log-normal constraints for the integrated luminosity. The background systematic uncertainty, as we described previously, is automatically evaluated via profiling and decreases as the resonance mass increases.
6.1 Narrow resonances
Figures 6 and 7 show the model-independent observed upper limits at 95% confidence level on the product of the cross section (σ), the branching fraction (B), and the acceptance (A) for
[pb/TeV]
jj
/dm
σ
d
5
−
10
4
−
10
3
−
10
2
−
10
1
−
10
1
10
2
10
3
10
Data Fit method/NDF = 36.63 / 38 2 χ Ratio method /NDF = 42.04 / 32 2 χ gg (2.0 TeV) qg (4.0 TeV) qq (6.0 TeV)
CMS
(13 TeV)
-1137 fb
> 1.5 TeV
jjm
| < 1.1
η
∆
| < 2.5, |
η
|
Dijet mass [TeV]
Uncertainty
(Data-Prediction)
4
−
2
−
0
2
4
2
3
4
5
6 7 8
Figure 5: Dijet mass spectrum in the signal region (points) compared to a fitted parameter-ization of the background (solid line) and the one obtained from the control region (green squares). The lower panel shows the difference between the data and the fitted parametrization (red, solid), and the data and the prediction obtained from the control region (green, hatched), divided by the statistical uncertainty in the data, which for the ratio method includes the sta-tistical uncertainty in the data in the control region. Examples of predicted signals from nar-row gluon-gluon, quark-gluon, and quark-quark resonances are shown (dashed coloured lines) with cross sections equal to the observed upper limits at 95% CL.
row resonances, with the kinematic requirements|∆η| <1.1 for the dijet system and|η| < 2.5
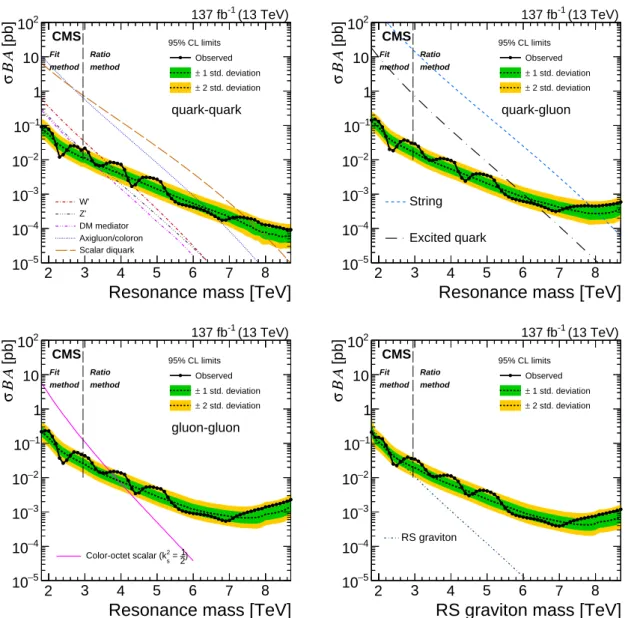
for each jet. The narrow resonance shapes are the ones presented and discussed in detail in a previous publication [17]. The acceptance of the minimum dijet mass requirement in each search, which fully accounts for the overall experimental acceptance, has been evaluated sepa-rately for qq, qg, and gg resonances. We include these acceptances in the determination of the limits. Figure 6 also shows the expected limits on σBA and their bands of uncertainty. Figure 7 shows the different limits for qq, qg, and gg resonances, which originate from differences in their line shapes. For the RS graviton, which decays to both qq and gg, we obtain cross section upper limits from the average, weighted by branching fraction, of the limits on quark-quark and gluon-gluon resonances.
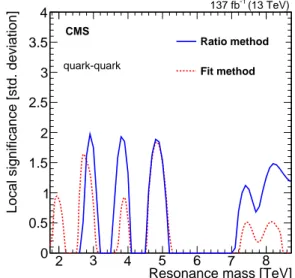
Using the statistical methodology discussed earlier, the local significance for qq, qg, and gg resonance signals was measured from 1.8 to 8.7 TeV in steps of 100 GeV. The significance values obtained for qq resonances are shown in Fig. 8 for both the ratio and the fit methods, and the significances for q g and g g resonances are the same within 0.2 standard deviations. The ratio method usually gives a larger signal significance than the fit method, because it provides a more accurate data-driven background estimate.
All upper limits presented can be compared to the parton-level predictions of σ B A, without detector simulation, to determine mass limits on new particles. The model predictions shown in Fig. 6 are calculated in the narrow-width approximation [33] using the CTEQ6L1 [62] parton distribution function at LO. An NLO correction factor of K = 1+8παS/9 ≈ 1.3 is applied to the LO predictions for the W0model and K=1+ (4αS/6π)(1+4π2/3) ≈1.2 for the Z0and the DM mediator models [63], where αS is the strong coupling constant evaluated at a scale equal to the resonance mass. Similarly, for the axigluon and coloron models a correction factor is applied which varies between K=1.1 at a resonance mass of 0.6 TeV and K=1.3 at 8.1 TeV [7]. The branching fraction includes the direct decays of the resonance into the five light quarks and gluons only, excluding top quarks from the decay, although top quarks are included in the calculation of the resonance width. The acceptance is evaluated at the parton level for the resonance decay to two partons. In the case of isotropic decays, the acceptance is A ≈ 0.5 and is independent of the resonance mass. For a given model, new particles are excluded at 95% CL in mass regions where the theoretical prediction lies at or above the observed upper limit for the appropriate final state of Fig. 6. Table 1 shows the mass limits on all benchmark models which are extended by 200 to 800 GeV relative to those reported in previous CMS dijet resonance searches [17].
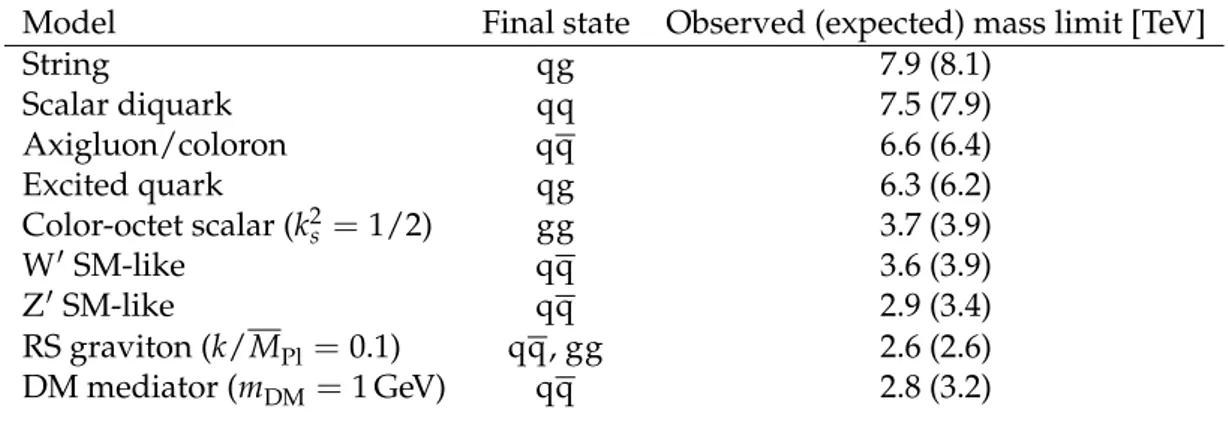
Table 1: Observed and expected mass limits at 95% CL from this analysis. The listed models are excluded between 1.8 TeV and the indicated mass limit by this analysis. The SM-like Z0 resonance is also excluded within the mass interval between 3.1 and 3.3 TeV.
Model Final state Observed (expected) mass limit [TeV]
String qg 7.9 (8.1) Scalar diquark qq 7.5 (7.9) Axigluon/coloron qq 6.6 (6.4) Excited quark qg 6.3 (6.2) Color-octet scalar (k2 s =1/2) gg 3.7 (3.9) W0 SM-like qq 3.6 (3.9) Z0SM-like qq 2.9 (3.4) RS graviton (k/MPl =0.1) qq, gg 2.6 (2.6) DM mediator (mDM=1 GeV) qq 2.8 (3.2)
Resonance mass [TeV] [pb] Α Β σ 5 − 10 4 − 10 3 − 10 2 − 10 1 − 10 1 10 2 10 (13 TeV) -1 137 fb quark-quark 95% CL limits Observed 1 std. deviation ± 2 std. deviation ± W' Z' DM mediator Axigluon/coloron Scalar diquark Fit method Ratio method CMS 2 3 4 5 6 7 8
Resonance mass [TeV]
[pb] Α Β σ 5 − 10 4 − 10 3 − 10 2 − 10 1 − 10 1 10 2 10 (13 TeV) -1 137 fb quark-gluon 95% CL limits Observed 1 std. deviation ± 2 std. deviation ± String Excited quark Fit method Ratio method CMS 2 3 4 5 6 7 8
Resonance mass [TeV]
[pb] Α Β σ 5 − 10 4 − 10 3 − 10 2 − 10 1 − 10 1 10 2 10 (13 TeV) -1 137 fb gluon-gluon 95% CL limits Observed 1 std. deviation ± 2 std. deviation ± ) 2 1 = 2 s Color-octet scalar (k Fit method Ratio method CMS 2 3 4 5 6 7 8
RS graviton mass [TeV]
[pb] Α Β σ 5 − 10 4 − 10 3 − 10 2 − 10 1 − 10 1 10 2 10 (13 TeV) -1 137 fb 95% CL limits Observed 1 std. deviation ± 2 std. deviation ± RS graviton Fit method Ratio method CMS 2 3 4 5 6 7 8
Figure 6: The observed 95% CL upper limits on the product of the cross section, branching fraction, and acceptance for dijet resonances decaying to quark-quark (upper left), quark-gluon (upper right), gluon-gluon (lower left), and for RS gravitons (lower right). The corresponding expected limits (dashed lines) and their variations at the one and two standard deviation levels (shaded bands) are also shown. Limits are compared to predicted cross sections for string resonances [1, 2], excited quarks [4, 5], axigluons [6], colorons [8], scalar diquarks [3], color-octet scalars [9], new gauge bosons W0and Z0with SM-like couplings [10], DM mediators for mDM=
1 GeV [14, 15], and RS gravitons [11]. The vertical dashed line indicates the boundary between the regions where the fit method and the ratio method are used to estimate the background.
Resonance mass [TeV]
[pb]
Α
Β
σ
5
−
10
4
−
10
3
−
10
2
−
10
1
−
10
1
10
2
10
3
10
(13 TeV)
-1
137 fb
95% CL limits
gluon-gluon
quark-gluon
quark-quark
String Excited quark Axigluon/coloron Scalar diquark ) 2 1 = 2 s Color-octet scalar (kW'
Z'
DM mediator
RS graviton
Fit method Ratio methodCMS
2
3
4
5
6
7
8
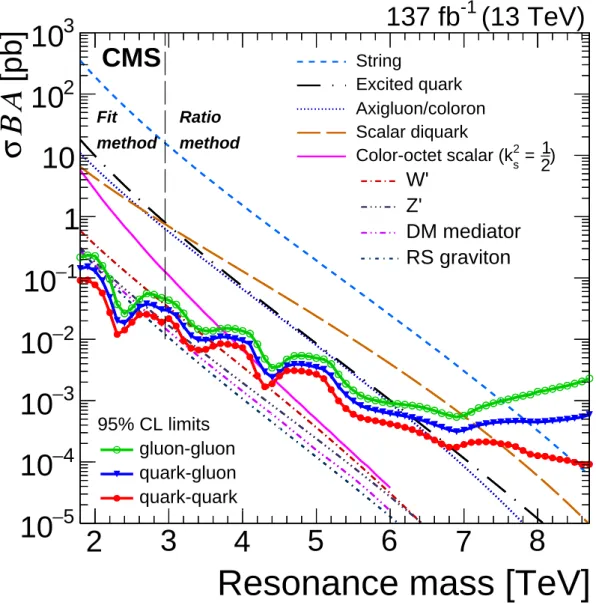
Figure 7: The observed 95% CL upper limits on the product of the cross section, branching fraction, and acceptance for quark-quark, quark-gluon, and gluon-gluon type dijet resonances. Limits are compared to predicted cross sections for string resonances [1, 2], excited quarks [4, 5], axigluons [6], colorons [8], scalar diquarks [3], color-octet scalars [9], new gauge bosons W0and Z0with SM-like couplings [10], DM mediators for mDM=1 GeV [14, 15], and RS gravitons [11]. The vertical dashed line indicates the boundary between the regions where the fit method and the ratio method are used to estimate the background.
Resonance mass [TeV]
Local significance [std. deviation]
0 0.5 1 1.5 2 2.5
3 quark-quark Fit method
2 3 4 5 6 7 8
Figure 8: Local significance for a qq resonance with the ratio method (blue line) and the fit method (red dashed line).
6.2 Broad resonances
We extend the search to cover broad resonances. We use spin-1 resonances decaying to quark-quark pairs with a width up to 55% of the resonance mass, M, as well as spin-2 resonances that decay to quark or gluon pairs with a width up to 30% of the resonance mass. This allows us to be sensitive to more models and larger couplings. The spin-1 resonance results are also used to produce limits on the universal quark coupling of a leptophobic vector mediator of interactions between quarks and DM particles, and limits for a leptophobic Z0 that couples to quarks but does not couple to DM particles [12–15]. In order to be sensitive to the largest possible coupling values for these particles, the maximum value of examined widths for spin-1 resonances is increased to 55% of the resonance mass. The additional wider signals are produced in the same way as the narrower ones, using the MADGRAPH5 aMC@NLOv. 2.3.2 [64] generator at LO, and thePYTHIA8.205 [44] program, followed by a GEANT4-based [48] simulation of the CMS
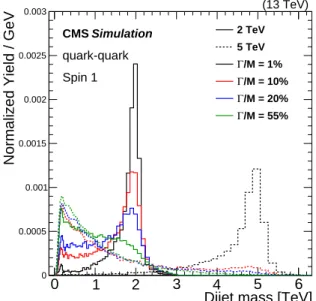
detector. For resonance widths up to 30% of their mass, the dijet mass distributions are the ones presented and discussed in detail in Ref. [17]. The dijet mass distributions of both wide and narrow spin-1 resonances are shown in Fig. 9, and exhibit the same behavior as the ones discussed in [17].
The cross section limits in this case are presented as a function of resonance mass and width. In Fig. 10 we show the observed 95% CL upper limits for various resonance widths, for spin-2 resonances modeled by an RS graviton signal in the quark-quark and gluon-gluon channels, and for spin-1 resonances in the quark-quark channel. The limits weaken as the resonance intrinsic width increases, following the characteristics of the resonance shapes. The spin-1 resonances are significantly broader than the spin-2 resonances. For this reason, their limits are weaker than those of the spin-2 resonances. In Fig. 10 the cross section limits at very high mass for spin-1 resonances with Γ/M = 5% increase as the resonance mass increases, while they decrease forΓ/M =1%. This is because, for resonances with widths larger than 1%, the tail to low dijet mass increases significantly as the resonance mass increases, as shown in Fig. 9. The limits are presented up to a maximum resonance mass of 8.7 TeV for most models. We do not present limits for the case of spin-1 resonances in the quark-quark channel with masses larger than 6 TeV andΓ/M>0.1. These resonances are not part of the search because they have an exceedingly broad and high tail at low dijet mass, as described in Ref. [17], which dominates
Dijet mass [TeV]
Normalized Yield / GeV
0 0.0005 0.001 0.0015 0.002 0.0025 0.003 0 1 2 3 4 5 6 2 TeV 5 TeV /M = 1% Γ /M = 10% Γ /M = 20% Γ /M = 55% Γ (13 TeV) Simulation CMS quark-quark Spin 1
Figure 9: The reconstructed dijet mass spectra for a vector particle decaying to pairs of quarks are shown for a resonance mass of 2 TeV (solid histogram) and 5 TeV (dashed histogram) for various values of intrinsic width, estimated from the MADGRAPH5 andPYTHIAevent
genera-tors followed by the simulation of the CMS detector response.
the limit and produces unstable search results. The spin-1 cross section limits in Fig. 10 have been used to derive constraints on the coupling to quarks of mediators of new interactions. We consider two models of a leptophobic mediator which couples to all generations of quarks with the same universal strength. The quark coupling is denoted gq0 in the first model, in which the mediator does not couple to DM particles, and denoted gq in the second model, in which the mediator couples to DM particles. For each mediator mass value, the predictions for the cross section of mediator production as a function of the quark coupling are converted to predictions as a function of width. They are then compared to the spin-1 cross section limits from Fig. 10 to find the excluded values of quark coupling, as a function of mass for a spin-1 resonance. Figure 11 (right) shows upper limits on the coupling gq0 as a function of mass for our first model, also known as a leptophobic Z0 resonance [65] that couples only to quarks. In this model the resonance has a width
ΓMed =
3(g0q)2MMed
2π , (5)
where MMed is the resonance mass and g0qis the universal quark coupling, related to the cou-pling, gB, of Ref. [65] by g0q = gB/6. Figure 11 (left) shows upper limits on the coupling gqas a function of mass for our second model, also known as a DM Mediator model, which has a lep-tophobic spin-1 mediator that couples both to quarks and DM particles [15], and for Dirac DM with a mass mDM=1 GeV and a coupling gDM=1.0. The cross section of mediator production for mDM = 1 GeV and gDM = 1 is calculated with MADGRAPH5 aMC@NLO[64] for mediator
masses within the range 1.6< MMed<5.1 TeV in 0.1 TeV steps and for quark couplings within the range 0.1< gq <1.0 in 0.1 steps. For these choices, the relationship between the total medi-ator width, for decays to both quark and DM particles, and gq given in Refs. [14, 15] simplifies to
ΓMed≈
(18gq2+1)MMed
12π . (6)
Resonance mass [TeV] Α Β σ 5 − 10 4 − 10 3 − 10 2 − 10 1 − 10 1 10 10 2 3 4 5 6 7 8 /M = 25% Γ /M = 20% Γ /M = 15% Γ /M = 10% Γ /M = 5% Γ /M = 1% Γ quark-quark Spin 2 Fit method Ratio method
Resonance mass [TeV]
Α Β σ 5 − 10 4 − 10 3 − 10 2 − 10 1 − 10 1 10 10 2 3 4 5 6 7 8 /M = 25% Γ /M = 20% Γ /M = 15% Γ /M = 10% Γ /M = 5% Γ /M = 1% Γ gluon-gluon Spin 2 Fit method Ratio method
Resonance mass [TeV]
[pb] Α Β σ 5 − 10 4 − 10 3 − 10 2 − 10 1 − 10 1 10 2 10 3 10 (13 TeV) -1 137 fb CMS 2 3 4 5 6 7 8 /M = 55% Γ /M = 40% Γ /M = 30% Γ /M = 20% Γ /M = 15% Γ /M = 10% Γ /M = 5% Γ /M = 1% Γ quark-quark Spin 1 Observed 95% CL Fit method Ratio method
Figure 10: The observed 95% CL upper limits on the product of the cross section, branching fraction, and acceptance for spin-2 resonances produced and decaying in the quark-quark (up-per left) and gluon-gluon (up(up-per right) channels, as well as for spin-1 resonances decaying in the quark-quark channel (lower), shown for various values of intrinsic width as a function of resonance mass. The vertical dashed line indicates the boundary between the regions where the fit method and the ratio method are used to estimate the background.
extends previous limits on DM mediators at large values ofΓ/M. For example, for Γ/M=0.45, this search excludes DM mediators with mass less than 4.8 TeV, while the observed limit from the earlier searches was 4.0 TeV [17].
7
Summary
A search for resonances decaying into a pair of jets has been performed using proton-proton collision data at√s = 13 TeV corresponding to an integrated luminosity of 137 fb−1. The dijet mass spectra are observed to be smoothly falling distributions of events with typically two-jet topology, although one unusual event with a four-jet topology was found at high mass. The
[TeV] Med M q g 0 0.2 0.4 0.6 0.8 1 Observed Expected 1 std. deviation ± 2 std. deviation ± 2 3 4 5 Med /M Γ 0.1 0.2 0.3 0.4 0.5 95% CL Upper Limits = 1 DM = 1 GeV, g DM m CMS CMS (13 TeV) -1 137 fb [TeV] Med M ' q g 0 0.2 0.4 0.6 0.8 1 Observed Expected 1 std. deviation ± 2 std. deviation ± 2 3 4 5 Med /M Γ 0 0.1 0.2 0.3 0.4 0.5 95% CL Upper Limits CMS CMS (13 TeV) -1 137 fb / 2 Med > M DM m = 0 DM m
Figure 11: The 95% CL upper limits on the universal quark coupling gq as a function of reso-nance mass for a vector mediator of interactions between quarks and DM particles (left), and between quarks only (right). The dashed horizontal lines on the right plot show the coupling strength for which the cross section for dijet production in this leptophobic Z0 model is the same as for a DM mediator for gq =0.25. The right vertical axis shows the natural width of the mediator divided by its mass. The expected limits (dashed lines) and their variation at the one and two standard deviation levels (shaded bands) are also shown.
background is predicted using two methods. The fit method uses an empirical functional form to fit the background in the signal region, defined by requiring the pseudorapidity separation of two jets in dijet|∆η| <1.1, while the ratio method uses two control regions at higher values of|∆η|to predict the background in the signal region. The ratio method is a new background prediction method, which is independent of and complementary to the fit method. No ev-idence for resonant particle production is observed. Generic upper limits are presented on the product of the cross section, the branching fraction, and the acceptance for narrow and broad quark-quark, quark-gluon, and gluon-gluon resonances. The limits are applied to var-ious models of new resonances and yield the following 95% confidence level lower limits on the resonance masses: 7.9 TeV for string resonances, 7.5 TeV for scalar diquarks, 6.6 TeV for ax-igluons and colorons, 6.3 TeV for excited quarks, 3.7 TeV for color-octet scalars, 3.6 TeV for W0 bosons with SM-like couplings, 2.9 TeV and between 3.1 and 3.3 TeV for Z0bosons with SM-like couplings, 2.6 TeV for Randall–Sundrum gravitons, and 2.8 TeV for dark matter (DM) media-tors. With this search, limits on narrow resonances are improved by 200 to 800 GeV relative to those reported in previous CMS dijet resonance searches. Limits are also presented for spin-2 resonances with intrinsic widths as large as 30% of the resonance mass, and spin-1 resonances with intrinsic widths as large as 55% of the resonance mass. These limits are used to improve and extend the exclusions of a DM mediator to larger values of the resonance mass and cou-pling to quarks. In the search for broad resonances, the ratio method provides significantly enhanced sensitivity compared to the fit method, resulting in the exclusion at 95% confidence level of a DM mediator with mass less than 4.8 TeV for a width equal to 45% of the mass, which corresponds to a coupling to quarks gq =0.9.
Acknowledgments
We congratulate our colleagues in the CERN accelerator departments for the excellent perfor-mance of the LHC and thank the technical and administrative staffs at CERN and at other CMS
for delivering so effectively the computing infrastructure essential to our analyses. Finally, we acknowledge the enduring support for the construction and operation of the LHC and the CMS detector provided by the following funding agencies: BMBWF and FWF (Austria); FNRS and FWO (Belgium); CNPq, CAPES, FAPERJ, FAPERGS, and FAPESP (Brazil); MES (Bulgaria); CERN; CAS, MoST, and NSFC (China); COLCIENCIAS (Colombia); MSES and CSF (Croatia); RPF (Cyprus); SENESCYT (Ecuador); MoER, ERC IUT, PUT and ERDF (Estonia); Academy of Finland, MEC, and HIP (Finland); CEA and CNRS/IN2P3 (France); BMBF, DFG, and HGF (Germany); GSRT (Greece); NKFIA (Hungary); DAE and DST (India); IPM (Iran); SFI (Ireland); INFN (Italy); MSIP and NRF (Republic of Korea); MES (Latvia); LAS (Lithuania); MOE and UM (Malaysia); BUAP, CINVESTAV, CONACYT, LNS, SEP, and UASLP-FAI (Mexico); MOS (Mon-tenegro); MBIE (New Zealand); PAEC (Pakistan); MSHE and NSC (Poland); FCT (Portugal); JINR (Dubna); MON, RosAtom, RAS, RFBR, and NRC KI (Russia); MESTD (Serbia); SEIDI, CPAN, PCTI, and FEDER (Spain); MOSTR (Sri Lanka); Swiss Funding Agencies (Switzerland); MST (Taipei); ThEPCenter, IPST, STAR, and NSTDA (Thailand); TUBITAK and TAEK (Turkey); NASU (Ukraine); STFC (United Kingdom); DOE and NSF (USA).
Individuals have received support from the Marie-Curie program and the European Research Council and Horizon 2020 Grant, contract Nos. 675440, 752730, and 765710 (European Union); the Leventis Foundation; the A.P. Sloan Foundation; the Alexander von Humboldt Foundation; the Belgian Federal Science Policy Office; the Fonds pour la Formation `a la Recherche dans l’Industrie et dans l’Agriculture (FRIA-Belgium); the Agentschap voor Innovatie door Weten-schap en Technologie (IWT-Belgium); the F.R.S.-FNRS and FWO (Belgium) under the “Excel-lence of Science – EOS” – be.h project n. 30820817; the Beijing Municipal Science & Technology Commission, No. Z181100004218003; the Ministry of Education, Youth and Sports (MEYS) of the Czech Republic; the Lend ¨ulet (“Momentum”) Program and the J´anos Bolyai Research Scholarship of the Hungarian Academy of Sciences, the New National Excellence Program
´
UNKP, the NKFIA research grants 123842, 123959, 124845, 124850, 125105, 128713, 128786, and 129058 (Hungary); the Council of Science and Industrial Research, India; the HOMING PLUS program of the Foundation for Polish Science, cofinanced from European Union, Re-gional Development Fund, the Mobility Plus program of the Ministry of Science and Higher Education, the National Science Center (Poland), contracts Harmonia 2014/14/M/ST2/00428, Opus 2014/13/B/ST2/02543, 2014/15/B/ST2/03998, and 2015/19/B/ST2/02861, Sonata-bis 2012/07/E/ST2/01406; the National Priorities Research Program by Qatar National Research Fund; the Ministry of Science and Education, grant no. 3.2989.2017 (Russia); the Programa Es-tatal de Fomento de la Investigaci ´on Cient´ıfica y T´ecnica de Excelencia Mar´ıa de Maeztu, grant MDM-2015-0509 and the Programa Severo Ochoa del Principado de Asturias; the Thalis and Aristeia programs cofinanced by EU-ESF and the Greek NSRF; the Rachadapisek Sompot Fund for Postdoctoral Fellowship, Chulalongkorn University and the Chulalongkorn Academic into Its 2nd Century Project Advancement Project (Thailand); the Nvidia Corporation; the Welch Foundation, contract C-1845; and the Weston Havens Foundation (USA).
References
[1] L. A. Anchordoqui et al., “Dijet signals for low mass strings at the LHC”, Phys. Rev. Lett.
101(2008) 241803, doi:10.1103/PhysRevLett.101.241803, arXiv:0808.0497. [2] S. Cullen, M. Perelstein, and M. E. Peskin, “TeV strings and collider probes of large extra
arXiv:hep-ph/0001166.
[3] J. L. Hewett and T. G. Rizzo, “Low-energy phenomenology of superstring-inspired E(6) models”, Phys. Rept. 183 (1989) 193, doi:10.1016/0370-1573(89)90071-9. [4] U. Baur, I. Hinchliffe, and D. Zeppenfeld, “Excited quark production at hadron
colliders”, Int. J. Mod. Phys. A 02 (1987) 1285, doi:10.1142/S0217751X87000661. [5] U. Baur, M. Spira, and P. M. Zerwas, “Excited quark and lepton production at hadron
colliders”, Phys. Rev. D 42 (1990) 815, doi:10.1103/PhysRevD.42.815.
[6] P. H. Frampton and S. L. Glashow, “Chiral color: An alternative to the standard model”, Phys. Lett. B 190 (1987) 157, doi:10.1016/0370-2693(87)90859-8.
[7] R. S. Chivukula, E. H. Simmons, A. Farzinnia, and J. Ren, “Hadron collider production of massive color-octet vector bosons at next-to-leading order”, Phys. Rev. D 87 (2013) 094011, doi:10.1103/PhysRevD.87.094011, arXiv:1303.1120.
[8] E. H. Simmons, “Coloron phenomenology”, Phys. Rev. D 55 (1997) 1678, doi:10.1103/PhysRevD.55.1678, arXiv:hep-ph/9608269.
[9] T. Han, I. Lewis, and Z. Liu, “Colored resonant signals at the LHC: largest rate and simplest topology”, JHEP 12 (2010) 085, doi:10.1007/JHEP12(2010)085, arXiv:1010.4309.
[10] E. Eichten, I. Hinchliffe, K. D. Lane, and C. Quigg, “Supercollider physics”, Rev. Mod. Phys. 56 (1984) 579, doi:10.1103/RevModPhys.56.579.
[11] L. Randall and R. Sundrum, “An alternative to compactification”, Phys. Rev. Lett. 83 (1999) 4690, doi:10.1103/PhysRevLett.83.4690, arXiv:hep-th/9906064. [12] M. Chala et al., “Constraining dark sectors with monojets and dijets”, JHEP 07 (2015)
089, doi:10.1007/JHEP07(2015)089, arXiv:1503.05916.
[13] D. Abercrombie et al., “Dark matter benchmark models for early LHC run-2 searches: Report of the ATLAS/CMS dark matter forum”, Phys. Dark Univ. 26 (2019) 100371, doi:10.1016/j.dark.2019.100371, arXiv:1507.00966.
[14] J. Abdallah et al., “Simplified models for dark matter searches at the LHC”, Phys. Dark Univ. 9-10 (2015) 8, doi:10.1016/j.dark.2015.08.001, arXiv:1506.03116. [15] G. Busoni et al., “Recommendations on presenting LHC searches for missing transverse
energy signals using simplified s-channel models of dark matter”, (2016). arXiv:1603.04156.
[16] ATLAS Collaboration, “Search for new resonances in mass distributions of jet pairs using 139 fb−1of pp collisions at√s=13 TeV with the ATLAS detector”, (2019).
arXiv:1910.08447. Submitted to JHEP.
[17] CMS Collaboration, “Search for narrow and broad dijet resonances in proton-proton collisions at√s=13 TeV and constraints on dark matter mediators and other new particles”, JHEP 08 (2018) 130, doi:10.1007/JHEP08(2018)130,
052004, doi:10.1103/PhysRevD.96.052004, arXiv:1703.09127.
[19] CMS Collaboration, “Search for dijet resonances in proton-proton collisions at√s = 13 TeV and constraints on dark matter and other models”, Phys. Lett. B 769 (2017) 520, doi:10.1016/j.physletb.2017.02.012, arXiv:1611.03568.
[20] CMS Collaboration, “Search for narrow resonances decaying to dijets in proton-proton collisions at√s=13 TeV”, Phys. Rev. Lett. 116 (2016) 071801,
doi:10.1103/PhysRevLett.116.071801, arXiv:1512.01224.
[21] ATLAS Collaboration, “Search for new phenomena in dijet mass and angular
distributions from pp collisions at√s=13 TeV with the ATLAS detector”, Phys. Lett. B
754(2016) 302, doi:10.1016/j.physletb.2016.01.032, arXiv:1512.01530. [22] CMS Collaboration, “Search for narrow resonances in dijet final states at√s=8 TeV with
the novel CMS technique of data scouting”, Phys. Rev. Lett. 117 (2016) 031802, doi:10.1103/PhysRevLett.117.031802, arXiv:1604.08907.
[23] CMS Collaboration, “Search for resonances and quantum black holes using dijet mass spectra in proton-proton collisions at√s=8 TeV”, Phys. Rev. D 91 (2015) 052009, doi:10.1103/PhysRevD.91.052009, arXiv:1501.04198.
[24] ATLAS Collaboration, “Search for new phenomena in the dijet mass distribution using pp collision data at√s=8 TeV with the ATLAS detector”, Phys. Rev. D 91 (2015) 052007, doi:10.1103/PhysRevD.91.052007, arXiv:1407.1376.
[25] CMS Collaboration, “Search for narrow resonances using the dijet mass spectrum in pp collisions at√s = 8 TeV”, Phys. Rev. D 87 (2013) 114015,
doi:10.1103/PhysRevD.87.114015, arXiv:1302.4794.
[26] CMS Collaboration, “Search for narrow resonances and quantum black holes in inclusive and b-tagged dijet mass spectra from pp collisions at√s=7 TeV”, JHEP 01 (2013) 013, doi:10.1007/JHEP01(2013)013, arXiv:1210.2387.
[27] ATLAS Collaboration, “Search for new physics in the dijet mass distribution using 1 fb−1 of pp collision data at√s = 7 TeV collected by the ATLAS detector”, Phys. Lett. B 708 (2012) 37, doi:10.1016/j.physletb.2012.01.035, arXiv:1108.6311.
[28] ATLAS Collaboration, “ATLAS search for new phenomena in dijet mass and angular distributions using pp collisions at√s =7 TeV”, JHEP 01 (2013) 029,
doi:10.1007/JHEP01(2013)029, arXiv:1210.1718.
[29] CMS Collaboration, “Search for resonances in the dijet mass spectrum from 7 TeV pp collisions at CMS”, Phys. Lett. B 704 (2011) 123,
doi:10.1016/j.physletb.2011.09.015, arXiv:1107.4771.
[30] ATLAS Collaboration, “Search for new physics in dijet mass and angular distributions in pp collisions at√s=7 TeV measured with the ATLAS detector”, New J. Phys. 13 (2011) 053044, doi:10.1088/1367-2630/13/5/053044, arXiv:1103.3864.
[31] CMS Collaboration, “Search for dijet resonances in 7 TeV pp collisions at CMS”, Phys. Rev. Lett. 105 (2010) 211801, doi:10.1103/PhysRevLett.105.211801,
[32] ATLAS Collaboration, “Search for new particles in two-jet final states in 7 TeV proton-proton collisions with the ATLAS detector at the LHC”, Phys. Rev. Lett. 105 (2010) 161801, doi:10.1103/PhysRevLett.105.161801, arXiv:1008.2461. [33] R. M. Harris and K. Kousouris, “Searches for dijet resonances at hadron colliders”, Int. J.
Mod. Phys. A 26 (2011) 5005, doi:10.1142/S0217751X11054905, arXiv:1110.5302.
[34] R. S. Chivukula, E. H. Simmons, and N. Vignaroli, “Distinguishing dijet resonances at the LHC”, Phys. Rev. D 91 (2015) 055019, doi:10.1103/PhysRevD.91.055019,
arXiv:1412.3094.
[35] CMS Collaboration, “The CMS experiment at the CERN LHC”, JINST 3 (2008) S08004, doi:10.1088/1748-0221/3/08/S08004.
[36] CMS Collaboration, “Particle-flow reconstruction and global event description with the CMS detector”, JINST 12 (2017) P10003, doi:10.1088/1748-0221/12/10/P10003, arXiv:1706.04965.
[37] M. Cacciari and G. P. Salam, “Dispelling the N3myth for the ktjet-finder”, Phys. Lett. B
641(2006) 57, doi:10.1016/j.physletb.2006.08.037, arXiv:hep-ph/0512210. [38] M. Cacciari, G. P. Salam, and G. Soyez, “The anti-kTjet clustering algorithm”, JHEP 04
(2008) 063, doi:10.1088/1126-6708/2008/04/063, arXiv:0802.1189.
[39] M. Cacciari, G. P. Salam, and G. Soyez, “FastJet user manual”, Eur. Phys. J. C 72 (2012) 1896, doi:10.1140/epjc/s10052-012-1896-2, arXiv:1111.6097.
[40] M. Cacciari and G. P. Salam, “Pileup subtraction using jet areas”, Phys. Lett. B 659 (2008) 119, doi:10.1016/j.physletb.2007.09.077, arXiv:0707.1378.
[41] CMS Collaboration, “Jet energy scale and resolution in the CMS experiment in pp collisions at 8 TeV”, JINST 12 (2017) P02014,
doi:10.1088/1748-0221/12/02/P02014, arXiv:1607.03663. [42] CMS Collaboration, “The CMS trigger system”, JINST 12 (2017) P01020,
doi:10.1088/1748-0221/12/01/P01020, arXiv:1609.02366.
[43] CMS Collaboration, “Jet algorithms performance in 13 TeV data”, CMS Physics Analysis Summary CMS-PAS-JME-16-003, CERN, Geneva, 2017.
[44] T. Sj ¨ostrand et al., “An introduction to PYTHIA 8.2”, Comput. Phys. Commun. 191 (2015) 159, doi:10.1016/j.cpc.2015.01.024, arXiv:1410.3012.
[45] CMS Collaboration, “Event generator tunes obtained from underlying event and multiparton scattering measurements”, Eur. Phys. J. C 76 (2016) 155,
doi:10.1140/epjc/s10052-016-3988-x, arXiv:1512.00815.
[46] P. Skands, S. Carrazza, and J. Rojo, “Tuning PYTHIA 8.1: the Monash 2013 tune”, Eur. Phys. J. C 74 (2014) 3024, doi:10.1140/epjc/s10052-014-3024-y,
arXiv:1404.5630.
[47] NNPDF Collaboration, “Parton distributions with LHC data”, Nucl. Phys. B 867 (2013) 244, doi:10.1016/j.nuclphysb.2012.10.003, arXiv:1207.1303.
[49] B. A. Dobrescu, R. M. Harris, and J. Isaacson, “Ultraheavy resonances at the LHC: beyond the QCD background”, (2018). arXiv:1810.09429.
[50] CDF Collaboration, “Search for new particles decaying into dijets in proton-antiproton collisions at√s=1.96 TeV”, Phys. Rev. D 79 (2009) 112002,
doi:10.1103/PhysRevD.79.112002, arXiv:0812.4036.
[51] P. Nason, “A New method for combining NLO QCD with shower Monte Carlo algorithms”, JHEP 11 (2004) 040, doi:10.1088/1126-6708/2004/11/040, arXiv:hep-ph/0409146.
[52] S. Frixione, P. Nason, and C. Oleari, “Matching NLO QCD computations with parton shower simulations: the POWHEG method”, JHEP 11 (2007) 070,
doi:10.1088/1126-6708/2007/11/070, arXiv:0709.2092.
[53] S. Alioli, P. Nason, C. Oleari, and E. Re, “A general framework for implementing NLO calculations in shower Monte Carlo programs: the POWHEG BOX”, JHEP 06 (2010) 043, doi:10.1007/JHEP06(2010)043, arXiv:1002.2581.
[54] S. Dittmaier, A. Huss, and C. Speckner, “Weak radiative corrections to dijet production at hadron colliders”, JHEP 11 (2012) 095, doi:10.1007/JHEP11(2012)095,
arXiv:1210.0438.
[55] CMS Collaboration, “CMS luminosity measurements for the 2016 data taking period”, CMS Physics Analysis Summary CMS-PAS-LUM-17-001, CERN, Geneva, 2017.
[56] CMS Collaboration, “CMS luminosity measurements for the 2018 data taking period”, CMS Physics Analysis Summary CMS-PAS-LUM-18-002, CERN, Geneva, 2017.
[57] CMS Collaboration, “CMS luminosity measurements for the 2017 data taking period”, CMS Physics Analysis Summary CMS-PAS-LUM-17-004, CERN, Geneva, 2017.
[58] T. Junk, “Confidence level computation for combining searches with small statistics”, Nucl. Instr. Meth. A 434 (1999) 435, doi:10.1016/S0168-9002(99)00498-2, arXiv:hep-ex/9902006.
[59] A. L. Read, “Presentation of search results: the CLstechnique”, J. Phys. G 28 (2002) 2693, doi:10.1088/0954-3899/28/10/313.
[60] LHC Higgs Combination Group, “Procedure for the LHC Higgs boson search combination in Summer 2011”, Technical Report CMS-NOTE-2011-005, ATL-PHYS-PUB-2011-11, CERN, Geneva, 2011.
[61] G. Cowan, K. Cranmer, E. Gross, and O. Vitells, “Asymptotic formulae for likelihood-based tests of new physics”, Eur. Phys. J. C 71 (2011) 1554,
doi:10.1140/epjc/s10052-011-1554-0, arXiv:1007.1727. [Erratum: doi:10.1140/epjc/s10052-013-2501-z].
[62] J. Pumplin et al., “New generation of parton distributions with uncertainties from global QCD analysis”, JHEP 07 (2002) 012, doi:10.1088/1126-6708/2002/07/012, arXiv:hep-ph/0201195.
[63] V. D. Barger and R. J. N. Phillips, “Collider physics, updated edition, frontiers in physics volume 71”. Westview Press, Boulder, Colorado, 1996. ISBN 0-201-14945-1,
[64] J. Alwall et al., “The automated computation of tree-level and next-to-leading order differential cross sections, and their matching to parton shower simulations”, JHEP 07 (2014) 079, doi:10.1007/JHEP07(2014)079, arXiv:1405.0301.
[65] B. A. Dobrescu and F. Yu, “Coupling-mass mapping of dijet peak searches”, Phys. Rev. D
88(2013) 035021, doi:10.1103/PhysRevD.88.035021, arXiv:1306.2629. [Erratum: doi:10.1103/PhysRevD.90.079901].
A.M. Sirunyan†, A. Tumasyan
Institut f ¨ur Hochenergiephysik, Wien, Austria
W. Adam, F. Ambrogi, T. Bergauer, M. Dragicevic, J. Er ¨o, A. Escalante Del Valle, M. Flechl, R. Fr ¨uhwirth1, M. Jeitler1, N. Krammer, I. Kr¨atschmer, D. Liko, T. Madlener, I. Mikulec, N. Rad, J. Schieck1, R. Sch ¨ofbeck, M. Spanring, D. Spitzbart, W. Waltenberger, C.-E. Wulz1, M. Zarucki Institute for Nuclear Problems, Minsk, Belarus
V. Drugakov, V. Mossolov, J. Suarez Gonzalez
Universiteit Antwerpen, Antwerpen, Belgium
M.R. Darwish, E.A. De Wolf, D. Di Croce, X. Janssen, A. Lelek, M. Pieters, H. Rejeb Sfar, H. Van Haevermaet, P. Van Mechelen, S. Van Putte, N. Van Remortel
Vrije Universiteit Brussel, Brussel, Belgium
F. Blekman, E.S. Bols, S.S. Chhibra, J. D’Hondt, J. De Clercq, D. Lontkovskyi, S. Lowette, I. Marchesini, S. Moortgat, Q. Python, K. Skovpen, S. Tavernier, W. Van Doninck, P. Van Mulders
Universit´e Libre de Bruxelles, Bruxelles, Belgium
D. Beghin, B. Bilin, B. Clerbaux, G. De Lentdecker, H. Delannoy, B. Dorney, L. Favart, A. Grebenyuk, A.K. Kalsi, A. Popov, N. Postiau, E. Starling, L. Thomas, C. Vander Velde, P. Vanlaer, D. Vannerom
Ghent University, Ghent, Belgium
T. Cornelis, D. Dobur, I. Khvastunov2, M. Niedziela, C. Roskas, M. Tytgat, W. Verbeke, B. Vermassen, M. Vit
Universit´e Catholique de Louvain, Louvain-la-Neuve, Belgium
O. Bondu, G. Bruno, C. Caputo, P. David, C. Delaere, M. Delcourt, A. Giammanco, V. Lemaitre, J. Prisciandaro, A. Saggio, M. Vidal Marono, P. Vischia, J. Zobec
Centro Brasileiro de Pesquisas Fisicas, Rio de Janeiro, Brazil
F.L. Alves, G.A. Alves, G. Correia Silva, C. Hensel, A. Moraes, P. Rebello Teles
Universidade do Estado do Rio de Janeiro, Rio de Janeiro, Brazil
E. Belchior Batista Das Chagas, W. Carvalho, J. Chinellato3, E. Coelho, E.M. Da Costa,
G.G. Da Silveira4, D. De Jesus Damiao, C. De Oliveira Martins, S. Fonseca De Souza, L.M. Huertas Guativa, H. Malbouisson, J. Martins5, D. Matos Figueiredo, M. Medina Jaime6, M. Melo De Almeida, C. Mora Herrera, L. Mundim, H. Nogima, W.L. Prado Da Silva, L.J. Sanchez Rosas, A. Santoro, A. Sznajder, M. Thiel, E.J. Tonelli Manganote3, F. Tor-res Da Silva De Araujo, A. Vilela Pereira
Universidade Estadual Paulistaa, Universidade Federal do ABCb, S˜ao Paulo, Brazil
C.A. Bernardesa, L. Calligarisa, T.R. Fernandez Perez Tomeia, E.M. Gregoresb, D.S. Lemos,
P.G. Mercadanteb, S.F. Novaesa, SandraS. Padulaa
Institute for Nuclear Research and Nuclear Energy, Bulgarian Academy of Sciences, Sofia, Bulgaria
A. Aleksandrov, G. Antchev, R. Hadjiiska, P. Iaydjiev, M. Misheva, M. Rodozov, M. Shopova, G. Sultanov
University of Sofia, Sofia, Bulgaria
M. Bonchev, A. Dimitrov, T. Ivanov, L. Litov, B. Pavlov, P. Petkov
Beihang University, Beijing, China
W. Fang7, X. Gao7, L. Yuan
Department of Physics, Tsinghua University, Beijing, China
M. Ahmad, Z. Hu, Y. Wang
Institute of High Energy Physics, Beijing, China
G.M. Chen, H.S. Chen, M. Chen, C.H. Jiang, D. Leggat, H. Liao, Z. Liu, A. Spiezia, J. Tao, E. Yazgan, H. Zhang, S. Zhang8, J. Zhao
State Key Laboratory of Nuclear Physics and Technology, Peking University, Beijing, China
A. Agapitos, Y. Ban, G. Chen, A. Levin, J. Li, L. Li, Q. Li, Y. Mao, S.J. Qian, D. Wang, Q. Wang
Zhejiang University, Hangzhou, China
M. Xiao
Universidad de Los Andes, Bogota, Colombia
C. Avila, A. Cabrera, C. Florez, C.F. Gonz´alez Hern´andez, M.A. Segura Delgado
Universidad de Antioquia, Medellin, Colombia
J. Mejia Guisao, J.D. Ruiz Alvarez, C.A. Salazar Gonz´alez, N. Vanegas Arbelaez
University of Split, Faculty of Electrical Engineering, Mechanical Engineering and Naval Architecture, Split, Croatia
D. Giljanovi´c, N. Godinovic, D. Lelas, I. Puljak, T. Sculac
University of Split, Faculty of Science, Split, Croatia
Z. Antunovic, M. Kovac
Institute Rudjer Boskovic, Zagreb, Croatia
V. Brigljevic, D. Ferencek, K. Kadija, B. Mesic, M. Roguljic, A. Starodumov9, T. Susa University of Cyprus, Nicosia, Cyprus
M.W. Ather, A. Attikis, E. Erodotou, A. Ioannou, M. Kolosova, S. Konstantinou, G. Mavro-manolakis, J. Mousa, C. Nicolaou, F. Ptochos, P.A. Razis, H. Rykaczewski, D. Tsiakkouri
Charles University, Prague, Czech Republic
M. Finger10, M. Finger Jr.10, A. Kveton, J. Tomsa Escuela Politecnica Nacional, Quito, Ecuador
E. Ayala
Universidad San Francisco de Quito, Quito, Ecuador
E. Carrera Jarrin
Academy of Scientific Research and Technology of the Arab Republic of Egypt, Egyptian Network of High Energy Physics, Cairo, Egypt
Y. Assran11,12, S. Elgammal12
National Institute of Chemical Physics and Biophysics, Tallinn, Estonia
S. Bhowmik, A. Carvalho Antunes De Oliveira, R.K. Dewanjee, K. Ehataht, M. Kadastik, M. Raidal, C. Veelken
Department of Physics, University of Helsinki, Helsinki, Finland