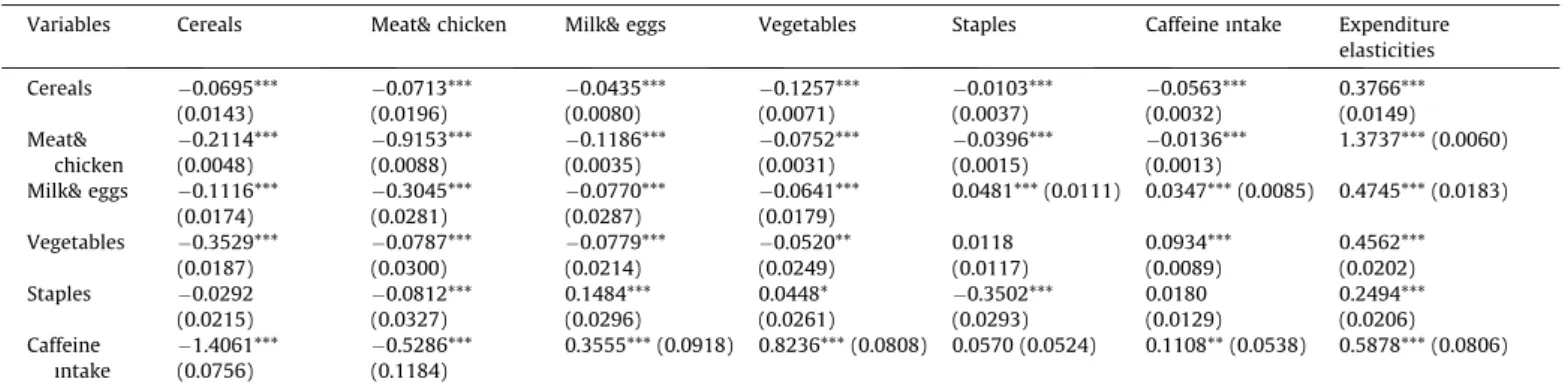
Rural Sudanese household food consumption patterns
Tam metin
Şekil

Benzer Belgeler
Cinsiyete göre değişkenler arası ilişkiler incelendiğinde, her iki grup (kızlar ve erkekler) için de öğrencilerin emoji kullanım durumlarının (EKD), emoji
藥膳調身體 遠離過敏原 發表醫師 王繼榮醫師發佈日期 2010/04/20 【中醫觀點】藥膳調身體 遠離過敏原 2010/ 3/6 | 作者:張雅雯 | 點閱次數: 319 |
Sabahattin Beyin yatan dışın da yaşadığı müddetçe, ona, bir insanin gösterebileceği vefa ve kadirşinaslığın her türlüsünü, en gin bir hürmet ve
1672 tarihine kadar eski harb usulü oian (rampa) devam etmekle beraber rampa dan evvel toplarla düşmana mümkün ol duğu kadar telefat verdirmek, şaşırtmak da
Seçilen 20 adet Floresan pseudomonas izolatının In vitro‟da oluĢturmuĢ olduğu engelleme bölgesinin siderofor etkiye dayanıp dayanmadığını ortaya koymak
Post-partum iki saat sonra bulantı ve kusmayla orta- ya çıkan akut üst karın ağrısı, çabuk değişen hemoliz işaretleri ile beraber kan tablosu değerleri, karaciğer
18:0 düzeyi konrol grubuna göre karşılaştırıldığında; D+B2 grubunda görülen değişikliklerin istatistiksel olarak anlamlı olmadığı (p>0.05), Diyabet, D+B1
Bu arada, eğitim bakanlığına önerilerde bulunmak üzere bazı komite, alt komite ve komisyonlar kurulmalı; bu komite ve komisyonlar da okul binaları, pratik ve
