Contents lists available atScienceDirect
Food Research International
journal homepage:www.elsevier.com/locate/foodresPharmacological and polyphenolic profiles of Phyllanthus phillyreifolius var.
commersonii Müll. Arg: An unexplored endemic species from Mauritius
Mohamad Fawzi Mahomoodally
a, Serife Yerlikaya
b, Eulogio J. Llorent-Martínez
c, Asli Uğurlu
d,
Mehmet Cengiz Baloglu
b,⁎, Yasemin Celik Altunoglu
b, Adriano Mollica
e, Kurty Kersley Dardenne
f,
Muhammad Zakariyyah Aumeeruddy
a, Daneshwar Puchooa
f, Gokhan Zengin
g,⁎aDepartment of Health Sciences, Faculty of Science, University of Mauritius, Réduit 230, Mauritius
bDepartment of Genetics and Bioengineering, Faculty of Engineering and Architecture, Kastamonu University, Kastamonu, Turkey cDepartment of Physical and Analytical Chemistry, University of Jaén, Campus Las Lagunillas S/N, E-23071 Jaén, Spain dDepartment of Biology, Faculty of Science and Arts, Kastamonu University, Kastamonu, Turkey
eDepartment of Pharmacy, University “G. d'Annunzio” Chieti-Pescara, 66100 Chieti, Italy
fDepartment of Agriculture and Food Science, Faculty of Agriculture, University of Mauritius, 230 Réduit, Mauritius gDepartment of Biology, Science Faculty, Selcuk University, Campus, Konya, Turkey
A R T I C L E I N F O Keywords: Phyllanthus phillyreifolius Antibacterial Anticancer Antioxidant Enzyme inhibition Polyphenolic A B S T R A C T
Phyllanthus phillyreifolius var. commersonii Müll. Arg is an endemic plant of Mauritius. To date, no study has been performed concerning its polyphenolic profile and pharmacological properties. In this study, a decoction (water), ethyl acetate and methanol extracts of the aerial parts of P. phillyreifolius, obtained from different extraction procedures (maceration and Soxhlet), were studied for antibacterial, antioxidant, anticancer, and enzyme inhibitory properties along with their polyphenolic profile. The ethyl acetate macerated extract showed high antibacterial activity against B. cereus (MIC = 0.293 mg/mL) and E. coli (MIC = 0.417 mg/mL) while S. epidermidis was most susceptible to the ethyl acetate-Soxhlet extract (MIC = 0.521 mg/mL). The methanol-Soxhlet extract displayed the most potent cupric and ferric reducing power, and metal chelating effect, while the macerated methanolic extract was the most effective DPPH and ABTS scavenger, and BChE inhibitor. Only the ethyl acetate-Soxhlet extract exhibited α-glucosidase inhibition. All extracts exhibited a strong anti-tyrosinase activity, which was further investigated by molecular docking and molecular dynamic. After 48 h exposure to the extracts for HeLa cell lines, the ethyl acetate-Soxhlet extract showed the highest inhibition (IC50= 533.1 μg/mL)
while the decoction extract was more cytotoxic to MDA-MB-231 cells (IC50= 337.4 μg/mL). Treatment of cancer
cell lines with all P. phillyreifolius extracts resulted in a time-dependent reduction of cell viability for HeLa and dose-and time-dependent reduction for MDA-MB-231. Gene expression ratio of Bcl-2 to Bax was higher for all Soxhlet-extracts. Total phenolics (TPC) and flavonoids (TFC) content were highest in the decoction and me-thanol-Soxhlet extract, respectively (122.43 mg GAE/g extract and 31.28 mg RE/g extract, respectively). The extracts were abundant in ellagitannins, although phenolic acids and flavonoids were also detected. Granatin B was detected for the first time in Phyllanthus species. Overall, the aerial parts of P. phillyreifolius exemplify a potent reservoir of bioactive phytochemicals for therapeutic applications.
1. Introduction
The Republic of Mauritius is part of the Mascarene group of islands in the Indian Ocean, formed by volcanic eruptions from the deep sea bed
which created a mountain, the top of which became the Island. Since the arrival of settlers (Dutch in 1638, French in 1715, and British in 1810), many species have been deliberately and accidentally introduced in Mauritius. Mauritius has a unique biodiversity. 691 plant species have
https://doi.org/10.1016/j.foodres.2018.10.075
Received 8 September 2018; Received in revised form 22 October 2018; Accepted 25 October 2018
Abbreviations: TPC, total phenolic content; TIPC, total individual phenolic content; TFC, total flavonoid content; TE, trolox equivalent; RE, rutin equivalent; KAE, kojic acid equivalent; GALAE, galatamine equivalent; GAE, gallic acid equivalent; FRAP, ferric reducing antioxidant power; EDTAE, EDTA equivalent; DPPH, 1,1-diphenyl-2-picrylhydrazyl; CUPRAC, cupric ions reducing antioxidant capacity; CE, catechin equivalent; BChE, butyrylcholinesterase; AChE, acetylcholinesterase; ACAE, acarbose equivalent; ABTS, 2,2′-azino-bis(3-ethylbenzothiazoline)-6-sulfonic acid
⁎Corresponding authors.
E-mail addresses:[email protected](M.C. Baloglu),[email protected](G. Zengin).
Available online 28 October 2018
0963-9969/ © 2018 Elsevier Ltd. All rights reserved.
been documented in Mauritius, of which 273 are endemic to the Island, and 150 are endemic to the Mascarene Archipelago (Mauritius, Rodrigues, and Reunion (Baider et al., 2010)). The local people has a rich history of use of folk remedies, and these practices are still prevalent in primary health care. However, the use of flora has been restricted mainly to exotic plants brought by immigrants from Africa, Madagascar, India, and China. Only a small percentage (ca. 5%) of the endemics are being used tradi-tionally as medicinal plant both in Mauritius and Rodrigues (Gurib-Fakim, Subratty, Narod, Govinden-Soulange, & Mahomoodally, 2005).
The genus Phyllanthus (Family: Phyllanthaceae) consists of 2084 species names, as reported in The Plant List; 936 of these are accepted species names, 1095 synonyms, and 53 unassessed (The Plant List, 2013). Members of the genus could be shrubs, trees, or rare herbs which have a greenish-gray bark and feathery leaves; and they are widely distributed in the tropical/subtropical areas (Wu et al., 2017). The Phyllanthus species are also popular in folk medicine of the three Mas-carene Islands. In Reunion, leaves and stems of P. phillyreifolius Poiret var. phillyreifolius are used as a diuretic and against diarrhea (Poullain, Girard-Valenciennes, & Smadja, 2004). In Rodrigues, Phyllanthus spe-cies, including P. amarus, P. casticum, and P. urinaria, are used tradi-tionally to manage conditions such as diarrhea, dysentery, urino-genital problems, and cough (Gurib-Fakim, Sewraj, Gueho, & Dulloo, 1996). In Mauritius, decoctions of leaves of P. acidus are used against dysentery and hepatitis. Leaves decoctions of P. carticum are used to treat ulcers, dysentery and diarrhea. In addition, decoctions of P. lanceolatus leaves are used to alleviate abdominal disorders and stomach pains, while root decoction of P. niruroides could be useful in the treatment of jaundice, bronchitis, gonorrhea, skin rashes, and as a diuretic. Also, the juice of P. urinaria flowers (with olive oil) is used for earache (Fakim, 1990). Fruits of P. emblica are also eaten raw or its juice is taken orally to manage type 2 diabetes and high levels of cholesterol (Chintamunnee & Mahomoodally, 2012; Mahomoodally, Mootoosamy, & Wambugu, 2016; Mootoosamy & Mahomoodally, 2014). On the other hand, de-coctions of leaves of P. emblica are used for bathing to manage body ache and limb pain (Sreekeesoon & Mahomoodally, 2014).
As a result of the wide uses of plants from the Phyllanthus genus, there has been significant interest in its scientific investigation. Pharmacological and phytochemical investigations of a great variety of Phyllanthus species have revealed the presence of valuable compounds of medicinal interest. Extracts of Phyllanthus species have been docu-mented to present a panoply of therapeutic properties such as anti-oxidant (Kumaran & Karunakaran, 2007; Liu, Zhao, Wang, Yang, & Jiang, 2008), anti-inflammatory (Kiemer, Hartung, Huber, & Vollmar, 2003), antibacterial, antifungal, antiviral (Del Barrio & Parra, 2000; Jagessar, Mars, & Gomes, 2008; Mazumder, Mahato, & Mazumder, 2006), hepatoprotective (Sharma, Arogya, Bhaskarmurthy, Agarwal, & Velusami, 2011), hypolipidemic (Adeneye, Amole, & Adeneye, 2006; Khanna, Rizvi, & Chander, 2002), antitumour and anticarcinogenic (Rajeshkumar et al., 2002), diuretic, hypotensive, hypoglycaemic (Srividya & Periwal, 1995), and analgesic activity (Iranloye, Owoyele, Kelani, & Olaleye, 2011), However, not all species have been scientifi-cally explored regarding their therapeutic properties. For instance, we found no pharmacological and phytochemical studies on the species Phyllanthus phillyreifolius var. commersonii Müll. Arg as far as our lit-erature search could establish. This species is endemic to Mauritius (Pynee, Dubuisson, & Hennequin, 2013). It is to be noted that another variety of this species, Phyllanthus phillyreifolius Poiret var. phillyreifolius, endemic to Reunion Island, exhibited DPPH scavenging, β-carotene bleaching activity (Poullain et al., 2004), and angiotensin-converting enzyme inhibitory property, which is one key enzyme in the regulation of tension as well as diuresis (Adsersen & Adsersen, 1997). Here, we report the pharmacological properties of extracts of Phyllanthus phillyr-eifolius var. commersonii Müll. Arg in terms of antibacterial, antioxidant, anticancer, and enzyme inhibitory properties. The total and individual phytochemicals were profiled using HPLC-MS in order to find the po-tential association with the above mentioned biological effects.
2. Materials and methods
2.1. Location and identification for plant sample
Fresh leaves, branches, and stems of Phyllanthus phillyreifolius var. commersonii were collected at Montvert Nature Walk (20°20′56.0″S 57°31′09.0″E 944 m above sea level, 20°20′49.0″S 57°31′12.0″E 774 m above sea level), situated in Forest-Side at Curepipe. A local botanist at the Mauritius Herbarium at the Mauritius Sugarcane Industry Research Institute authenticated the plant sample and a voucher number was assigned (MAU 0024168).
2.2. Pre-extraction procedures prior to extraction
On the same day of collection, plant samples were separated into different parts: leaves, branches, and stems. All parts were separately and meticulously washed with deionized water for the removal of any unwanted substances, especially epiphytes. Samples were then allowed to dry at room temperature. The dried parts were then combined and homogenised in a clean electrical grinder to obtain fine powders which were stored in a clean air-tight container.
2.3. Extraction 2.3.1. Soxhlet extraction
Powdered plant materials (20 g) were placed in a large Whatmann filter paper grade one, which was folded into a porous bag. The porous bag was then placed in the thimble chamber of the Soxhlet apparatus. Samples were then extracted to exhaustion using 250 mL of solvents for 4 h (ethyl acetate solution) and approximately 10 h when using 70% methanol. The mixture was kept for rotary evaporation.
2.3.2. Maceration extraction
50 g of plant powder were added to 500 mL of extractive solvents (70% methanol and ethyl acetate) in an Erlenmeyer flask covered with aluminium foil and left to macerate for at least 3 days with frequent agitation. After filtration, the filtrate was collected in a clean Erlenmeyer flask for rotary evaporation. The residue was collected back in the Erlenmeyer flask and the solvent recuperated from the rotary evaporator was used for exhaustive maceration of the plant material (residue of filtration).
2.3.3. Decoction
Powdered plant material (25 g) was added to distilled water (350 mL) followed by boiling for 30 min. The decoction was filtered with muslin cloth, the solution was further filtered using a filter paper, and the filtrate was collected for rotary evaporation.
2.3.4. Concentration of the extract
Using a rotary evaporator (Model Ruchi Rotavapor R-114, Switzerland), the extracts were concentrated in vacuo at a temperature of 37 °C for the organic solvents and 45–50 °C for water. The resulting concentrates were weighed, collected, and diluted in the appropriate extractive solvents (70% methanol, ethyl acetate, and distilled water) for the upcoming assays.
2.4. Total bioactive components and HPLC-MS analysis
The Folin-Ciocalteu assay was selected to determine the total amount of phenolic content (TPC). In addition, the spectrophotometric AlCl3 method was performed to detect flavonoids content (TFC).
Standard compounds (GAE: gallic acid equivalent for TPC and RE: Rutin equivalent for TFC) were used to explain these results (Slinkard & Singleton, 1977;Zengin et al., 2016).
We used an Agilent Series 1100 HPLC with a diode array detector (Agilent Technologies). Separations of phytochemicals were performed
with a Luna Omega Polar C18analytical column of 150 × 3.0 mm and
5 μm particle size (Phenomenex). An ion trap mass spectrometer (Esquire 6000, Bruker Daltonics) equipped with an electrospray inter-face was used to perform compounds identification. Detailed HPLC-MS conditions can be found in (Llorent-Martínez et al., 2018). Samples of approximately 5 mg of dried extract (DE) per 1 mL MeOH were ana-lyzed, except for water decoction extracts, which were dissolved in the initial mobile phase.
2.5. Antimicrobial assays
The disc diffusion method was carried out with constant parameters such as level of inoculum, depth of agar in plate, and size of the disc (Gülçin, Küfrevioǧlu, Oktay, & Büyükokuroǧlu, 2004; Gülçın, Oktay, Kıreçcı, & Küfrevıoǧlu, 2003). The minimum inhibitory concentration (MIC) was detected by the method. The assays were performed in tri-plicate.
2.5.1. Microorganisms used
Four bacteria (three Gram-positive and one Gram-negative) were used. Three of the bacteria (Escherichia coli ATCC 25922, Staphylococcus epi-dermidis ATCC 23925, and Staphylococcus aureus ATCC 14990) were ob-tained from the University of Mauritius (Faculty of Science, Department of Health Sciences), while the other bacterium (Bacillus cereus ATCC 10876) was provided from the University of Mauritius (Faculty of Agriculture, Department of Agricultural and Food Sciences). All the organisms were subcultured on Mueller-Hinton agar (Oxoid) plates and grown in sterile Mueller-Hinton broth (Oxoid) at 37 °C, prior to the day of use.
2.5.2. Assay for disc diffusion
The antibacterial susceptibility test (disc diffusion assay) was eval-uated by the following procedure: firstly, by adjusting the bacterial broth cultures to 0.5 McFarland standard with sterile saline suspension (0.9%) to obtain approximately 1.5 × 10⁸cfu/mL. A sterile cotton swab
was dipped in the broth cultures, and a loan streak was performed on the surface of Mueller-Hinton agar (Oxoid) plates. 5 mm diameter sterile paper discs (made from Whatmann filter paper) were aseptically placed on the inoculated plates and were then impregnated with 5 μL of crude plant extract with a fixed concentration (0.2 g/mL). Three discs were placed on each plate to prevent overlapping zones of inhibition (ZOI). Discs impregnated with the extractive solvents (70% methanol, ethyl acetate, sterile distilled water) were used as negative control. The plates were incubated at 37 °C for 24 h, and the ZOI including the diameter (in mm) of the discs were measured.
2.5.3. Minimum inhibitory concentration (MIC)
For the determination of MIC, extracts which showed ZOI were used. The bacterial broth cultures were standardized to 0.5 McFarland standard using a spectrophotometer. 100 μL of crude extract (50 mg/ mL) was double diluted with 100 μL sterile water in a sterile 96-well microtitre plate from the first to last row, discarding 100 μL from the last dilution. 50 μL of broth cultures were added to each well. A two fold-dilution of streptomycin (1 mg/mL) (Sigma-Aldrich) was used as positive control. 70% methanol, ethyl acetate, and sterile distilled water were used as negative controls. Other controls included wells with the inoculum and water and uninoculated wells containing only water. The plates were incubated at 37 °C for 24 h. An INT (2-(4-iodo-phenyl)-3-(4-nitrophenyl)-5-phenyltetrazolium chloride) colorimetric assay was used to determine the MIC value. Following incubation, 40 μL of 0.2 mg/mL INT was added to each well. A pink/red coloration in-dicated growth, therefore, the concentration of an uncolored well just before a colored well was considered as the actual MIC.
2.6. Determination of antioxidant and enzyme inhibitory effects
Antioxidant propensities of extracts were screened by distinct
chemical assays including reductive power (FRAP and CUPRAC), che-lating effect, phosphomolybdenum, and antiradical methods (DPPH and ABTS) (Bursal & Gülçin, 2011; Bursal, Köksal, Gülçin, Bilsel, & Gören, 2013). To define the results, standard compounds (mg TE/g sample and mg EDTAE/g sample) were used. The inhibition effects of extracts were investigated on key enzymes, namely tyrosinase, choli-nesterases, α-amylase, and α-glucosidase. Standard inhibitors were kojic acid (for tyrosinase), galatamine (for AChE and BChE), and acarbose (for α-amylase and α-glucosidase). All methods are given in our earlier paper (Grochowski et al. (2017).
2.7. Anticancer activity
2.7.1. Preparation of plant extracts
Ethyl acetate-soxhlet (EA-sox) and methanol-soxhlet (MeOH-sox) extracts were solubilized in 0.1% DMSO, decoction extract was solu-bilized in PBS. All extracts were then filter sterilized and kept at −20 °C.
2.7.2. Cell culture and Cytotoxicity assay
HeLa (human cervix adenocarcinoma) and MDA-MB-231 (human breast adenocarcinoma) cells were obtained from Boğaziçi University (Department of Molecular Biology and Genetics). HeLa cells were cul-tured in DMEM containing 10% FBS, 1% NEAA and 0.1% penicillin/ streptomycin. MDA-MB-231 cells were cultured in DMEM containing 10% FBS, 0.01 mg/mL human insulin, 1% NEAA and 0.1% penicillin/ streptomycin. All the cells were grown at 37 °C under 5% CO2. In this
study, MTT assay was performed for cytotoxicity analysis as described earlier (Locatelli et al., 2018). Briefly, 104HeLa and MDA-MB-231 cells
were grown and treated with EA-sox, MeOH-sox and decoction extracts (62.5, 125, 250, 500, 1000 μg/ml) for 24 h and 48 h. The medium was removed after treatment and the cells were incubated with 100 μl MTT (0.5 mg/ml) for 4 h at 37 °C. Formazan precipitates were dissolved in 3% (SDS) and 40 mM HCl/isopropanol and absorbance values were read at 570 nm with Multiskan Go (Thermo Scientific, USA). The IC50
values were obtained from log (inhibitor concentration) vs. normalized inhibition graph.
2.7.3. qPCR analysis of apoptotic marker genes
The cells were grown until confluency and then treated with EA-sox, MeOH-sox and decoction extracts at doses of IC50 values for 48 h.
GeneJET RNA Purification Kit (Thermo Scientific, USA) was used for RNA extraction following DNase treatment for 30 min at 37 °C to re-move contaminating trace DNA. cDNA synthesis was done using RevertAid First Strand cDNA synthesis kit with random primers (Thermo Scientific, USA). qPCR reactions were carried out with Rotor Gene-Q (Qiagen, Germany) using 20 μl reaction mixtures containing primers for Bax (5′-CCCGAGAGGTCTTTTTCCGAG-3′ and 5′-CCAGCCC ATGATGGTTCTGAT-3′), Bcl2 (5′-GGTGGGGTCATGTGTGTGG-3′ and 5′-CGGTTCAGGTACTCAGTCATCC-3′), and the reference gene GAPDH ( 5′-GGAAGGTGAAGGTCGGAGTC-3′ and 5′-AACATGTAAACCATGTAGT TGAGGT-3′) in SYBR Green solution (BioRad, USA). Following dena-turation at 95 °C for 5 min, 40 cycles of amplification was performed including denaturation at 95 °C for 10 s, annealing and extension at 57 °C for 30 s. The data were analyzed using the comparative CT method (ΔΔCt).
2.8. Molecular modeling simulations
Computational experiments were conducted to confirm the in-hibitory activity of the most abundant ellagitannins against tyrosinase. This enzyme was selected for the computational study since all the tested extracts showed significant inhibitory activity against it. Docking experiments with the ligands were performed on the tyrosinase crystal structure pdb code2Y9X(Ismaya et al., 2011). The receptor was pro-cessed by using the Maestro 10.2 (Schrödinger Release, 2017b),
protonated at 7.4 pH, and all crystals problems were amended auto-matically. Docking were performed using Gold 6.0 (Jones, Willett, Glen, Leach, & Taylor, 1997), using the scoring function GoldScore (GS), which has been previously validated to conduct docking in the presence of metallo-enzymes as tyrosinase (Llorent-Martínez et al., 2017;Mocan et al., 2017;Mocan, Zengin, Crişan, & Mollica, 2016). The docking grid was designed by Gold, taking in consideration a radius of 10 Å from the crystallographic ligand tropolone. The most interesting substance re-vealed by docking experiment was ellagic acid, and its best ranked docking pose is depicted in Fig. 1(A–C). On the other hand, all sub-stances were able to bind strongly to the tyrosinase cavity, with a preference for ellagic acid, which was the only substance able to bind by coordination bonds, the copper (Cu400 and Cu401) atoms posi-tioned in the enzymatic pocket of the enzyme (Supplemental Table 1). 2.8.1. Ligands preparation
The compounds depicted in Supplemental Fig. 1 have been re-cognized to be the most important bioactive compounds present in all extracts reported in this paper, namely, HHDP-galloyl-glucose,
phyllanthusiin B, granatin B, castalagin derivative, and ellagic acid. These substances were selected to carry out molecular docking and molecular dynamic calculation on tyrosinase. The compounds structures were drawn using ChemDraw 14.0 and converted into 3D structures by Maestro. The stereochemistry was prepared by hand based on literature data and Scifinder Scholar database (Matsuo, Wakamatsu, Omar, & Tanaka, 2014;Somerville, 1998). The ligands were prepared by the Li-gand Preparation module of Maestro, pH was fixed at 7.4 and minimized by OPLS3 force field by Ionizer module (Shelley et al., 2007).
2.8.2. Molecular dynamic
The complex of ellagic acid – tyrosinase was subjected to molecular dynamic with Desmond module embedded in Maestro 2017 (Schrödinger Release, 2017a), in order to prove stability of the pose of ellagic acid docked to tyrosinase, along a time scale of 20 ns (Guo et al., 2010;Mollica et al., 2018).
The molecular dynamic was simulated in a water box. The TIP3P water model was choosen as water molecules, and added (Jorgensen, Chandrasekhar, Madura, Impey, & Klein, 1983) in orthorhombic periodic Fig. 1. (A) Graphical representation of ellagic acid docked in the enzymatic cavity of tyrosinase; (B) RMSD graphic of Cα of tyrosinase (blue) and ellagic acid (Red) over a molecular dynamic simulation of 20 ns; (C) ligand interaction diagram of the complex ellagic acid-tyrosinase (best pose); (D) 2D representation of the interaction between ellagic acid and tyrosinase during the 20 ns molecular dynamic. (For interpretation of the references to colour in this figure legend, the reader is referred to the web version of this article.)
boundary conditions following the default parameters. The total charge of the system was balanced by adding Na+of Cl−ions to neutrality,
placing the ions randomly in the solvated system; a buffer of 0.1 M NaCl was also added. After building the simulation system, a minimization step was performed to obtain the relaxation of the protein/protein-ligand complex under normal pressure and temperature parameter (NPT) before starting the minimization step fixed at maximum 5000 steps of until system convergence with RMSD of 0.1 Angstrom.
Normal pressure (1.013 atm) and normal temperature (310K) con-ditions were used to run the molecular dynamics (MD) under periodic boundary conditions (NPT); the Nose-Hoover temperature coupling and isotropic scaling (Nosé, 1984) was applied and the results minimized by OPLS3 force field (Kaminski, Friesner, Tirado-Rives, & Jorgensen, 2001; Shivakumar et al., 2010). 20 ns of MD were saved, with the generation of one frame every 20 ps.
2.9. Data analysis
Experiments were performed in triplicate, and data were expressed as the mean value ± standard deviation (Mean ± SD). All the results in the present study were analyzed using Minitab 18. Descriptive sta-tistics were used to express results as Mean ± SD. One-way ANOVA (Tukey's test) was used to evaluate statistically any significant differ-ences between the variables. Statistical significance was considered when p < 0.05.
3. Results and Discussion 3.1. Polyphenolic composition
The results of TPC and TFC are shown inTable 1. Different extracts of P. phillyreifolius (decoction, maceration, and Soxhlet, using ethyl acetate and methanol for the two latter assays) were evaluated. As expected, the different solvent extracts prepared by different extraction procedures presented diverse phytochemical contents. The decoction extract possessed the highest values of TPC (122.43 mg GAE/g extract) followed by the methanolic-macerated (118.07 mg GAE/g extract) and methanolic-Soxhlet extract (117.33 mg GAE/g extract), while the re-maining extracts (ethyl acetate macerated and Soxhlet) showed lower TPC values. In contrast, TFC were much lower than TPC, ranging be-tween 16.45 and 31.28 mg RE/g extract. The highest TFC value was observed in the methanolic extract using Soxhlet method (31.28 mg RE/g extract). The decoction and macerated methanolic extracts also showed notable TFC (25.24 and 24.41 mg RE/g extract, respectively) while the least TFC was found in the macerated ethyl acetate extract. 3.2. Chemical composition by HPLC-ESI-MSn
The documentation of secondary metabolites was performed by HPLC-ESI-MSnin negative ion mode. Multistage fragmentation, up to
MS4, was used. The base peak chromatograms of the extracts are shown
in Supplemental Fig. 1. Compounds were numbered according to their retention times. Compounds characterization (Table 2) was carried out using both analytical standards and data from scientific literature. 3.2.1. Phenolic acids
Compound 5, [M-H]−at m/z 169 and base peak at m/z 125, was
identified as gallic acid by comparison with an analytical standard. Compound 4, with additional 162 Da (hexoside) was a galloy-hexoside, whereas compounds 15, 18, 20, 23, 25, 26, 30, 31, and 36 were ten-tatively characterised as gallic acid derivatives due to the MSnfragment
ions at m/z 169 and 125. Compound 11 exhibited the deprotonated molecular ion at m/z 183 and fragment ions at m/z 168 and 124, consistent with methyl-gallate (Barreto et al., 2008).
Compound 6, with [M-H]−at m/z 315, suffered the neutral loss of
162 Da to yield dihydroxybenzoic acid at m/z 153, so it was char-acterised as dihydroxybenzoic acid hexoside (Han et al., 2008).
Compounds 7 and 12 were identified as 5-O-caffeoylquinic acid and 3-O-caffeoylquinic acid, respectively, by comparison with analytical standards.
Compound 8, with [M-H]−at m/z 495, exhibited fragment ions at
m/z 343 and 191, corresponding to two consecutive losses of 152 Da (galloyl moieties). In addition, it presented fragment ions at m/z 191 (quinic acid) and 169 and 125 (gallic acid). Hence, it was identified as digalloylquinic acid (Romani, Campo, & Pinelli, 2012).
Compound 9, with deprotonated molecular ion at m/z 337 and base peak at m/z 163, was identified as 3-p-coumaroylquinic acid (Clifford, Johnston, Knight, & Kuhnert, 2003).
3.2.2. Flavonoids
Quercetin (compound 44) was detected only in methanolic extract. It was recognized by comparison with an analytical standard. Several derivatives were also present in the different extracts, all of them showing quercetin aglycone at m/z 301 (fragment ions at m/z 179 and 151). Compounds 28, 34, and 37 suffered neutral losses of 308, 176, and 146 Da, respectively; hence, they were characterised as quercetin-O-rutinoside, quercetin-O-glucuronide, and quercetin-O-deoxyhexo-side, respectively. Compound 39 displayed [M-H]−at m/z 475; after
the loss of 22 Da, it suffered another loss of 152 Da (453 → 301), probably due to a galloyl moiety. Without further information, 39 was tentatively characterised as a derivative, in a similar way than com-pound 27. Only comcom-pound 34 was detected in all extracts, observing variations for the other derivatives.
3.2.3. Ellagitannins
Several ellagitannins were detected, derived from ellagic acid or hexahydroxydiphenyl (HHDP). Compound 3 corresponded to HHDP-O-glucose. Compounds 10 and 16, with [M-H]−at m/z 633, were
char-acterised as HHDP-galloyl-glucose isomers based on bibliography (Fernandes, Sousa, Mateus, Cabral, & de Freitas, 2011).
Table 1
Total bioactive compounds and antioxidant activity of the P. phillyreifolius extracts.a
Samples Total phenolic
(mg GAE/g extract) Total flavonoid (mg RE/g extract) Phosphomolybdenum
(mmol TE/g sample) DPPH (mmolTE/g sample) ABTS (mmolTE/g sample) CUPRAC(mmol TE/g
sample)
FRAP (mmol
TE/g sample) Metal chelating(mg EDTAE/g
sample) Decoction 122.43 ± 2.35b 25.24 ± 0.44c 4.09 ± 0.05b 1.91 ± 0.13a 4.11 ± 0.02d 4.80 ± 0.07b 3.01 ± 0.12c 22.91 ± 0.39b EA-Maceration 115.82 ± 1.71a 16.45 ± 0.39a 5.04 ± 0.15c 2.73 ± 0.01c 3.21 ± 0.17b 4.78 ± 0.33b 2.31 ± 0.11b 17.89 ± 0.70a EA-Soxhlet 116.99 ± 0.85a 20.40 ± 0.26b 4.29 ± 0.16b 2.49 ± 0.04b 2.65 ± 0.05a 3.75 ± 0.03a 2.02 ± 0.10a 19.02 ± 0.42a MEOH-Maceration 118.07 ± 0.83a 24.41 ± 0.30c 4.21 ± 0.03b 2.91 ± 0.01cd 4.12 ± 0.09d 4.96 ± 0.12b 2.92 ± 0.36c 24.23 ± 0.57c MEOH-Soxhlet 117.33 ± 2.05a 31.28 ± 0.20d 3.72 ± 0.29a 2.85 ± 0.02c 3.68 ± 0.10c 5.04 ± 0.17b 3.17 ± 0.15c 26.30 ± 0.10d
EA: Ethyl acetate; MeOH: Methanol; GAE: Gallic acid equivalent; RE: Rutin equivalent; TE: Trolox equivalent; EDTAE: EDTA equivalent. Different letters in same column indicate a significant difference in the extracts (p < 0.05).
Table 2
Characterization of the compounds found in the analyzed extracts of P. phillyreifolius.
No. tR(min) [M-H]−m/z m/z (% base peak) Assigned identification Water Ethyl acetate MeOH
1 1.7 377 MS2[377]: 341 (100) Disaccharide (HCl adduct) ✓ MS3[377 → 341]: 179 (100), 161 (97), 143 (7), 101 (47) 2 2.1 191 MS2[191]: 173 (42), 111 (100) Citric acid ✓ 3 2.5 481 MS2[481]: 301 (100), 275 (5) HHDP-O-glucose ✓ MS3[481 → 301]: 257 (100), 185 (10) 4 2.5 331 MS2[331]: 271 (100), 241 (24), 169 (85), 125 (23) Galloyl-hexoside ✓ ✓ ✓ MS3[331 → 169]: 125 (100) 5 3.2 169 MS2[169]: 125 (100) Gallic acida ✓ ✓ ✓
6 3.7 315 MS2[315]: 153 (100) Dihydroxybenzoic acid hexoside ✓ ✓ ✓
MS3[315 → 153]: 109 (100) 7 5.2 353 MS2[353]: 191 (100), 179 (52), 135 (16) 5-O-Caffeoylquinic acida ✓ ✓ ✓ 8 7.5 495 MS2[495]: 343 (100), 325 (30), 169 (28) Digalloylquinic acid ✓ MS3[495 → 343]: 325 (14), 191 (6), 173 (16), 169 (100) MS4[495 → 343 → 169]: 125 (100) 9 7.9 337 MS2[337]: 163 (100) 3-p-Coumaroylquinic acid ✓ ✓ MS3[337 → 163]: 119 (100) 10 8.6 633 MS2[633]: 301 (100) HHDP-galloyl-glucose ✓ MS3[633 → 301]: 257 (82), 229 (100) 11 8.6 183 MS2[183]: 168 (100) Methyl-gallate ✓ MS3[183 → 168]: 124 (100) 12 8.9 353 MS2[353]: 191 (100), 179 (30), 173 (58) 3-O-Caffeoylquinic acida ✓ ✓ 13 9.8 291 MS2[291]: 247 (100) Unknown ✓ ✓ ✓ MS3[291 → 247]: 191 (100)
14 10.7 431 MS2[431]: 385 (100) Roseoside (formate adduct) ✓ ✓
MS3[431 → 385]: 223 (65), 205 (47), 161 (26), 153 (100)
15 10.9 453 MS2[453]: 273 (73), 169 (100) Gallic acid derivative ✓
MS3[453 → 169]: 125 (100)
16 11.6 633 MS2[633]: 463 (12), 301 (100), 275 (16) HHDP-galloyl-glucose ✓ ✓ ✓
MS3[633 → 301]: 257 (100), 229 (55), 185 (35)
17 12.2 969 MS2[969]: 633 (100) Phyllanthusiin B ✓ ✓
MS3[969 → 633]: 463 (12), 301 (100), 275 (9)
18 12.7 453 MS2[453]: 431 (46), 169 (100) Gallic acid derivative ✓ ✓
MS3[453 → 169]: 125 (100)
19 13.2 951 MS2[951]: 933 (100), 301 (7) Galloyl-HHDP-DHHDP-hexoside (granatin
B) ✓ ✓
MS3[951 → 933]: 915 (47), 897 (37), 613 (30), 445 (9), 443 (30),
301 (100)
20 15.2 462 MS2[462]: 452 (100), 169 (17) Gallic acid derivative ✓ ✓ ✓
MS3[462 → 452]: 169 (100) MS4[462 → 452 → 169]: 125 (100) 21 15.2 925 MS2[925]: 301 (100) Ellagitannin ✓ ✓ ✓ MS3[925 → 301]: 257 (100), 229 (32) 22 16.1 305 MS2[305]: 273 (100) Unknown ✓ MS3[305 → 273]: 245 (100), 229 (7)
23 16.2 484 MS2[484]: 462 (100), 169 (22) Gallic acid derivative ✓
MS3[484 → 462]: 169 (100)
MS4[484 → 462 → 169]: 125 (100)
24 16.3 433 MS2[433]: 387 (100) Unknown ✓
MS3[433 → 387]: 297 (58), 225 (100), 161 (85)
25 16.9 489 MS2[489]: 343 (66), 337 (26), 325 (74), 169 (100) Gallic acid derivative ✓ ✓
MS3[489 → 169]: 125 (100)
26 17.0 505 MS2[505]: 343 (100), 325 (16), 169 (24) Gallic acid derivative ✓ ✓ ✓
MS3[505 → 343]: 169 (100) MS4[505 → 343 → 169]: 125 (100) 27 17.3 623 MS2[623]: 301 (100) Quercetin derivative ✓ ✓ MS3[623 → 301]: 179 (3), 151 (100) 28 17.8 609 MS2[609]: 301 (100), 271 (15) Quercetin-O-rutinoside ✓ ✓ ✓ MS3[609 → 301]: 271 (65), 255 (100), 151 (18) 29 18.0 965 MS2[965]: 933 (100), 301 (10) Castalagin derivative ✓ MS3[965 → 933]: 915 (31), 897 (29), 613 (14), 463 (40), 301 (100)
30 18.4 469 MS2[469]: 453 (74), 301 (35), 169 (100) Gallic acid derivative ✓
MS3[469 → 169]: 125 (100)
31 18.6 475 MS2[475]: 453 (100), 301 (19), 169 (18) Gallic acid derivative ✓ ✓
MS3[475 → 453]: 431 (36), 301 (96), 169 (100), 125 (2) 32 18.7 965 MS2[965]: 933 (100), 301 (9) Castalagin derivative ✓ ✓ MS3[965 → 933]: 915 (67), 897 (15), 613 (18), 301 (100) 33 20.2 301 MS2[301]: 257 (100), 229 (92) Ellagic acida ✓ ✓ ✓ 34 20.8 477 MS2[477]: 301 (100) Quercetin-O-glucuronide ✓ ✓ ✓ MS3[477 → 301]: 179 (100), 151 (72) 35 21.8 395 MS2[395]: 363 (100), 319 (9) Unknown ✓ MS3[395 → 363]: 287 (100), 275 (51), 255 (79)
36 23.8 491 MS2[491]: 475 (46), 469 (100), 453 (78) Gallic acid derivative ✓
MS3[491 → 469]: 453 (100), 169 (41)
MS4[491 → 469 → 453]: 301 (49), 169 (100)
Compound 17 exhibited [M-H]−at m/z 969 and base peak at m/z
633. In addition, it presented an MS3[969 → 633] fragment ion at m/z
301 (Table 2). This fragmentation pattern is consistent with phyl-lanthusiin B, previously reported in other Phyllanthus species (Liu et al., 1999;Wu et al., 2012).
Compound 19, with [M-H]−at m/z 951, exhibited a fragmentation
pattern similar to granatin B (galloyl-HHDP-DHHDP-hexoside) (Mena et al., 2014). This compound has been previously reported in pome-granate and maqui but has not been detected in Phyllanthus species to our best knowledge.
Compound 33 was identified as ellagic acid by comparison with an analytical standard. It presented deprotonated molecular ion at m/z 301 and fragment ions at m/z 257 and 229. Different compounds (21, 38, 40, 41, and 42) were tentatively characterised as ellagitannins derived from ellagic acid due to the present of ellagic acid in the MSn
frag-mentation pattern. In addition, compound 43 presented also gallic acid (169 → 125 fragmentation), which corresponds to an ellagitannin or gallotannin.
Compound 29 and 32 were tentatively characterised as castalagin derivatives (Fischer, Carle, & Kammerer, 2011). They displayed the deprotonated molecular ion at m/z 965 and base peak at m/z 933 (castalagin). The fragment ions at m/z 915, 613, and 301 were also indicative of castalagin.
3.2.4. Other compounds
Compound 1, only detected in methanolic extract, was identified as an HCl adduct of a disaccharide (Gómez-Caravaca, López-Cobo, Verardo, Segura-Carretero, & Fernández-Gutiérrez, 2016). Compound 2 was only observed in the water extract, and corresponded to citric acid (Mena et al., 2012). Compound 14 was tentatively characterised as the formate adduct of roseoside (vomifoliolglucoside or drovomifoliol-O-β-D-glucopyranoside) (Spínola, Llorent-Martínez, Gouveia, & Castilho, 2014). Compound 45 was characterised as oxo-dihydroxy-octadecenoic acid (Van Hoyweghen, De Bosscher, Haegeman, Deforce, & Heyerick, 2014).
3.2.5. Quantification of phenolic compounds
The quantification was performed using the following analytical standards: chlorogenic acid, ellagic acid, gallic acid, neochlorogenic acid, and quercetin. Each standard was used for the corresponding chemical family. Chromatograms were recorded at 280 nm for gallic
acid and ellagic acid, 320 nm for chlorogenic acids, and 350 nm for flavonoids. The results are shown inTable 3, although only the main compounds were quantified, as low analytical signals or overlappings were observed for some minor compounds. Total individual phenolic content (TIPC) was defined as the amount of all the quantified phenolic Table 2 (continued)
No. tR(min) [M-H]−m/z m/z (% base peak) Assigned identification Water Ethyl acetate MeOH
37 24.5 447 MS2[447]: 301 (100) Quercertin-O-deoxyhexoside ✓ MS3[447 → 301]: 179 (100), 151 (59) 38 24.7 477 MS2[477]: 461 (100), 301 (19) Ellagitannin ✓ MS3[477 → 461]: 439 (71), 301 (100), 169 (81) MS4[477 → 461 → 301]: 257 (100) 39 25.2 475 MS2[475]: 453 (100), 301 (34) Quercetin derivative ✓ ✓ MS3[475 → 453]: 301 (100) MS3[475 → 301]: 179 (100), 151 (72) 40 26.1 923 MS2[923]: 879 (78), 825 (47), 407 (24), 301 (100) Ellagitannin ✓ ✓ MS3[923 → 301]: 257 (100) 41 27.0 923 MS2[923]: 879 (23), 407 (22), 301 (100) Ellagitannin ✓ ✓ MS3[923 → 301]: 257 (100) 42 28.8 489 MS2[489]: 467 (100), 301 (41) Ellagitannin ✓ MS3[489 → 467]: 301 (100), 169 (38) MS4[489 → 467 → 301]: 257 (100) 43 32.3 489 MS2[489]: 467 (100), 301 (29), 169 (25) Ellagitannin/gallotannin ✓ MS3[489 → 467]: 301 (100), 169 (78) MS4[489 → 467 → 301]: 257 (100) MS4[489 → 467 → 169]: 125 (100) 44 35.7 301 MS2[301]: 179 (74), 151 (100) Quercetina ✓ 45 39.2 327 MS2[327]: 291 (19), 229 (28), 211 (18), 171 (100) Oxo-dihydroxy-octadecenoic acid ✓ ✓ ✓ HHDP = hexahydroxydiphenoyl; DHHDP = dehydrohexahydroxydiphenoyl;
a Confirmed with analytical standards.
Table 3
Quantification of compounds in the analyzed extracts of P. phillyreifolius. Results are expressed in mg/g DE; n = 3.
N° Assigned identification Water Ethyl acetate MeOH
Phenolic acids 5 Gallic acid 13.7 ± 0.5 1.03 ± 0.03 3.22 ± 0.02 6 Dihydroxybenzoic acid-Hex 0.20 ± 0.01 7 5-O-CQA 0.80 ± 0.02 0.48 ± 0.02 8 Digalloylquinic acid 0.15 ± 0.01 12 3-O-CQA 0.35 ± 0.02 0.33 ± 0.01
18 Gallic acid der 6.5 ± 0.2
23 Gallic acid der 4.5 ± 0.2
25 + 26 Gallic acid der 1.7 ± 0.1 1.3 ± 0.1 0.36 ± 0.02
30 Gallic acid der 4.8 ± 0.2
31 Gallic acid der 8.7 ± 0.3 1.4 ± 0.1
36 Gallic acid der 1.25 ± 0.06
Total 36.5 ± 0.7 3.3 ± 0.1 11.0 ± 0.2 Flavonoids 27 Quercetin der 0.16 ± 0.01 28 Quercetin-O-Rut 0.21 ± 0.01 34 Quercetin-O-Gluc 6.6 ± 0.3 2.23 ± 0.07 4.9 ± 0.2 37 Quercertin-O-dHex 0.15 ± 0.01 44 Quercetin 0.58 ± 0.03 Total 7.0 ± 0.3 2.38 ± 0.07 5.5 ± 0.2 Ellagitannins 16 HHDP-galloyl-glucose 63 ± 2 20.5 ± 0.8 199 ± 6 17 Phyllanthusiin B 45 ± 1 7.6 ± 0.3 19 Granatin B 57 ± 2 163 ± 5 32 Castalagin der 25 ± 1 33 Ellagic acid 20 ± 1 7.0 ± 0.5 158 ± 4 38 Ellagitannin 12.6 ± 0.8 40 Ellagitannin 1.27 ± 0.03 41 Ellagitannin 3.3 ± 0.1 6.0 ± 0.2 42 Ellagitannin 4.8 ± 0.2 Total 190 ± 3 220 ± 5 383 ± 7 TIPC 233 ± 3 226 ± 5 400 ± 7
Hex = hexoside; Rut = rutinoside; Gluc = glucuronide; dHex = deoxyhexoside; CQA = caffeoylquinic acid; der = derivative.
compounds.
The methanolic extract presented the highest TIPC (400 ± 7 mg/g DE), followed by aqueous and ethyl acetate extracts, which presented similar TIPCs (226–233 mg/g DE). The aqueous extract was abundant in ellagitannins (approximately 81% of TIPC), although phenolic acids (16%) and flavonoids (only 3%) were also detected. A similar trend was observed in ethyl acetate and methanolic extracts, in which ellagi-tannins accounted for 97% and 96%, respectively. Regarding individual compounds, the most abundant ellagitannins in water extract were compounds 16, 17, and 19; in ethyl acetate extract, compound 19; and compounds 16 and 33 in methanolic extract. Although most of these compounds have been previously reported in Phyllanthus species, the presence of compound 19 (granatin B) is here described for the first time.
To our best knowledge, this is the first report on the phenolic composition of P. phillyreifolius, and there is not much information concerning the amounts of phenolics in other Phyllanthus plants, as most of the studies focused on the TPC and TFC assays. Six compounds were quantified in P. amarus (Kumar et al., 2015); the authors reported gallic acid contents between 0.45 and 32.80 mg/g, which are similar to the ones here reported. For quercetin, the concentrations reported in P. amarus ranged between non-detected and 5.22 mg/g, which is also in agreement with the values here observed in P. phillyreifolius. In other work carried out in P. maderaspatensis (Bagul, Srinivasa, Padh, & Rajani, 2005), the authors reported contents of 0.64 and 0.96 mg/g for gallic acid and ellagic acid, respectively. These values are much lower than the ones observed in the present work. Hence, although scarce in-formation is available concerning individual contents of bioactive compounds in Phyllanthus species, the quantification here provided indicates high concentrations of phytochemicals in the extracts ana-lyzed.
3.3. Antibacterial activity
Over the past decades, enormous advancements have been accom-plished in the microbiological areas such as the control of micro-organisms, especially bacteria. However, further investigation is re-quired to fight drug-resistant pathogens, which are threatening the public health system. In this respect, we have designed the current in-vestigation in an endeavour to find novel antimicrobial agents (Ogbole, Segun, & Fasinu, 2018).
The results for the antibacterial activity of P. phillyreifolius by disc diffusion assay are shown inTable 4. In general, the different extracts of P. phillyreifolius exhibited significant antibacterial activity towards all the tested strains, with varying degrees of effectiveness among the ex-tracts. We found that S. aureus (ZOI = 16.33 mm) and S. epidermidis (ZOI = 23.23 mm) were the most susceptible to the methanol extract of P. phillyreifolius extracted using Soxhlet method. On the other hand, the macerated methanol extract exhibited the highest inhibition against E. coli (ZOI = 14.23 mm) followed by the macerated ethyl acetate extract (ZOI = 11.67 mm). The macerated ethyl acetate extract was also the most effective in inhibiting the growth of B. cereus (ZOI = 20.67 mm). In contrast, the decoction extract showed the least antibacterial activity against S. aureus, E. coli, and B. cereus.
With regards to the MIC of the tested extracts, the lowest MIC value observed against S. aureus was exhibited by the macerated methanolic extract (MIC = 0.781 mg/mL). The ethyl acetate extract of P. phillyr-eifolius extracted using the Soxhlet method showed the lowest MIC against S. epidermidis (MIC = 0.521 mg/mL) followed by the macerated ethyl acetate extract (MIC = 0.81 mg/mL). As for E. coli and B. cereus, the lowest MIC values were displayed by the macerated ethyl acetate extract (MIC = 0.417 and 0.293 mg/mL, respectively). The extracts were less effective compared to the positive control streptomycin which showed MIC values in the range 0.031–0.5 mg/mL.
The extracts that possessed the highest TPC and TFC did not display the highest antibacterial effects, except the Soxhlet methanolic extract, Table
4 Antibacterial activity of the P. phillyreifolius extracts. a Bacteria Disc diffusion (ZOI-mm) Microdilution (MIC-mg/ml) Positive control (MIC-mg/ml) MeOH-Maceration MeOH-Soxhlet EA-Maceration EA-Soxhlet Decoction MeOH-Maceration MeOH-Soxhlet EA-Maceration EA-Soxhlet Decoction Streptomycin S.aureus 12.10 ± 1.56 16.33 ± 2.08 15.23 ± 1.57 11.33 ± 1.16 6.43 ± 5.58 0.781 ± 0.00 1.04 ± 0.456 1.31 ± 0.456 1.57 ± 0.00 1.57 ± 0.00 0.5 ± 0.00 S. epidermidis 20.33 ± 3.79 23.23 ± 4.90 20.73 ± 1.27 17.00 ± 2.65 22.77 ± 4.61 1.04 ± 0.456 2.61 ± 0.901 0.81 ± 0.746 0.521 ± 0.225 6.25 ± 0.00 0.125 ± 0.00 E. coli 14.23 ± 4.53 9.33 ± 8.33 11.67 ± 10.41 9.33 ± 8.14 3.67 ± 6.35 1.31 ± 0.456 0.781 ± 0.00 0.417 ± 0.352 0.521 ± 0.225 3.13 ± 0.00 0.031 ± 0.00 B. cereus 17.67 ± 1.53 19.33 ± 1.53 20.67 ± 2.31 17.33 ± 2.08 11.67 ± 1.16 0.781 ± 0.00 0.781 ± 0.00 0.293 ± 0.169 3.13 ± 0.00 1.57 ± 0.00 0.0625 ± 0.00 EA: Ethyl acetate; MeOH: Methanol; MIC: Minimum inhibitory concentration; ZOI: Zone of inhibition. aValues expressed are means ± S.D. of three parallel measurements.
which showed the highest ZOI against S. aureus and S. epidermidis, al-though it was not the same case in the microdilution assay. In addition, from the above findings, we observed that the extracts that showed the lowest MIC values did not display the highest ZOI in the disc diffusion assay, with the exception of the bioactivity of the macerated ethyl acetate extract against B. cereus. The presence of high molecular weight antibacterial compounds in the extracts could lead to this discrepancy; these compounds may not diffuse easily through the agar in the disc diffusion assay to inhibit bacterial growth, while in the microdilution method, the bioactive compounds are in direct contact with the bacteria in the solution.
3.4. Antioxidant activity
The antioxidant potential of P. phillyreifolius extracts were evaluated through a series of assays reflecting their radical scavenging, reducing power, total antioxidant, and chelating effect. The scavenging effects of the solvent extracts were evaluated using the DPPH and ABTS assays. Two reducing assays were also conducted; the FRAP assay involves the reduction of ferric to ferrous by antioxidants while the CUPRAC method is based on the reduction of cupric to cuprous (Turan, Adıguzel, Buldurun, & Bursal, 2016). We also evaluated the total antioxidant activity of the extracts using the phosphomolybdenum method in which the reduction of molybdenum (VI) to molybdenum (V) by antioxidative compounds is observed (Meshkini, 2016). The chelation of transition metals is also one important mechanism of antioxidants, which was also determined in the current study.
It can be observed inTable 1that the methanol extract of P. phil-lyreifolius obtained by maceration possessed the best DPPH and ABTS scavenging properties (2.91 and 4.12 mmol TE/g, respectively). The decoction extract was also equally effective in scavenging ABTS radical (4.11 mmol TE/g); however, it was the weakest DPPH scavenger. Si-milarly, the decoction extract showed the lowest antioxidant properties in the phosphomolybdenum assay, while the highest activity was ex-hibited by the macerated ethyl acetate extract (5.04 mmol TE/g). It should be highlighted that although the decoction extract had the highest TPC, it displayed the lowest activity in the phosphomo-lybdenum and DPPH assays, which indicates that the total bioactive compounds in terms of TPC do not always correlate with the observed activity. On the other hand, the methanol extract of P. phillyreifolius obtained by the Soxhlet method exerted the strongest cupric and ferric reducing power (5.04 and 3.17 mmol TE/g, respectively) and metal chelating effect (26.30 mg EDTAE/g) which was in agreement with its TFC, since this extract showed the highest TFC compared to the other tested extracts. In fact, several authors (Choudhury, Ghosal, Das, & Mandal, 2013;Kanmaz & Saral, 2017;Silva & Sirasa, 2018) found that plant extracts containing high TFC also presented high antioxidant ability in the metal chelating, CUPRAC, and FRAP assays. Also, the ethyl acetate extracts obtained from the maceration and Soxhlet ex-traction methods, which possessed the lowest TPC and TFC, displayed the weakest antioxidant ability in the three above mentioned assays and also the ABTS assay, which indicates that phenolics and flavonoids are major contributors to the antioxidant activity of the tested extracts. 3.5. Inhibitory activity on key enzymes
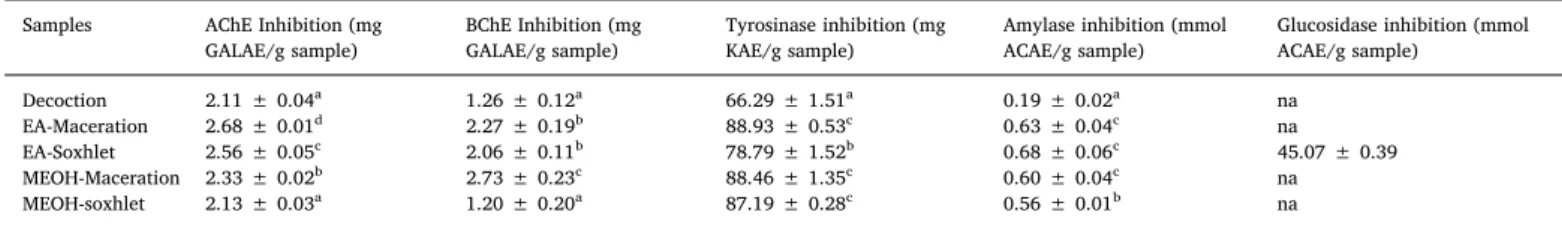
The enzyme inhibitory potential of P. phillyreifolius extracts were evaluated against tyrosinase, α-amylase, α-glucosidase, and two choli-nesterases (AChE and BChE). The findings are shown inTable 5. The two cholinesterases are enzymes that hydrolyse acetylcholine and bu-tyrylcholine, resulting in their shortage, which is associated with neu-rological conditions including Alzheimer's disease. Hence, the inhibi-tion of these key enzymes is known as an effective therapy for Alzheimer's disease. Also, the inhibition of α-amylase and α-glucosidase is another therapeutic approach in diabetic patients by retarding starch degradation and, consequently, reduces the postprandial blood glucose
levels (Gulçin et al., 2018; Taslimi et al., 2018). On the other hand, preventing excess melanin formation by the use of tyrosinase inhibitors are helpful in the management of pigmentation and neurodegenerative problems such as Parkinson's disease, and also the undesired browning formation in fruits and vegetables (Aghraz et al., 2018; Tusevski, Krstikj, Stanoeva, Stefova, & Simic, 2018).
As observed inTable 5, the most effective AChE inhibitor was the macerated ethyl acetate extract (2.68 mg GALAE/g) while the ma-cerated methanolic extract was the most efficient BChE inhibitor (2.73 mg GALAE/g). Moreover, the macerated ethyl acetate extract displayed the highest tyrosinase inhibitory properties (88.93 mg KAE/ g) followed by the macerated methanolic extract (88.46 mg KAE/g) and the Soxhlet methanolic extract (87.19 mg KAE/g). In contrast, the ethyl acetate extract of P. phillyreifolius prepared by the Soxhlet method showed the strongest inhibitory effect against α-amylase (0.68 mmol ACAE/g) and α-glucosidase (45.07 mmol ACAE/g). The other extracts did not display any α-glucosidase inhibitory activity. It is noteworthy to highlight that although the decoction extract indicated the highest TPC, it displayed weak enzyme inhibitory effect. Also, the high enzyme in-hibitory effect of the ethyl acetate extracts did not tally with their TPC and TFC since low amount was observed in the extract. This could be explained by the presence of other compounds that could be responsible for the observed activity. In fact, different classes of phenolics and flavonoids have different biological potentials. It has been argued that not all flavonoids possess the same characteristics. The bioactivities are related to their structure, hydroxylation degree, conjugation and other substitutions, as well as the extent of polymerization (Kumar & Pandey, 2013).
3.6. Computational approaches
From the docking analysis, we found that among the selected sub-stances (Supplemental Fig. 1), ellagic acid and HHDP-galloyl-glucose displayed the best ranking score (Supplemental Table 1) in the docking experiments carried out by Gold 6.0 using the GoldScore scoring function. In particular, HHDP-galloyl-glucose docking pose was stabi-lised by the formation of three hydrogen bonds to Ser282, Gly281, Met280, one π-π interaction to Phe261 and a cation-π interaction with Arg268. However, this molecule was not capable to penetrate in the deep of the tyrosinase enzymatic cavity and bind the metal atoms herein. On the other hand, ellagic acid had almost the same goldscore fitness (Supplemental Table 1) than HHDP-galloyl-glucose, and its best ranked docking pose was stabilised by the formation of three π-π stacks with His85 and 259, Phe264; it is also capable of accommodating itself in the deep of the enzymatic cavity and to interact with both Cu atoms. Considering also the recent literature (Ortiz-Ruiz, Berna, Tudela, Varon, & Garcia-Canovas, 2016;Yoshimura, Watanabe, Kasai, Yamakoshi, & Koga, 2005) providing the ellagic acid inhibitory activity towards the tyrosinase enzyme, we selected this molecule for molecular dynamic experiments.
Numerous parameters have been analyzed from the simulation trajectory. In particular, the RMDS trajectory files were analyzed by using Simulation Interaction Diagram (SID) panel included in Desmond was used to calculate the energies, root-mean-square deviation (RMSD (Fig. 1B) (Guo et al., 2010). RMSD values of the Cα of the enzyme and of the ligand were extracted from the simulation and are reported in Fig. 1B. From the graphic, it is possible to see that the protein oscillates around 1.0 to 1.4 RMSD after an initial time spend to equilibrate the system. The ligand oscillated from 0.6 to 1.4 Angstrom.
InFig. 1D, we reported the most important interactions between the enzyme and ellagic acid. The most important interactions are main-tained over the dynamic, in particular the π-π stacks to His85 and 259 and the coordinative bonds to Cu400 and Cu401 atoms. Also, another interaction has been formed during the simulation, with residue Glu256. These data demonstrate a specificity of ellagic acid pose gen-erated by GOLD 6.0 for tyrosinase, and the stability of this pose
indicates that this molecule has a high affinity for the enzymatic tyr-osinase pocket. Moreover, the docking score of ellagic acid, expressed as Gold Fitness, resulted to be among the highest of the series, together with the value of HHDP-galloyl-glucose. This latter result is also due to a large formation of interactions with several residues of the enzymatic pocket, however, in the case of HHDP derivative, without being able to coordinate the copper atoms (Supplemental Table 1).
All the computational analyses and the literature data are in agreement with the enzymatic activity present in this study, demon-strating that the extract of P. phyllyreifolius contains mainly ellagi-tannins capable to strongly inhibit the tyrosinase enzyme. This effect may be explained by the presence of ellagic acid and other ellagi-tannins.
3.7. Anticancer activity
Chemotherapeutic drugs have been employed for decades to manage and/or treat cancer. However, they exhibit toxic effects on normal tissues and are also affected by drug resistance. From this point, new chemotherapeutic drugs/approaches are required to fight cancer. In fact, plant extracts and their derived bioactive compounds have demonstrated promising results in the management of cancer. These compounds can kill cancer cells via a plethora of mechanisms: by en-hancing the immune system, causing cell apoptosis, reversing multi-drug resistance, and through the inhibition of angiogenesis (Almosnid et al., 2018). In our study, the cytotoxic activities of the P. phillyreifolius extracts (decoction and ethyl acetate/methanol-Soxhlet extracts) were Table 5
Enzyme inhibitory activity of the P. phillyreifolius extracts.a
Samples AChE Inhibition (mg
GALAE/g sample) BChE Inhibition (mgGALAE/g sample) Tyrosinase inhibition (mgKAE/g sample) Amylase inhibition (mmolACAE/g sample) Glucosidase inhibition (mmolACAE/g sample)
Decoction 2.11 ± 0.04a 1.26 ± 0.12a 66.29 ± 1.51a 0.19 ± 0.02a na
EA-Maceration 2.68 ± 0.01d 2.27 ± 0.19b 88.93 ± 0.53c 0.63 ± 0.04c na
EA-Soxhlet 2.56 ± 0.05c 2.06 ± 0.11b 78.79 ± 1.52b 0.68 ± 0.06c 45.07 ± 0.39
MEOH-Maceration 2.33 ± 0.02b 2.73 ± 0.23c 88.46 ± 1.35c 0.60 ± 0.04c na
MEOH-soxhlet 2.13 ± 0.03a 1.20 ± 0.20a 87.19 ± 0.28c 0.56 ± 0.01b na
EA: Ethyl acetate; MeOH: Methanol; GALAE: Galatamine equivalent; KAE: Kojic acid equivalent; ACAE: Acarbose equivalent; na: not active. Different letters in same column indicate a significant difference in the extracts (p < 0.05).
a Values expressed are means ± S.D. of three parallel measurements.
Fig. 2. Cellular morphology (A, C) and cell viability (MTT) test analysis (B, D) of HeLa cells after treatment of different concentrations of extracts with 24 and 48 h, respectively. Control cells were treated with 0.1% of DMSO solution.
evaluated against two cancer cell lines: HeLa and MDA-MB-231. Worldwide, cancer of the cervix is one of the most common types of cancer in woman. The outcome of patients with metastatic cervical cancer is poor and their 1-year survival is < 20% (He et al., 2018). The present finding revealed that after 24 h, no IC50values were obtained
for the extracts against HeLa cells since their survival was > 50%. After 48 h, the Soxhlet-ethyl acetate extract of P. phillyreifolius showed the highest inhibition against HeLa cells (IC50= 533.1 μg/mL) followed by
the Soxhlet-methanol extract (IC50= 586.5 μg/mL) and decoction
ex-tract (IC50= 690.3 μg/mL) (Fig. 2; Supplemental Fig. 2). It can be
concluded that treatment of HeLa cells with all P. phillyreifolius extracts resulted in a time-dependent reduction of cell viability. In addition, Bax (an apoptosis promoter) to Bcl-2 (an apoptosis inhibitor) ratio was in-vestigated in all Soxhlet-extracts of P. phillyreifolius. Examination of Bcl-2 and Bax regulations revealed that gene expression level of Bcl-Bcl-2 was slightly increased by ethyl acetate and decoction extracts whereas gene expression level of Bax was significantly decreased for all Soxhlet-ex-tracts (Fig. 3A).
Gallic acid (GA) is a poly hydroxyl-phenolic compound commonly found in different plant species. Its anticancer effects in various cancer lines have been reported in different studies (Liao, Chen, Huang, & Wang, 2018;Lima et al., 2016;Lu et al., 2010;Tan et al., 2015;You, Moon, Han, & Park, 2010;You & Park, 2010). In one study, researchers evaluated the effects of GA on HeLa cells in relation to cell growth inhibition and death. They found that HeLa cell growth was diminished with an IC50of approximately 80 μM GA at 24 h (You et al., 2010). In
another study, the effects of different concentration of GA on the via-bility and proliferation of HeLa cells were evaluated. The dose-and time-dependent reduction of the cell viability by GA was observed in
HeLa cells. They found that after 72 h, GA showed moderate toxicity with a median lethal dose (LD) ~121 μM in HeLa cells (Tan et al., 2015). The current study shows that all Soxhlet-extracts of P. phillyr-eifolius, which also contain GA, significantly reduced cell viability in a time-dependent manner for HeLa cell line. These results seem to be consistent with other research that found that GA or GA containing plant extracts cause crucial reduction in cell viability of HeLa cells.
Apoptosis is the process of programmed cell death which provides maintenance of homeostasis for living organisms. This mechanism is controlled by several promoters, oncogenes and subsequently onco-proteins that indicate inhibiting or promoting action. Comparison of the present findings with previous studies confirms that cell death in HeLa cells is induced by different mechanisms such as apoptosis, necrosis (You et al., 2010), and mitotic catastrophe (Tan et al., 2015).You et al. (2010)indicated that HeLa cell death was stimulated by apoptotic and/ or necrosis pathways which was evidenced by annexin V-staining cells and caspase inhibitor-tested results (You et al., 2010). When GA con-centration augmented, the number of dead cells also increased but did not increase the percent of sub-G1 cells. This means that dead cell populations in GA-treated HeLa cells did not undergo sub-G1 cell po-pulations. Similarly,Tan et al. (2015)observed that GA induces arrest at the G2/M transition in HeLa, a well-known mechanism known as mitotic catastrophe, resulting in aberrant or abortive mitosis (Tan et al., 2015). The results of this study indicate that the gene expression ratio of Bcl-2 to Bax was high for all Soxhlet-extracts of P. phillyreifolius. This actually means that an apoptosis inhibitor (Bcl-2) was more dominant than an apoptosis promoter (Bax). This also implies that HeLa cell death was induced by different mechanisms rather than apoptosis in our study. In general, therefore, it seems that Soxhlet-extracts of P. Fig. 3. Apoptotic marker gene expressions. (A) HeLa and (B) MDA-MB-231 cells were treated with P. phillyreifolius extracts for 48 h, transcript levels of the marker genes were analyzed in total RNA by qRT-PCR. GAPDH was used as internal control. *p < 0.05.
phillyreifolius inhibit the growth of HeLa cells via necrosis or mitotic catastrophe depending on the concentrations and treatment duration of extracts.
The MDA-MB-231 cell is one of the most important cell lines to detect anti-cancer potential in the scientific platform. In this study, we found that after 24 h exposure, the decoction extract caused a 50% inhibition of MDA-MB-231 cell at a concentration of 883.7 μg/mL, which was more effective compared to the Soxhlet-ethyl acetate extract (IC50 = 925.6 μg/mL). No IC50 value was recorded for the
Soxhlet-methanolic extract after 24 h exposure. After 48 h treatment of different extracts, a greater inhibition was observed by the decoction extract (IC50= 337.4 μg/mL) followed by the Soxhlet-methanolic extract
(IC50= 372.2 μg/mL) and the Soxhlet-ethyl acetate extract
(IC50= 461.6 μg/mL) (Fig. 4; Supplemental Fig. 2). The
Soxhlet-me-thanol and decoction extracts decreased the percentage of viable MDA-MB-231 cells in a dose- and time-dependent manner. Similar Bcl-2 and Bax gene expression results were also obtained for MDA-MB-231 cell line after treatment of all P. phillyreifolius extracts. Bax gene was down-regulated whereas gene expression level of Bcl-2 was high after treat-ment of all Soxhlet extracts (Fig. 3B).
Quercetin is a well-known flavonol that is found in fruits, vege-tables, and tea. It prevents proliferation of cells, induction of cell cycle arrest and cause apoptosis in different cancers, especially breast cancer cell lines (Chien et al., 2009; Nguyen et al., 2017; Ranganathan, Halagowder, & Sivasithambaram, 2015;Wang et al., 2018). In an ear-lier study, researchers indicated that quercetin significantly diminished the percentage of viable cells with dose- and time-dependent manner. They also found that quercetin-induced reduction of MDA-MB-231cell
line was regulated by apoptosis through flow-cytometer and DNA fragmentation analysis (Chien et al., 2009). In a study conducted by Ranganathan et al. (2015), anti-proliferative effect of quercetin was investigated in two breast cancer cell lines (MCF-7 and MDA-MB-231). MCF-7 cells were sensitive to quercetin with an IC50value of 37 μM.
However, quercetin showed slight cytotoxicity to MDA-MB-231 cells (Ranganathan et al., 2015).Ranganathan et al. (2015)claimed that a higher quercetin concentration might display cytotoxic effect for MDA-MB-231 cells. In contrast, lower dose of quercetin might be effective on different cancer lines when combined with other therapeutic agents (Li et al., 2014). In this way, our findings could also be explained with this fact. In the same study, the cell cycle analysis showed that apoptotic cells were only observed in MCF-7 cells not in MDA-MB-231 after 24 h of quercetin treatment (Ranganathan et al., 2015). This finding broadly supports our work in which gene expression ratio of Bcl-2 was higher than Bax gene compared to their control samples. It is possible to hy-pothesize that cell death of MDA-MB-231 may be stimulated by dif-ferent mechanisms rather than apoptosis. These findings are consistent with that ofNguyen et al. (2017)who indicated that quercetin induced cell apoptosis and inhibited cell cycle progression in MDA-MB-231 breast cancer cell line (Nguyen et al., 2017). In a recent study, it was found that quercetin application suppressed cell proliferation, self-re-newal, and invasiveness of MDA-MB-231 cells (Wang et al., 2018). A very interesting key study conducted by Huang et al. (2013) in-vestigated the inhibitory effects of some phenolics (gallic acid (GA), (−)-epigallocatechin gallate (EGCG), or 1,2,3,4,6-penta-O-galloyl-β-D
-glucose (5GG)) combined with quercetin on breast cancer cells (Huang et al., 2013). They found that treatment of quercetin combined with Fig. 4. Cellular morphology (A, C) and cell viability (MTT) test analysis (B, D) of MDA-MB-231 cells after treatment of different concentrations of extracts with 24 and 48 h, respectively. Control cells were treated with 0.1% of DMSO solution.