DETECTION OF COMPOUND STRUCTURES USING HIERARCHICAL CLUSTERING OF
STATISTICAL AND STRUCTURAL FEATURES
H. G¨okhan Akc¸ay, Selim Aksoy
Department of Computer Engineering
Bilkent University
Bilkent, 06800, Ankara, Turkey
{akcay,saksoy}@cs.bilkent.edu.tr
ABSTRACT
We describe a new procedure that combines statistical and structural characteristics of simple primitive objects to dis-cover compound structures in images. The statistical informa-tion that is modeled using spectral, shape, and posiinforma-tion data of individual objects, and structural information that is modeled in terms of spatial alignments of neighboring object groups are encoded in a graph structure that contains the primitive objects at its vertices, and the edges connect the potentially related objects. Experiments using WorldView-2 data show that hierarchical clustering of these vertices can find high-level compound structures that cannot be obtained using tra-ditional techniques.
Index Terms— Object detection, alignment detection,
graph-based representation, hierarchical clustering 1. INTRODUCTION
A common approach to object recognition is to segment the images into homogeneous regions and classify these regions. However, as the spatial resolution increases, such homoge-neous regions often correspond to very small details. An al-ternative for semantic image understanding is to identify the image regions that are intrinsically heterogeneous. Examples of such regions, also called compound structures, include dif-ferent types of residential, commercial, industrial, and agri-cultural areas that are comprised of spatial arrangements of
primitive objects such as buildings, roads, and trees.
How-ever, modeling of such structures is a challenging problem because their appearances have become increasingly complex in the new generation very high spatial resolution images.
Hierarchical segmentation has received significant atten-tion as a potential soluatten-tion to the detecatten-tion of compound structures because different structures can appear in different scales. One of the main problems is to determine how the hi-erarchy is constructed. A common method is splitting and/or merging based on spectral homogeneity. However, this does
This work was supported in part by the TUBITAK Grant 109E193.
not work for complex structures that are intrinsically hetero-geneous and consist of multiple parts with different spectral characteristics. Hence, many structures of interest do not appear in the hierarchy due to such limitations.
As an alternative, Gaetano et al. [1] performed hierarchi-cal texture segmentation assuming that frequent neighboring regions are strongly related. They clustered the image re-gions to compute the frequencies of quantized region pairs. Zamalieva et al. [2] used a similar frequency-based approach but in a continuous domain where the modes of a prob-ability distribution estimated using the features of region co-occurrences were used to construct the edges of a graph, and a graph mining algorithm was used to find subgraphs that may correspond to compound structures. Dogrusoz and Ak-soy [3] also used a graph-based model that clustered building into groups with similar spatial arrangements to model the regularity of urban structures. Vanegas et al. [4] proposed a method based on fuzzy measures of relative direction between objects to detect aligned object groups. They first detected locally aligned groups of three objects, and then checked for global alignment using these local alignments.
This paper describes our work on the modeling and de-tection of compound structures using a graph-based spatial model where primitive objects such as buildings (Section 2) form the vertices of this graph, and potentially related ob-jects are connected using undirected edges. Each vertex that corresponds to a particular primitive object is assigned sta-tistical features that represent the properties of the individual object as well as structural features that represent the spatial layout of this object with respect to its neighbors (Section 3). Then, hierarchical clustering of these vertices produces differ-ent levels of compound structures (Section 4). The proposed model is illustrated using a WorldView-2 image (Section 5).
2. DETECTION OF PRIMITIVE OBJECTS The set of primitives includes objects that can be relatively easily extracted using low-level operations that exploit spec-tral, textural, and morphological information. These objects,
2385
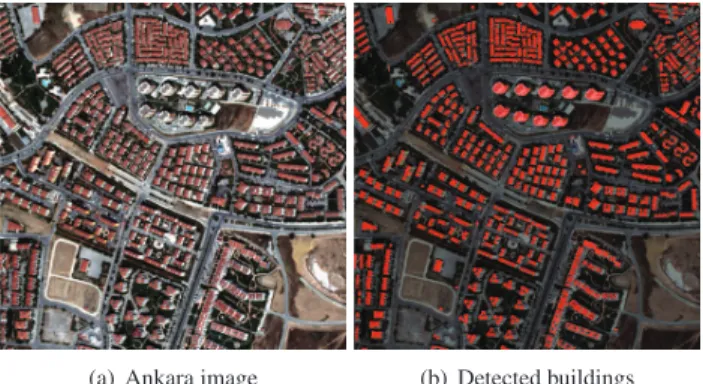
(a) Ankara image (b) Detected buildings
Fig. 1. Examples of building detection in the Ankara image. The detected buildings are highlighted with red in (b).
such as buildings, roads, trees, can be used as building blocks of more complex structures. Since our focus is on the model-ing and detection of compound structures, this initial process-ing is kept as simple as possible in this paper.
The proof-of-concept experiments in Section 5 use group-ings of buildgroup-ings to form compound structures. The build-ings are detected using thresholding of different spectral bands. Figure 1 shows example building detection results in a 500 × 500 pixel multispectral WorldView-2 image of Ankara, Turkey. Since most of the buildings have similar roof colors in this image, thresholding gave acceptable results for the rest of the analysis. Improvements to the detections in this preprocessing step can improve the overall process. The rest of the algorithm supports the use of different primitives that can be added to this set for different applications.
3. FEATURE EXTRACTION 3.1. Image representation
The image content is modeled using attributed relational graphs where the primitives form the vertices and the poten-tially related objects are connected using undirected edges. We assume that neighboring objects can be related, and con-nect every neighboring vertex pair with an edge. The neigh-borhood information is obtained by proximity analysis where a threshold on the distance between the centroids of object pairs is used to determine the neighbors. Figure 2 shows an example graph where the building objects in Figure 1 are used as vertices of interest and edges are drawn using a dis-tance threshold of40 pixels. After the graph is constructed, the vertices and edges are assigned statistical and structural features (attributes) as described below.
3.2. Statistical features
The statistical features for vertices represent the properties of individual objects. These features consist of spectral features that are the mean values of the pixels within the object for
(a) Building mask (b) Neighborhood graph
Fig. 2. Examples of graph construction. The vertices that are considered as neighbors based on proximity analysis are connected with red edges in (b).
each spectral band (e.g.,sij, j = 1, . . . , k, for k bands), and shape features such as area, ai, and eccentricity, ei, where
i = 1, . . . , n and n is the number of objects. Area is
com-puted in terms of the number of pixels. Eccentricity is the ratio of the distance between the foci of the object to the length of its major axis. The centroid of each object,xiand
yi, is also computed as its representative location. These features, (si1, . . . , sik, ai, ei, xi, yi), summarize the spectral content and the shape of the corresponding objects. The sta-tistical feature assigned to each edge consists of the distance between the centroids of the corresponding vertices. All of the statistical features are normalized to the unit range by us-ing the respective minimum and maximum values.
3.3. Structural features
The structural features represent the spatial layout of each ob-ject with respect to its neighbors, and are extracted using the relationships among the neighboring objects. An important structural information is the amount of alignment among ob-jects. We propose a new method for the detection of aligned object groups below.
Given an image containingn objects, groups of aligned ones can be found by checking all possible subsets having at least three objects. These subsets can be generated using a depth-first search on the graph that is constructed as described above. Depth-first search on an undirected graph starts at a particular vertexv, and recursively traverses all vertices con-nected tov. This procedure is repeated by starting the search algorithm from each vertex in the graph. Once a path with at least three vertices is obtained, it is considered for possible alignment.
We define alignment of objects in terms of the collinear-ity of their centroids. A group of three or more objects are accepted as aligned if their centroids lie on a single straight line. The goodness of alignment is measured in terms of the sum of squared residuals after a least-squares line fitting on the centroid locations. Another important factor in an
(a) Building mask (b) Alignment detection
Fig. 3. Examples of alignment detection. Example groups of buildings satisfying the alignment criteria are shown in dif-ferent colors in (b). A total of622 aligned groups of three or more objects are detected in this image but only34 are shown for clarity in the figure.
ment is the uniformity of the spacing among the objects in the group. This is measured in terms of the standard deviation of the edge features in the path. Since the edge features consist of the distances between the centroids as described above, a small standard deviation indicates uniformity of spacing be-tween pairs of objects in the group.
An important step to avoid the exponential complexity of depth-first search and make the alignment detection algo-rithm feasible for large graphs is to perform pruning by using thresholds on the sum of squared residuals for the line fit-ting and the standard deviation of centroid distances. Using a threshold for each measure, the depth-first search is stopped if an object group is not aligned within the allowed limits, and no other group containing these objects is considered in the search. As a result, an object may belong to no aligned group, one aligned group, or more than one aligned groups.
At the end of the search procedure, the set of structural features computed for each object group corresponding to each path of three or more vertices consists of the orientation of the fitted line,θi, and the mean of the edge features (cen-troid distances),μi, wherei = 1, . . . , m and m is the number of detected aligned object groups. All of the structural fea-tures are normalized to the unit range by using the respective minimum and maximum values. Finally, each vertex in the graph is assigned a list of aligned object groups that it be-longs to as its structural features. Figure 3 shows examples of aligned object groups.
4. GROUPING OF PRIMITIVE OBJECTS After each object (vertex) is assigned statistical and structural features, the next step is to group these objects using an itera-tive multi-level hierarchical clustering. A one-level partition-ing of the feature space uspartition-ing iterative partitionpartition-ing methods such ask-means is not preferred because the number of
com-pound object types is often not known. Furthermore, a single level of partitioning may not be sufficient as different appli-cations may find different levels interesting.
Hierarchical clustering has the additional advantage of be-ing able to use pairwise object distances that can be defined in an abstract manner as opposed to the Euclidean distance that is used ink-means that requires a well-defined vector space. The pairwise object distances in hierarchical clustering can be computed separately for statistical features and structural features. The distance for two objects with respect to sta-tistical features described in Section 3.2 is computed using sum of squared differences between the corresponding fea-tures of these objects. The statistical distance will be small if two objects have similar spectral content, similar shape, and are spatially close to each other in the image. The distance with respect to structural features described in Section 3.3 is computed from the alignment groups that these objects belong to. The distance between two alignment groups is computed as the sum of squared differences between the correspond-ing features of these groups. The distance for two objects is computed as the minimum of the distances between all pairs of alignment groups where one group in a pair is associated with one of the objects and the other group is associated with the other object. The structural distance will be small if two objects belong to alignment groups whose orientations and object spacing are similar. If at least one of the objects is not found to belong to any alignment group, the distance of that object to any other object is set to∞.
Once the statistical and structural distances are computed for each neighboring object pair, agglomerative hierarchical clustering iteratively groups these objects to construct a tree representation in which each level corresponds to a particu-lar grouping. We experimented with different combinations of statistical and structural distances in clustering. A particu-lar setting that provided good results is to combine the results of separate clusterings using statistical distances and struc-tural distances. The criterion that is used to decide which two groups in a level are merged to form a new group in the next level is chosen as the average linkage criterion for statistical distances and single linkage criterion for structural distances. The average linkage criterion is used with statistical distances because we want all objects that are selected as belonging to the same group to have similar features. The single linkage criterion is used with structural distances because we want to merge two groupings of objects when they have at least one pair of objects, one coming from each group, that be-long to very similar alignments. These objects are often the ones belonging to the same alignment group that results in a zero structural distance. Finally, the two clustering results are combined by assigning the objects the same label if they are determined to belong to the same cluster by either statistical distances or structural distances. This corresponds to merg-ing two clusters that are separated by statistical distances if they contain objects belonging to the same cluster based on
structural distances, and merging two clusters that are sepa-rated by structural distances if they contain objects belonging to the same cluster based on statistical distances.
5. EXPERIMENTS
We performed experiments on the WorldView-2 image of Ankara (Figure 1) to illustrate the grouping framework pro-posed in this paper. A graph was constructed with418 ver-tices corresponding to the detected buildings and2, 610 edges obtained using proximity analysis. The alignment detection algorithm resulted in622 groups of three or more buildings aligned within the allowed limits. After the statistical and structural features were computed and the corresponding distances were recorded for each object pair, hierarchical clustering was performed to find compound structures as described in Section 4.
Clustering using statistical distances resulted in37 groups of a total of 254 buildings at an example hierarchy level shown in Figure 4(b). This level was manually selected by visual examination of the hierarchy. The remaining164 build-ings did not merge to any group at this level. We can observe that similar buildings that are close to each other may fall into different clusters while buildings with different characteris-tics may fall into the same cluster. This is expected because some building groups are characterized by their structural features (i.e., alignments) rather than similarities of their in-dividual statistical features. On the other hand, clustering using structural distances resulted in80 aligned groups of a total of402 buildings with 16 remaining buildings that did not belong to any group as shown in Figure 4(c). The re-sults show successful extraction of linearly aligned groups of three or more buildings. The groups that do not satisfy this strict definition of alignment remain separated. Finally, the combined clustering produced 38 groups containing a total of403 buildings and 15 remaining individual buildings as shown in Figure 4(d). The results show how building groups that are separated into different clusters by using only statistical features are merged by incorporating structural in-formation. We can conclude that groups of buildings with different characteristics and spatial layouts that cannot be ob-tained by traditional segmentation methods are successfully extracted by the proposed method. Such compound structures can be used for semantic understanding of remotely sensed images in high-level classification, content-based retrieval, and automated annotation applications.
6. CONCLUSIONS
We described a new procedure that combines statistical char-acteristics of primitive objects modeled using spectral, shape, and position information with structural characteristics en-coded using their spatial alignments modeled in terms of joint
(a) Building mask (b) Statistical clustering
(c) Structural clustering (d) Combined clustering
Fig. 4. Example clustering results. Different groups are shown in different colors. The buildings that did not merge to any group at the given level are shown as white.
orientation and uniformity of inter-object spacing for the de-tection of compound structures. The experiments that aimed to find building groups as structures of interest showed that combination of statistical and structural characteristics in a hierarchical clustering framework resulted in groupings that cannot be obtained by traditional segmentation techniques. Future work includes methods for automatic selection of pa-rameters and experiments on larger data sets.
7. REFERENCES
[1] R. Gaetano, G. Scarpa, and G. Poggi, “Hierarchical texture-based segmentation of multiresolution remote-sensing images,” IEEE Transactions on Geoscience and
Remote Sensing, vol. 47, no. 7, pp. 2129–2141, July 2009.
[2] D. Zamalieva, S. Aksoy, and J. C. Tilton, “Finding com-pound structures in images using image segmentation and graph-based knowledge discovery,” in IGARSS, 2009. [3] E. Dogrusoz and S. Aksoy, “Modeling urban structures
using graph-based spatial patterns,” in IGARSS, 2007. [4] M. C. Vanegas, I. Bloch, and J. Inglada, “Detection of
aligned objects for high resolution image understanding,” in IGARSS, 2010.