SOLAR RADIATION PREDICTION IN SOLAR
ENERGY SYSTEMS USING ANN MODELS
Aimen E. M. SARKEZ
2020
MASTER THESIS
ELECTRICAL AND ELECTRONIC
ENGINEERING
Thesis Advisor
SOLAR RADIATION PREDICTION IN SOLAR ENERGY SYSTEMS USING ANN MODELS
Aimen E. M. SARKEZ
T.C.
Karabuk University Institute of Graduate Programs
Department of
Electrical and Electronic Engineering Prepared as Master Thesis
Thesis Advisor
Prof. Dr. Necmi Serkan TEZEL
KARABUK December 2020
I certify that in my opinion the thesis submitted by Aimen E. M. SARKEZ titled “SOLAR RADIATION PREDICTION IN SOLAR ENERGY SYSTEMS USING ANN MODELS” is fully adequate in scope and in quality as a thesis for the degree of Master of Science.
Assist. Prof. Dr. Necmi Serkan TEZEL ... Thesis Advisor, Department of Electrical and Electronic Engineering
APPROVAL
This thesis is accepted by the examining committee with a unanimous vote in the Department of Electrical and Electronic Engineering as a Master of Science thesis. …./…../2020
Examining Committee Members (Institutions) Signature
Chairman : Title Name SURNAME (Uni. Abbr.) ...
Member : Title Name SURNAME (Uni. Abbr.) ...
Member : Title Name SURNAME (Uni. Abbr.) ...
Member : Title Name SURNAME (Uni. Abbr.) ...
The degree of Master of Science by the thesis submitted is approved by the Administrative Board of the Institute of Graduate Programs, Karabuk University.
“I declare that all the information within this thesis has been gathered and presented in accordance with academic regulations and ethical principles and I have according to the requirements of these regulations and principles cited all those which do not originate in this work as well.”
ABSTRACT
M. Sc. Thesis
SOLAR RADIATION PREDICTION IN SOLAR ENERGY SYSTEMS USING ANN MODELS: A CASE STUDY
Aimen E. M. SARKEZ
Karabük University Institute of Graduate Programs
Department of Electrical and Electronic Engineering.
Thesis Advisor:
Prof. Dr. Necmi Serkan TEZEL December 2020, 42 pages
Artificial neural networks (ANN) are a useful option when it comes to analyzing sensor data, detecting faults, setting up performance and reviewing related processes. For its key feature, the present work makes use of ANN modeling to forecast solar radiation in the city of Tripoli in Libya. The simulation is satisfactory and, hence, applicable to solar energy systems (SES), with the main advantage owed to the fact that the research makes use of arbitrary and nonlinear factors.
With economizing, SES enhancing, and improving electricity production in mind, the proposed ANN compares the output with the set targets based on weather data obtained from the Libyan State Meteorological Center. The trial-and-error method using MATLAB neural network fitting tool (nftool) helped to determine the best arrangement of functions to achieve the objective herein.
The weather data containing various variables is used to come up with a novel approach to determine SR with the highest possible precision. The approach is feed-forward back propagation (BP)-based the function of a tangent sigmoid transfer (tansig) between the input and the hidden layer with a range of neurons within one hidden layer and function of a linear transfer (purelin) at the output node, all employed in MATLAB’s neural network fitting tool (nftool).
The Levenberg-Marquardt (LM) algorithm was put to the test with a set of neurons after comparing the predicted figures with actual data from the Center using mean square error (mse) and coefficient of determination (R). The most applicable ANN model was then chosen with LM and ten neurons to forecast SR which yielded promising results with insignificant MSE and R2 above 0.93.
To conclude, the suggested approach and ANN model is applicable for SR forecasting and, therefore, a step forward in improving SES-based energy production. Obviously, it goes without saying that certain theoretical architectures based on ANN continue to play a key role in determining the best simulations for yet improved results in the future.
Key Word : Artificial neural networks, Matlab, The Levenberg-Marquardt, solar energy systems.
ÖZET
Yüksek Lisans Tezi
SOLAR RADIATION PREDICTION IN SOLAR ENERGY SYSTEMS USING ANN MODELS
Aimen E. M. SARKEZ
Karabük Üniversitesi Lisansüstü Eğitim Enstitüsü
Elektrik ve Elektronik Mühendisliği Anabilim Dalı
Tez Danışmanı:
Prof. Dr. Necmi Serkan TEZEL December 2020, 42 sayfa
Yapay sinir ağları (YSA), sensör verilerini analiz etmek, hataları tespit etmek, performansı ayarlamak ve ilgili süreçleri gözden geçirmek söz konusu olduğunda iyi bir seçenektir. Temel özelliği sebebiyle, Bu çalışmada Libya'nın Trablus kentindeki güneş ışığını tahmin etmek için YSA modellemesini kullanılmıştır. Simülasyonda iyi sonuçlar elde edilmiştir ve bu sebeple güneş enerjisi sistemlerine (GES) uygulanabilir. Önerilen YSA modelinin sonuçları, Libya Devlet Meteoroloji Merkezi'nden elde edilen hava durumu verileri ile karşılaştırılmıştır. MATLAB sinir ağı uydurma aracını (nftool) kullanan deneme yanılma yöntemi, burada belirlenin amaca ulaşmak için fonksiyonların en iyi şekilde belirlemesine yardımcı olmuştur.
Çeşitli değişkenleri içeren hava durumu verileri, Güneş ışığını mümkün olan en yüksek doğrulukta belirlemek için yeni bir yaklaşım geliştirmek için kullanıldı. Önerilen yöntemde, ara katmanlar içerenileri beslemeli geri yayılım (BP)’lı ve teğet sigmoid
transfer (tansig) fonksiyonlu yapay sinir ağı olup, tümü MATLAB'ın sinir ağı uydurma aracında (nftool) kullanılarak similasyonu yapılmıştır.
En uygun YSA modelini bulmak için Levenberg-Marquardt (LM) algoritması kullanıldı. Güneş ışığını tahmin etmek için 10 nöronlu YSA modelinin karesel hatası oldukça küçük iyi sonuçlar verdiği görüldü.
Sonuç olarak, önerilen yöntem ve YSA modeli, güneş ışığını tahmini için uygulanabilir ve bu nedenle, SES tabanlı enerji üretimini iyileştirmede kullanılabilir. İleriki çalışmalarda daha farklı mimarilere sahip YSA modelleri kullanılarak daha iyi sonuçlar elde edilmesi mümkündür.
Anahtar Kelimeler : Yapay sinir ağları, Matlab, Levenberg-Marquardt, güneş enerjisi sistemleri.
ACKNOWLEDGMENT .
First of all, I would like to give thanks to my advisor, Prof. Dr. Necmi Serkan TEZEL for his great interest and assistance in preparation of this thesis.
CONTENTS Page APPROVAL ... ii ABSTRACT ... iv ÖZET... vi ACKNOWLEDGMENT ... viii CONTENTS ... ix LIST OF FIGURES ... xi
LIST OF TABLES ... xii
CHAPTER 1 ... 1
INTRODUCTION ... 1
1.1. ENERGY RESOURCES ... 2
1.2. RENEWABLE ENERGY SOURCES ... 3
1.2.1. The Objective of Study ... 6
CHAPTER 2 ... 7
LITERATURE REVIEW... 7
2.1. SOLAR RADIATION ... 7
2.2. SOLAR RADIATION IN LIBYA ... 8
2.3. SOLAR POWERED SYSTEMS ... 9
2.3.1. Grid-Connected PVModel (GPV) ... 10
2.3.2. Stand-Alone PV Model(SPV)... 10
2.3.3. PV Elements ... 11
2.4. ANN APPLICATION ... 12
2.5. ARTIFICIAL NEURAL NETWORK APPLICATION IN SOLAR RADIATION ... 14
2.6. ANN IN MATLAB ... 20
Page
CHAPTER 3 ... 23
MATERIALS AND METHODS ... 23
3.1. DATA COLLECTION ... 23
3.2. APPLYING THE ANN APPROACH ... 25
CHAPTER 4 ... 27
4.1. THE DEVELOPED ANN MODEL ... 27
CHAPTER 5 ... 34
CONCLUSION ... 34
REFERENCES ... 36
LIST OF FIGURES
Page
Figure 1.1. Renewable energy share of global energy in 2015 ... 2
Figure 2.1. Global Solar radiation components ... 8
Figure 2.2. The monthly solar radiation in different cities in Libya ... 9
Figure 2.3. Grid-connected photovoltaic system ... 10
Figure 2.4. Stand-alone structure ... 11
Figure 2.5. Basic principles of artificial net work ... 12
Figure 2.6. The schematic diagram for the network structure ... 14
Figure 2.7. General architecture of artificial neural network. ... 16
Figure 4.1. Neural network fitting tool. ... 27
Figure 4.2. Using the inputs and targets options in the select data. ... 28
Figure 4.3. Validation, test and training data sets. ... 28
Figure 4.4. Train network... 29
Figure 4.5. Choose number of hidden neurons. ... 30
Figure 4.6. Train the network to fit the inputs and target. ... 30
Figure 4.7. GUI of the training tool. ... 31
Figure 4.8. Regression plot. ... 32
LIST OF TABLES
Page Table 3.1. Average operating variables of the solar radiation in Libya
SYMBOLS AND ABBREVITIONS INDEX
CO2 : Carbon dioxide
BPA : Back Propagation Algorithm ANN : Artificial Neural Network GSR : Global solar radiat
CHAPTER 1
INTRODUCTION
The energy-hungry pace of present-day life is increasingly calling for newer sources to power its motion. For this purpose, sustainable alternatives top the agenda in all nations and, coupled with environmental concerns related to warming and carbon emissions, they are now regarded as replacement for otherwise more expensive fossil-based fuels. When it comes to atomic energy as an alternative, given its background and shady history of maintenance and disaster-prone nature, discussions are ongoing as to permanently remove this alternative from the list of options for energy production [1,2].
To sustain high living and economic standards anywhere in the world, power generation appears to stand out as a major requirement, while extensive research points to the fact that, worldwide, some two billions inhabitants lack a steady source of power [3]. Apart from this, the intention to continue with fossil-based fuel does not seem to have lost any momentum, either considering the cost of renewable energy production – a fact that makes humans face problems as:
Ozone layer depreciation;
Major weather pattern changes worldwide;
The expansion of the greenhouse effect upon added CO2 averages in the atmosphere and reflection of solar heat back to the earth;
Pollution that causes disruptions in life and health of all living forms; and Fluctuations in fuel commodity pricing and their impact on economies [4].
1.1. ENERGY RESOURCES
Power generation is carried out using one of the following sources in general:
Atomic energy: based on nuclear processes that end up producing heat, which in turn turns water to steam and, subsequently, turns the electricity-generating turbines. These reactions are fission (atomic splitting) and fusion (atomic merging), providing many benefits as they release no CO2 and can continue to generate electricity as a steady source. The downsides are, however, the likely chance of contamination upon accidents, whose impacts can last for hundreds of years and more.
Fossil-based energy: That is, generating electricity through burning natural sources that have carbon at their core, namely petroleum, coal, and natural gas. These cover a wide span of options, from highly combustibles of less C-H ratios – namely, methane – to liquids – namely, petroleum – to less combustibles such as anthracite coal, which is almost entirely carbon. This option, fossil-based material for energy, are quite convenient as they can burn and become CO2 and H2O while generating considerable levels of energy per unit mass. The downside, however, is – as referred to earlier – the emissions that lead to warming and, subsequently, environmental impacts [5].
Sustainable energy: For now gaining a lot of attention worldwide, this option is ideal to fight against global warming and replace other questionable sources that humans use today. Renewable energy in the years to come can account for energy production, as introduced in Figure 1.1 regarding previous years’ forecasts.
1.2. RENEWABLE ENERGY SOURCES
Sustainable or renewable energy, in itself, falls under certain categories:
Solar: Generally, two alternatives exist when it comes to the energy from the sun: concentrated solar power (CSP) and photovoltaic (PV) power. In the former case, often referred to as solar thermal power generation, standard heat-based systems are in place to change heat in the form of steam to power.; in the latter case, though, these panels do not directly employ heat from the sun, and they change it into a photovoltaic effect and generate a direct current [7]. Next, this DC power is changed to AC by means of adaptors for public use via the national networks. The PV option, in this sense, saves no heat for later use as they are devoid of the equipment for this purpose; yet, in case of CSP, the possibility to store thermal energy exists, paving the way for improved means within the sector to generate power and reduce intermittence – a problem often faced by PV systems. In short, the CSP alternative is best for extended and large-quantity power production [8]
Hydro-based: In accordance to the ratio of hydraulic energy obtained using the downward motion of water, its speed, position, or a combination of the two. The degree of angular shift from this falling motion and its impact on turbine blades causes a differential force that turns the turbine and generates electricity. Water as working fluidin this way is not used up and, as such, can be put to other applications later, while the resulting energy can run machines and/or be consumed in homes nationwide [9].
Geothermal: or heat created at the earth’s core and radiating to the surface, this form of energy is responsible for how warm or cold any matter on planet earth is. The heat in the crust comes from the time the earth got shaped and from the process known as radioactive decay. The respective gradient as the different heat levels in the core and on the surface is responsible for a steady flow of heat toward the surface. This alternative is economical, steady, renewable, and ecofriendly for use. Previous estimated by the International Geothermal Association (IGA) stated that, about 10,715 megawatts were in use in 24 nations, and that the figure would be further enhanced to 67,246 GWh in 2010 [10].
Biomass: This is the source for energy based on organic content, namely wood shavings, cut grass and certain plants such as sugarcane and corn to make fuel. It is sustainable as the original content can be regrown [11].
There are various types of biomass, as the term goes:
Wood and farming products: including cut tree trunks, shavings, chips and bark, all of which constitute a major portion of biomass and can produce power; Biodiesel: which is produced from vegetable, animal, or reprocessed oil and can
be used in vehicles, even boats and ships, often employed in combination with diesel to make it less harmful;
Solid disposed material: as garbage of which, one ton is capable of producing enough energy to equal 500 pounds of coal. Fifty percent of the generated energy, though, is fossil-based and from non-organic plastic material;
Bioethanol: with its base in alcohol, it can be produced upon fermentation of green material and used in cars, especially for improved performance; and, finally,
Landfill gas and biogas: in which case city runoff and farming disposals are placed within heated digesters for faster decomposition and generating gas along the way as fuel.
Oceans: At present, studies focus on how to make use of the oceans as an alternative to making electricity, given that they cover some ¾ of the earth’s surface. Ever-increasing interest in this field attempts to harness the potentials of oceans to a maximum level [12]. This attempt, naturally, calls for further examining other related alternatives as the energy from:
A- Waves; B- Tide water;
C- Salinity gradients; and D- Temperature gradients.
What characterizes ocean energy is its stable and forecastable nature, thus rendering it a better option for powering the new generations worldwide and up to a full scale without any need for other sources [13].
Wind: Finally, wind power can be harnessed to produce electricity as well by means of turbines that transform kinetic force to a mechanical one, and then on to electricity. Wind stems from sporadic heating patches of atmosphere by solar energy, landmarks, and earth’s motion around itself, all contributing to wind flow changes. Turbines can transform this force to power by spinning blades on a rotor, which turns a shaft and, subsequently, a power generator [14].
For now, there is more need for electricity and, with passing time, demand is expected to rise very soon and constantly. For this reason, alternative sources are likely to be favored as well for energy production. All this heightened demand worldwide for either industrial or urban energy production has put pressure on fossil resources and, by extension and consequence, significant impact on the surrounding environment , to the extent that governments are in search for better options, among them wind, biomass, sun, ocean and hydro energy as listed earlier.
To this end, the present study will target solar energy. The PV system, alone or joined to the network, finds its way into suburban and rural regions by transforming the photonic radiation from the sun into power. There are many areas of use for this alternative, such as for heating and cookingin some countries and for power supply in more advanced nations through the nationwide networks [6].
Sun-powered systems, obviously, experience different changes caused by radiationitself as a major factor, thereby making all data related to this concept as critical for planning a solar farm and producing electricity there. To elaborate, a PV panel’s output is subject to radiation, for which data can be collected using either weather forecast stations or satellite-provided information [7].
As is the case with Libya, the country has a lot of solar radiation given its geographical position and long hours of sunshine. What is more, the country is in search of other more environmentally friendly alternatives for producing electricity.
Against this backdrop, the present work is inspired by the global solar radiation and its measurement by means of ANN or artificial neural networking, which comprises smart neurons functioning like those in the human brain. Using ANN, one can set up the relationships between input(s) and output(s) (i.e., the target) and establish (non)linear formulas both between and among the nodes. In order to identify the input/output relationships, our networks will employ a feed-forward system based on BP or backpropagation algorithm in a MATLAB environment so as to forecast the worldwide solar radiation amounts in Tripoli, the capital of Libya.
1.2.1. The Objective of Study
The information regarding the global solar radiation (GSR), owing to its importance in measurements and predictions, is key when it comes to setting up solar energy system settings and planning.
To measure GSR using an ANN in the above-stated location (Tripoli, Libya), certain contributing and/or affecting local factors have to be taken into account. When these factors are applied as input and GSR as output, then an ANN is employed to predict the amount of solar radiation.
Five chapters are presented in this thesis. Chapter 1 explains some background on sustainable energy and the methods applied here. In Chapter 2, solar radiationis dealt with alongside some previous research and literature on the subject matter, its forecasting and related network applications. Chapter 3 describes and analyzes the ANN model proposed here, followed by Chapter 4, which introduces the outcomes and results of the model employed. Lastly, we will finish with Chapter 5 upon presenting the final conclusions and the prospect of future attempts.
CHAPTER 2
LITERATURE REVIEW
2.1. SOLAR RADIATION
As the level of strength of sunlight anywhere it is measured, radiation is the key parameter for sun energy farms and power systems. Also, how it is measured is in watts per square meter (W/m2), and it comprises photons entering a PV array and agitate the electrons. In this way, the energy from photons is written in the following way [4]:
(2.1)
where E represents photon energy, hthe Planck’s constant, c as the speed of light, and finally is wavelength.
Radiation is of three types as it enters the PV boards or panels: direct, diffuse, or albedo. In the first type, direct, solar radiation arrives straight, thus rendering it ideal for assessment upon the absence of other climatic interferences, like clouds. Diffused radiation, though, is spread around through molecules and clouds, which issues causes this radiation form quite effective in terms of forming atmosphere. The last type, albedo, comprises reflected beams from the earth surface of any landmark/object. The sum of all these three constitute global radiation (GR), as represented in Figure 2.1 [15].
To predict SR, two common ways are in use: standard and ANN or neural network-based. Conventionally speaking, this approach has been in use for many years, among its variations being time-series Autoregressive moving Average (ARMA). In the case
of ANNs, however, the techniques involve feed-forward network and radial basis functions [16].
Figure 2.1. Global solar radiation components [17].
2.2. SOLAR RADIATION IN LIBYA
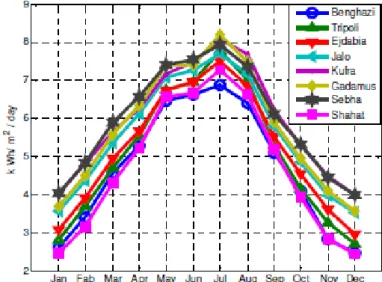
As the largest oil-producing nation in the African continent, Libya’s related exports accounts for a majority of its national income. Domestically, many sectors also rely on this resource, among them power companies employing gas and fuel to run their turbines. For now, the country can make up to 33 TWH for local markets, a figure that will rise owing to further expansion of infrastructure and other related sectors due to the events of the past few years and changes that went along with them. The result will be reduced revenue and simply more CO2 emissions, both of which outcomes urge authorities to opt for new and more sustainable resources to generate electricity. In this respect, the country enjoys a favorable geographical location in terms of SR, not to mention the extended shoreline that invites wind energyinvestments [18].
Despite sustainable energy use in the country dating back to the 1970s, their application remains on a small scale, such as communication repeaters, rural consumption, water pumps and cathodic protection on desert-based oil pipes. All these call for new investments in the sustainable popwer generation sector in Libya; in this regard, certain initiatives are related to sun-powered plants as an ideal option. To back
up this notion, the medium SR in the country hovers about 7.5 kWh/m2/day and almost 3000 to 3500 sunshine hours annually [18] – a quite promising figure for the above purposes.
Figure 2.2 shows SR values and their peak in summertime, with the top load up significantly between June and October. At this period, air conditioning in the country is in high use. Load demand again achieves a peak in cold season between December and February. With respect to these two factors, SR and load demand, the variations have been examined to reveal effective peak load shaving by means of the energy produced from the sun [18] .
Figure 2.2. The monthly solar radiation in different cities in Libya [18].
2.3. SOLAR POWERED SYSTEMS
PV panels are intended for directly transforming the sun energy to electrical energy. On average, a PV array cell generates 0.5 v, and two PV connections are possible in solar systems: grid-connected and stand-alone [19], explained in detail in what follows.
2.3.1. Grid-Connected PVModel (GPV)
As per Figure 2.3, a GPV system comprises an important section called the inverter, which transforms the DC electricity to an AC flow. Here, both grid and PV work alongside each other; that is, load demand is met using the sun energy throughout the day, to be replaced by the grid to supply during nighttime [19].
Figure 2.3. Grid-connected photovoltaic system [20].
2.3.2. Stand-Alone PV Model(SPV)
The SPV model is more applied in less urban regions and includes PV cells, batteries and transformers, all bearing the disadvantage of inefficiency at nighttime. To tackle this problem, alternatively certain components can be put into a hybrid model, for example diesel generation or wind, to compensate for such a disadvantage. Figure 2.4 shows an SPV model [19,15].
Figure 2.4. Stand-alone structure [21].
2.3.3. PV Elements
PVs comprise certain parts to supply electricity, these are:
Inverter: This device transforms the DC electricity generated on panels into AC, with the transmission in between the PV and the network to remain at constant voltage, phase and frequency values [19].
Charge Controller: This component decides on the type of current coming from the panels to prevent surplus charge to the batteries as well as possible discharge between the battery and the load [19].
Battery: SPV models use storage facilities as batteries in order to supply power, especially during the nighttime when no solar power can be transformed by the system [19].
Digital Meter: A digital meter serves to mark how much voltage is being sent across to the network, while preventing possible overloads upon calculating the inverter’s function [19].
2.4. ANN APPLICATION
Neural networks consist of simple elements working alongside each other and in accordance to how brain and nerves operate. In the same way, the network and its operations are set up in advance and predominantly by means of joints established between and among the various components. ANNs are, in this way, trainable for any assigned job once the related figures and values are set for the connections in the form of weights among the components. As a whole, ANNs can be adapted and developed in a way that, for instance, a given input brings about a favored output.
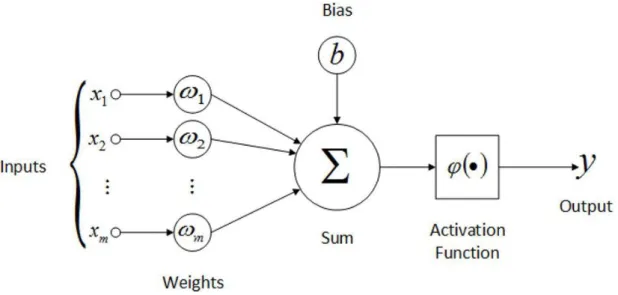
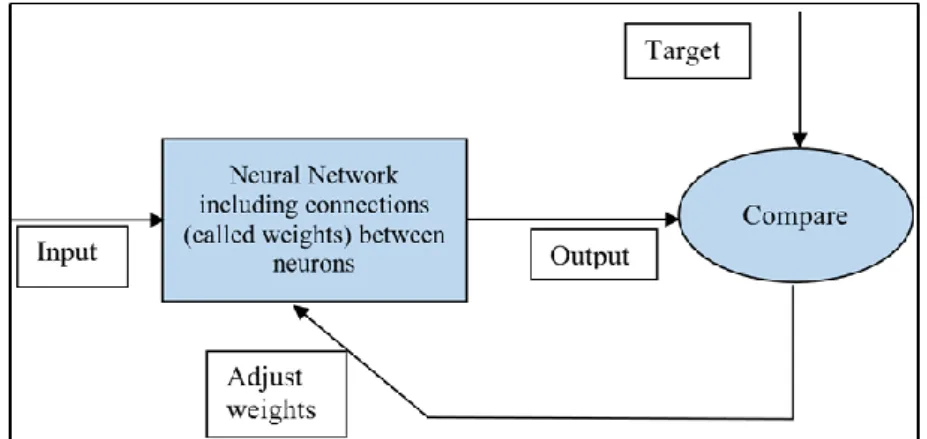
Figure 2.5 illustrates how an ANN can be adapted based on input/output contrasts and the anticipated result, all the way until the output equals those expected results. Numerous pairs of input/target can be arranged for any given target; this, obviously, calls for batch training by means of weight and bias variations based on a whole set or batch of input vectors. These weights and biases may be altered if necessary by introducing the inputs one by one – a process known as online or adaptive training. ANNs can be developed for a large array of disciplines and purposes, namely to recognize patterns, identify, and group in certain categories as speech, vision, and control systems. In this way, they have proved to be effective in dealing with issues that are otherwise challenging for human processing or by standard computer systems [22].
The feed forward ANN, as an alternative system, comprises neurons in the form of layers that appear as input, output, and one between them as a hidden layer. These layers contain neurons all joined by the upcoming layers through weights (w), which can be modified for system training. A data pattern with the values xi at the input layer i is moved forward in the model toward the initial hidden layer j, where the neurons inherit the weighted outputs from those in the layer before. For a net figure to be achieved, all of these values are added together which, later, is used as an output value upon activation [23].
With the so-called 'black box' nature of non-parametric simulations like ANNs, the set parameters have not yield toward any physical parameters; this is a problem that always impedes proper interpretation [22]. Additionally, ANNs have the benefit of plain relevance between the input and output variables. Despite these benefits, as regards solar radiation (SR), not much – if any, in fact – data is at hand concerning the effect of different parameters on the system. To this end, there is more attention on adopting a statistical view toward prediction of the effects that certain factors can have on meteorological settings for an ANN simulation in this field.
As stated earlier, an ANN has three layers. The neurons at the input layerare x1, x2... xn; at the hidden layer, h1, h2... hn; and at the output layer, O1, O2....On. The model underwent a significant transformation upon introducing back-propagation (BP) learning, which revitalized all experts’ curiosities toward proliferating the model into various other applications. The BP algorithm can be applied in multilayer feed-forward networks with elements of both continuous and differentiable activation. These, together with the BP algorithm, are called BP networks which, upon having a series of training tools for input-output pairs, can change the weights and group the inputs patterns in a most precise manner. This weight modification is rooted in the gradient descent method, which is often applied in basic perceptrons and differentiable neurons. The BP method takes on two data flow steps concerning any input-output pair: initially, the input model is repeated from the input layer toward the output layer and, thanks to the forward motion of the data, it can produce real outputs. Later, the error signals from the difference between the output model and the real output are back-propagated from the output layer to the one before in order to update the weights [23].
Figure 2.6. The schematic diagram for the network structure [23].
2.5. ARTIFICIAL NEURAL NETWORK APPLICATION IN SOLAR RADIATION
Kalogirou (2013) [24] states that planet earth is mainly energized by SR to stand for up to 99.97 percent of the heat energy. This heat is used up in the form of various chemical and physical processes in the atmosphere, water, and on the ground. SR represents a major source of green energy; Yadav and Chandel (2014) [25] postulate that GSR remains key in meteorological forecasts and green energy production, especially as regards SPV panels. Additionally, Chen, Duan, Cai, and Liu (2011) [26] conducted an SR test to see how much virtual energy is required to heat water, carry out agricultural activities, and dry wood panels by means of PV and heat load measurement in buildings, on atmospheric energy balance and climate forecasts. Benghanem (2012) [27] looks into major prediction techniques to assess average GSR over extended periods. Accordingly, these assessments are found to be possible only in specific places because of economic and professional constraints. It is added that one more method can be empirical correlations made in the data at specific points using whatever assessment equipment can be obtained.
Many such techniques have by far been used to measure the GSR values using meteorological parameters as average temperature, sunshine durations, average humidity, latitude and longitude. Besharat, Dehghan, and Faghih (2013) [28], to this end, offer an overview related to various GSR assessment techniques issued
throughout the literature concerning four main groups: sunshine periods, cloud, temperature, and other weather factors as inputs in the model. This data was used in the Iranian city of Yazd, with the outcomes that the El-Metwally sunshine-based models proved to be the best alternative for the related measurements. Quansah et al. (2014) [29] proposed a sunshine hour-based empirical model along with an air temperature-based model to measure GSR in Ashanti, Ghana. They applied seven simulations using the Angstrom–Prescott approach as well as the Hargreaves–Samani technique, the latter being dismissed upon the obtained outcomes due to imprecision for the period of April–June and October–November, as well as upon overestimating the values in August, September and December. Owing to geographical limits, the GSR figures are regarded as conflicting, not to mention the suggested techniques being inappropriate for accurate calculations in the long term. This observation has, thus, led many experts to employ more than one technique for their assessments, taking into account, for instance, climate parameters, too.
Yacef, Benghanem, and Mellit (2012) [30]. The work by Fadare (2009) [31] is an attempt to develop an ANN to forecast GSR values in Nigeria; the outcomes provide a correlation coefficient at 90 percent accuracy by the model. In Solmaz and Ozgoren (2012) [32], onecan see an ANN to predict SR hourly at 6 different provinces in Turkey, with the results offering a quick method for prediction. Also, Sözen, Arcaklioglu, Ozalp, andKanit (2004) [33] came up with another ANN simulation for SR prediction in Turkey as well, yielding satisfactory training methods and data as opposed to alternative regression models previously used for this purpose. A different model to measure average daily GSR values was offered in Chinaby Jiang (2009) [34], who achieved more satisfactory outcomes in contrast to other regression-based techniques. Pandey and Katiyar (2013) [35] discuss green power production and its future as regards SR measurement techniques in order to improve the yield from this source.
ANN-based simulations have found their way into various applications, including predictions, curve fittings and regression. In the present work, we also make use of ANN to develop a solar radiation prediction technique. ANNs conventionally have a central unit of neurons, with each input being repeated using a weight functioning as
a bond to join it to a neuron as well as its countless layers. In the end, the neurons are transferred to yield the expected result. Figure 2.7 depicts a general picture of the proposed ANN model having the advantage of no need for complex computations related to parameters and only requiring basic processing to achieve satisfactory results for problems involving numerous variables.
Figure 2.7. General architecture of artificial neural network.
Trnka et al. [36] also applied the same approach to predict SR in Spain based on sunshine duration as the input; despite the advantage of Angstrom-Prescott equationin their work, however, not adequate proximity was obtained in the outcomes against the actual figures. In the same way, Bahel et al. [37] devise a simulation based on sunshine duration in hours for input. The models proposed by Bristow and Campbell [38], Allen [39] and Hargreaves [40] all related the temperature factor with SR, with the conclusion that the basic simulations are ideal for approximate measurements and not for accurate and precise ones and worthy of professional testing and application. The simulation proposed by Wu [41] applies top temperature and precipitation figures for input. in the same way, Chen’s model [42] applies sunshine hours and top temperature for input, offering improved outcomes compared to previously released research on the topic using the same method. It has to be stated, though, that not much accuracy was achieved in that work to qualify it as a definitive approach.
In all, it has to be remembered that certain simulations can be obscured upon the occurrence of irregularities, which can definitely add to forecasting uncertainties. The above-stated methods almost entirely lack in sufficient accuracy and robustness of approach to address non-linearity, as is the case with SR, thereby rendering them inapplicable to obtain ideal results [43]. Some even employ irradiance data from satellites [44], whose geostationary measurements are useful given the extensive regions they cover; nonetheless, handling the related data has so far proved to offer not-so-accurate figures when compared to surface-based estimates.
In this respect, Polo et al. [45] made use of the Meteosat satellite pictures to assess SR values in India, also confirming similar conclusions as the previously-stated attempt. It is noteworthy that for such satellite information, the Kriging approach is known to be in use at most. To predict precipitation (Buytaert et al.) [46] and temperature (Zhao Chuanyan et al.) [47], this approach proved to be effective as opposed to deterministic interpolation. Back to SR assessment, Rehman and Ghori [48] also employed the approach in Saudi Arabia; later followed by Erickin and Eyrendilek (2007) [49] who applied universal Kriging to measure daily GSR values in Turkey. The overall outcome from these attempts puts this method ahead of others in accuracy to forecast the spatial variability related GSR; however, more definitive methods are believed to be a possibility for future use, the reason being the exceeding values of the Root Mean Squared Error (RMSE) along with highly unpredictable coefficient of determination (R2). What may justify these irregularities may be that the Kriging method is of a multiple linear regression nature, rendering it as such ineffective in covering non-linearity for GSR assessment.
Stochastic approaches, too, have been the focus of some studies to address non-linearity in this respect upon improved adaptability in the course of forecasting. For this goal, despite a definitive location being recognized by the method, the processis able to develop upon numerous alternative paths, in this way improving reliability of the predicted surface by dealing with unknown values in accordance to spatial auto-correlation among data points, as well as by using analysis and statistics at the same time (Burrough and McDonnell) [50]. Bechini et al. [51] employed such an approach, namely Campbell-Donatelli, for SR forecasting in Italy. Another attempt was made by
Meza and Varas [52] to determine the temperature changes for SR predictions; both these works highlight the stochastic method as an effective means to obtain the desired average SR figures.
Concerning the ANN use in the field of GSR assessment, it has to be acknowledged that to make these models in a satisfactory way calls for a series of inputs – namely, latitude, longitude, altitude, sunshine hours, humidity, maximum temperature, and others – apart from a satisfactory number of neurons and robust transfer function in order to develop the model [53]. To this end, Gupta and Kewalaramani [54] forecast the compressive strength of concrete by means of regression analysis and ANN, in the end comparing the outcomes, which showed ANN’s superlative advantage as regards random datasets. Elizondo et al. [55] applies ANN to assess SR in America, which attempt proved to be successful. In the same way, Al-Alawi & Al-Hinai [56] and Mohandes et al. [57] employed ANN for SR prediction in Oman and Saudi Arabia respectively; though preliminary in their nature, both attempts confirmed the method’s effectiveness for later application. Adnan et al. [58], Mubiru & Banda [59] and Fadare [60] make use of ANN as well for SR forecasting in Turkey, Uganda and Nigeria respectively, with the outcomes compared to real data and yielding a close proximity. Three approaches were employed by Moreno et al. [61]: Bristow-Campbell, ANN, and Kernel Ridge Regression, and compared them all; there, ANN stood out once again as a better alternative. Ali Rahimikhoob [62] also surveys the semi-arid regions of Iran by means of ANN, obtaining better prediction of GSR values using the ANN approach as opposed to the Hargreaves and Samani equation (HS). ANN has been put to application in Tamil Nadu in India as well by Sivamadhavi and Selvaraj [63], who employ data from three meteorological centers with satisfactory results. Krishnaiah et al. [64] also applies the method in acrossIndia, once again confirming accurate results. All of these attempts show the ANN method to be a good measure for SR forecasting; though it has to be stated that no other input parameters, like relative humidity, had been employed there. Hasni et al. [65], in this regard, used an ANN based on air temperature and relative humidity for SR assessment southwest Algeria, later comparing the outcomes with real data and proving very close proximity in between them and hence, confirming relative humidity as a possible input parameter.
Additionally, the combination of different inputs has never been tried previously in this field. For this reason, the present work is intended to determine the ability of ANN to forecast GSR values accurately despite the absence of sufficient data as the input parameters. Henceforth, aside from relative humidity, we will employ a number of other determinants as input to develop a function; mainly with weather and geographical data as the input and GSR as the output. Multi-layered feed forward neural network with the BP and the Levenberg-Manquardt methods are then applied to serve as the learning algorithms to train the model.
ANN and time series are applied by Wang et al. (2011) [66] to predict SR (solar Radiation)for a limited time period. Dispersed radiation, temperature, relative humidity and time in that work served as inputs variables, with a dual hidden layer employed using double transfer functions, tang-sigmoid and log-sigmoid. According to the outcomes, SI values were predicted closely enough; particularly, considering the coefficient determination at 99.12% and the root mean square at 0. 0331. The study by Mubiru et al. (2007) [67] applies ANN for average daily GSR value predictions over a short term (1 month) in Uganda by employing BP, 15 neurons and a single hidden layer. Theinputs in that work comprised sunshine duration, cloud periods, top temperature, longitude, latitude and altitude, all yielding a root mean square error of 38.5%. Dorovlo et al. (2002) [68] develop two simulations, one with Radial Basis Function (RBF) and the other with Multilayer Perceptron (MLP), to forecast SR in Oman over 8 separate regions and also to obtain a clearness index and SR. Accordingly, RBF is shown to outperform MLP as per time saving. Mellti et al. (2010) [69] looks into the Multilayer Perceptron (MLP) technique employed in ANN to forecast daily SIin Italy, using inputs as mean daily SI and the mean daily air temperature. In this sense, the authors state that one input and two hidden layers were the best way to make the model effective, with the correlation coefficient for a sunny day at 98-99%, and at 94-95% for cloudy days. Mellit et al. (2005) [70] attempt to predict SR based on a Radial Basis Function network with inputs as air temperature and sunshine duration. The study reveals the disadvantage of excessive time to be spent using this approach, perhaps due to insufficient data. As a remedy, the study proposes to employ a quick algorithm – for example, BP – to deal with this issue. The study by Angela et al. (2011) [71] predicts 24h GSR averages over a month based on ANN for
the city of Kampala. The tangent sigmoid transfer function is also applied in this work along with a single hidden layer and 65 neurons, the root mean square value of error yielding 0.521 MJ/m3 and the correlation coefficient (R2) at 0.965. With these figures, the study was considered applicable, though not accurate enough owing to the hours of daily sunshine as the only input. Deng et al. (2010) [72] take advantage of a feed-forward ANN with BP to forecast daily GSR in China, using three hidden layers and the Levenberg-Marquardt algorithm, and weather/geographical data as input. The study concludes that sunshine hours, geographical factors, and time of the year are the key inputs for its simulations, which provided 1.915 MJ/m2 as the root mean square error and 0.932 correlation of determination (R2). Rehman et al. (2007) [73], for their model, employ training data from 1998 to 2001 and testing data from 2001 to 2002. Their inputs included air temperature and relative humidity, and the output GSR; upon these, three separate simulations were offered, using inputs as follows: one applying the day of the year and the daily maximum air temperature, one,day of the year and daily mean air temperature, and finally another one, day of the year with daily mean air temperature and relative humidity. The mean absolute percentage errors in the three cases stood at 10.3%, 11.8% and 4.49, respectively, thus rendering the third attempt as the most successful in performance. The work by Ghanbrazadeh et al. (2009) [74] applies a mixture of weather data for input to measure SR values, with sunshine duration, average of daily temperature, and humidity as inputs providing the best results as follows: 0.00405433 for the root mean square error and 8.84% for the absolute mean percentage of error. Finally, Rani et al. (2012) [75] devise a simulation that works well with temperature, humidity, month and day as input variables. Their work separates the data as two subsets: for training and for testing; while the root mean square error (RMSE) and mean absolute percentage error (MAPE) stood at 0.9429 and 9.1754%, respectively. In conclusion – and, perhaps, as expected - lower accuracy was observed with the date and the month set as inputs.
2.6. ANN IN MATLAB
MATLAB offers algorithms, functions, and other applications for developing, training, visualizing, and simulating ANNs upon regression, pattern recognition,
identification, grouping, clustering, deep learning, and sequencing on top of the ANN features themselves [76]. There are seven steps in the ANN design:
Data gathering;
Network development; Network configuration;
Weight and Bias initialization; Network training;
Network validation; and finally Network Application.
These steps can often be performed automatically owing to the presence of default weights and configurations. Still, one has the benefit of changing the values if and when deemed necessary. Four steps are available in this tool, with the first being based on GUI, which grants quick access to various function fitting options, pattern recognition, classification, sequencing. The code, apart from these, can be designed with utmost intricate detail as needed to model any setting for network analyses.
At the secondary stage, basic command operations are used for basic hypotheses and arguments that go along intelligent defaults as parameters, all of which – needless to say – may be done without for added efficiency. Step three deals with adjustments for advanced and specifically-made ANNs to keep maximum efficiency. Lastly, any code file may be changed upon computations in the final stage within MATLAB.
2.7. REGRESSION ANN IN MATLAB
Regression ANN can be achieved by means of the command line options [77]i mainly comprising two GUIs to srt up and train the model, as in [78,79]:
Neural Network tool (nntool) is the main attribute that allows full monitoring of the model with whcih any ANN can be designed, regression-based or not. Neural Fitting tool (nftool) that helps users in solving their fitting problems in
scale conjugate gradient BP as an alternative. In this way, various configurations are possible with MATLAB-supplied data or sample sets. Upon the completion of the training, performance is tested using mean squared error and regression methods, followed by another assessment of the results upon visualization – namely, regression fits or error his-tograms. The whole model can, inthe end, be tried for network efficiency with the the test option provided in the toolbox.
CHAPTER 3
MATERIALS AND METHODS
ANN is kin to the learning process in the human brain, with neurons as the prime features of repetitive layers as input, then a hidden layer and an output layer. As a result, the network is modeled within noisy or partial data [80]; in other cases, such data will be too detailed for algorithm formulation in accordance to the dataset. ANN learns upon pattern recognition and simulation as certain tasks may not be programmable in any form. Within real scenarios, the system comprises random numericalinformation with algorithms, not to mention back propagation (BP) which serves as a standard tool for error minimization between the output and expected results upon weight assignment. This work, as previously stated, makes use of an ANN to predict SR values in, Tripoli, Libya – for which task, a feed forward NN is modeled with BP in a MATLAB environment [81,82]. Input and output features, as such, are selected to be the monthly average values.
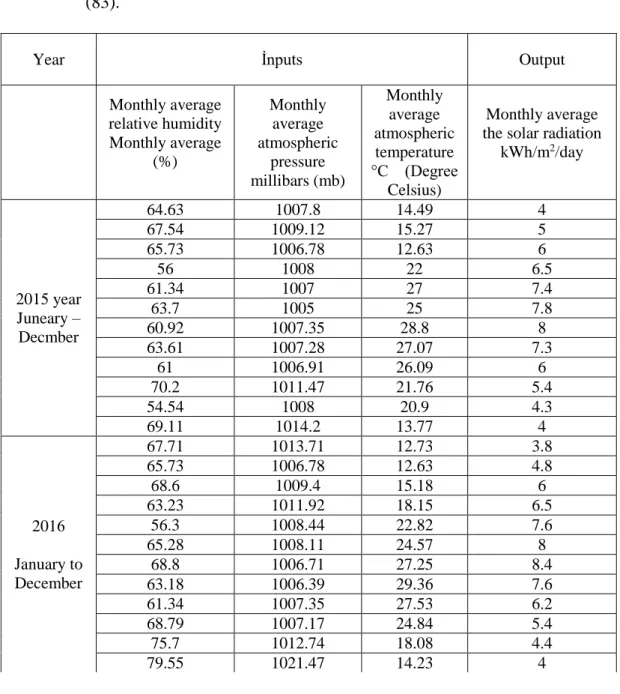
3.1. DATA COLLECTION
The learning methods proposed here are studied for four years of limited data with the LM method. In detail, a computational-intelligence design with LM and BP algorithms are used for training to predict SR in the short term; ANN is capable of handling errors or absence of data since it can generalize the attributes when needed, making it convenient for our purpose. Obviously, though, premium learning data will produce premium and more accurate resultsin turn, for which reason all input and output data is thoroughly examined and organized prior to application as parameters.
The SR values that appear anywhere depend on landmarks, topography and other attributes. In this sense, Tripoliis subject to major fluctuations in these values within a year. To supply data, we use the monthly weather information from the Libyan State
Meteorological Service [83] for 2015 to 2018 at Tripoli. See Table 1.3 [83]. The data is checked numerically for the mean values between January and December for each year and total average.
The input parameters are the monthly average relative humidity, monthly average atmospheric pressure, and monthly average atmospheric temperature; as for the output, that will be the monthly average SR values for the location. In this vein, monthly weather data for the above period is fed to the system.Table 4.1 represents SR parameters for the city of Tripoli, Libya.
Table 3.1. Average operating variables of the solar radiation in Libya (2015-2018) (83).
Year İnputs Output
Monthly average relative humidity Monthly average (%) Monthly average atmospheric pressure millibars (mb) Monthly average atmospheric temperature °C (Degree Celsius) Monthly average the solar radiation
kWh/m2/day 2015 year Juneary – Decmber 64.63 1007.8 14.49 4 67.54 1009.12 15.27 5 65.73 1006.78 12.63 6 56 1008 22 6.5 61.34 1007 27 7.4 63.7 1005 25 7.8 60.92 1007.35 28.8 8 63.61 1007.28 27.07 7.3 61 1006.91 26.09 6 70.2 1011.47 21.76 5.4 54.54 1008 20.9 4.3 69.11 1014.2 13.77 4 2016 January to December 67.71 1013.71 12.73 3.8 65.73 1006.78 12.63 4.8 68.6 1009.4 15.18 6 63.23 1011.92 18.15 6.5 56.3 1008.44 22.82 7.6 65.28 1008.11 24.57 8 68.8 1006.71 27.25 8.4 63.18 1006.39 29.36 7.6 61.34 1007.35 27.53 6.2 68.79 1007.17 24.84 5.4 75.7 1012.74 18.08 4.4 79.55 1021.47 14.23 4
Table 3.1. (Continued). 2017 January to December 58.6 1012 14.72 4.3 66.1 1012.2 15.3 5 57.9 1007.27 16.59 6 57.7 1004.9 21.8 7 57.2 1006.9 23.55 7.4 59.8 1006.6 26.4 8 62 1007.5 27.9 8.5 63.2 1008.01 27.4 7.5 63.61 1007.28 27.07 6 62.4 1007.3 26.54 5.4 59.13 1009.8 20.13 4.3 69.7 1015.4 15.19 4 2018 january to december 68 1011.7 11 4.3 62.3 1013.5 15.1 5.7 71 1010.2 16.1 6.3 67.5 1008.5 18.2 7 63.1 1008.6 23.1 7.5 61 1006.91 26.09 7.8 56.6 1007.4 28.3 8 60.92 1007.35 28.8 7 59.7 1008.08 27.23 6 70.2 1011.47 21.76 5.4 63.96 1010.05 17.4 4.3 69.11 1014.2 13.77 4
3.2. APPLYING THE ANN APPROACH
Using the nftool [22]:
Select “Fitting Tool” and the related nftool option;
Select the “Inputs and Targets” in “Select Data” by uploading the data from MATLAB;
Choose “Validation and Test Data”, where the sets comprise 15% of the main bulk. Later, the input as well as the output vectors may be divided at random to comprise the following three categories:
70% to train;
15% to validate after generalizing and stopping the process before training so as not to over-fit; and
Select “Next”. Here, a standard ANN is ready for fitting in the form of a double-layer feed forward network with a sigmoid transfer option at the hidden double-layer and a linear one in the output layer. The number of defaults in the hidden neurons is set as 10, which may be enhanced later in case training is not satisfactory enough in the initial trial.
Select “Train”.
This begins the training, which will continue until validation errors can no longer function after six repeated turns.
In “Plots”, choose “Regression” to validate the network. These plots show the output sets for training, validation, and testing objectives. For maximum fitting, the datasetneeds to overlap at a 45-degree line as the position where the outputs conform with the set objectives. For the purposes of the present study, the fitness values are acceptable as regards all datasets since R reaches more than 0.93; yet, for added accuracy, more training is to be carried out as a matter of course. This can be easily accomplished upon choosing the option “Retrain”, after which the initial figures and biases are modified for potentially improved network accuracy.
CHAPTER 4
RESULTS AND DISCUSSION
4.1. THE DEVELOPED ANN MODEL
Applying, training and testing the developed ANN calls for MATLAB’s nftool utility and a simple feed forward network that comprises a set of neurons in a single hidden layer trained with the LM method in the following sequence:
Select ‘Fitting Tool’ and the ‘Neural Network Fitting Tool’ with the command ‘nftool’;
Select ‘Next’ to proceed to ‘Use the Inputs and Targets’ choice from the ‘Select Data’ and adding data from the MATLAB environment;
Figure 4.2. Using the inputs and targets options in the select data.
Select ‘Next’ for access to the ‘Validation and Test Data’ option, where they are adjusted to 15% of the main data;
Upon the above procedure, the input and target vectors become randomly grouped in three:
1) 70% to train the model;
2) 15% to validate generalization and proceed with training until overfitting; and Another 15% to separately test the generalization.
Figure 4.4. Train network.
Select ‘Next’ A general approach to function fitting is to have a two-layer feed forward set with a sigmoid transfer function in the hidden layer and a linear transfer function in the output layer. The default number of hidden neurons is adjusted to 10 and, in case of low training performance, this figure can be adjusted – that is, increased.
Figure 4.5. Choose number of hidden neurons.
Select ‘Next’ to access the LM algorithm for training in the fastest time – as LM is commonly used for medium-size datasets and, thus its application in the present work. Training continues until no more validation can be reduced. Then validation stops at this point.
Training continues until no more validation can be reduced. Then validation stops at this point.It can be seen that the validation error failed to decrease for six iterations (validation stop).
Figure 4.7. GUI of the training tool.
In ‘Plots’, choose ‘Regression’ to validate performance.
The network outputs appear in the following for training, validation, and testing as per the set targets. For thorough fitting, the data needs to lie against a 45-degree line, as tasted before, to achieve conforming outputs and targets. This fitting for the present study is at an acceptable level, with R values beyond0. 93 . To further the accuracy levels, obviously, retraining is possible via ‘Retrain’ in nftool, thereby changing the previous weights and biases as deemed fit.
Figure 4.8. Regression plot.
Select ‘Performance’ from the training window for a diagram of training, validation, and test errors, as in the following.
The results obtained for this study are acceptable considering the following notes:
The ultimate mean-square error is quite insignificant;
The test set error and the validation set error are rather similar; and
There is no substantial overfitting occurs by round 28 epoch at which the maximum validation performance is achieved.
CHAPTER 5
CONCLUSION
Artificial neural networks (ANN) are a useful option when it comes to analyzing sensor data, detecting faults, setting up performance and reviewing related processes. For its key feature, the present work makes use of ANN modeling to forecast solar radiation in the city of Tripoli in Libya. The simulation is satisfactory and, hence, applicable to solar energy systems (SES), with the main advantage owed to the fact that the research makes use of arbitrary and nonlinear factors.
With economizing, SES enhancing, and improving electricity production in mind, the proposed ANN compares the output with the set targets based on weather data obtained from the Libyan State Meteorological Center. The trial-and-error method using MATLAB neural network fitting tool (nftool) helped to determine the best arrangement of functions to achieve the objective herein.
The weather data containing various variablesis used to come up with a novel approach to determine SR with the highest possible precision. The approach is feed-forward back propagation (BP)-based the function of a tangent sigmoid transfer (tansig) between the input and the hidden layer with a range of neurons within one hidden layer and function of a linear transfer (purelin) at the output node, all employed in MATLAB’s neural network fitting tool (nftool).
The Levenberg-Marquardt (LM) algorithm was put to the test with a set of neurons after comparing the predicted figures with actual data from the Center using mean square error (mse) and coefficient of determination (R). The most applicable ANN model was then chosen with LM and ten neurons to forecast SR which yielded promising results with insignificant MSE and R2 above 0.93.
To conclude, the suggested approach and ANN model is applicable for SR forecasting and, therefore, a step forward in improving SES-based energy production. Obviously, it goes without saying that certain theoretical architectures based on ANN continue to play a key role in determining the best simulations for yet improved results in the future.
REFERENCES
1. Svensson, Morgan., "Short-term wind power forecasting using artificial neural networks", (2015).
2. Tastu, Julija., "Short-term wind power forecasting: probabilistic and space-time aspects", (2013).
3. Wilberforce, T., Alaswad, A., Palumbo, A., Dassisti, M. and Olabi, A. G., “Advances in stationary and portable fuel cell applications”, International
Journal of Hydrogen Energy, 41(37):16509-16522 (2016).
4. Wilberforce, T., FN khatib, O. Emmanuel, O. Ijeaodola, A. Abdulrahman, Ahmed al Makky A. Baroutaji, AG Olabi. “Experimental study of operational parameters on the performance of pemfcs in dead end mode”, Proceedings of SEEP, 27-30 (2017).
5. Bauen, Ausilio., "Future energy sources and systems—acting on climate change and energy security", Journal of Power Sources, 157(2 ): 893-901(2006). 6. Kumar, A. and T.C. Kandpal., “Potential and cost of CO2 emissions mitigation
by using solar photovoltaic pumps in India”, International Journal of
Sustainable Energy, 26(3): 159-166 (2007).
7. Ummel, K. andWheeler, D., “Desert power: the economics of solar thermal electricity for Europe, North Africa, and the Middle East”, Center for Global
Development Working Paper,156 (2008).
8. Boyle, G., “Renewable energy: power for a sustainable future”, Oxford
University Press, (1996).
9. Kosnik, L., “The potential for small scale hydropower development in the US”,
Energy Policy, 38(10): 5512-5519(2010).
10. Barbier, E.,“Geothermal energy technology and current status: an overview”,
Renewable and sustainable energy reviews, 6(1-2):3-65 (2002).
11. Kralova, I. and Sjöblom, J., “Biofuels–renewable energy sources: a review”,
Journal of Dispersion Science and Technology, 31(3): 409-425 (2010).
12. Wright, G., “Marine governance in an industrialised ocean: a case study of the emerging marine renewable energy industry”, Marine Policy, 52: 77-84 (2015).
13. Kerr, S., Colton, J., Johnson, K. and Wright, G., “ Rights and ownership in sea country: implications of marine renewable energy for indigenous and local communities”, Marine Policy,52:108-115 (5105).
14. Al-Majed, S.I. and T. Fujigaki., “Wind power generation: An overview”, Modern
Electric Power Systems, 1-6 (2010).
15. Roger, M. and Jerry, Ventre., “Photovoltaic systems engineering”, CRC Press (2004).
16. Aguilera, J., Almonacid, F., Nofuentes, G. and Hontoria, P. Z. L., "Artificial neural networks applied in pv system and solar radiation", Artificial Intelligence
in Energy and Renewable,1-38 (2006).
17. (1998, Apr) sun. [Online].
http://www.enviro-friendly.com/Sun/Sun/image/irrad.gif https://dalspace.library.dal.ca/handle/10222/21401
18. Khalil, A. and A. Asheibe., “The chances and challenges for renewable energy in Libya”, The Proceedings of the Renewable Energy Conference, (2015).
19. Lynn, P.A., “Electricity from sunlight: an introduction to photovoltaics”, John
Wiley and Sons, (2011)
20. Pacific Sun Technology, “Types of Solar Systems”, http://pacificsuntech.com/how/types.html (2010)
21. Product List, http://www.made-in-china.com/showroom/levineagle/product-detailOqUQjNsYXArG/China-Stand-Alone-PV-System-ERSS-.html(2013 ) 22. Demuth, H., M. Beale, and M. Hagan., “Neural network toolbox user’s guide”,
The MathWorks Inc, (2001).
23. Imrie, C., S. Durucan. and A. Korre., “River flow prediction using artificial neural networks: generalization beyond the calibration range”, Journal of hydrology, 233(1-4): 138-153 (2000).
24. Kalogirou, S.A., “Artificial neural networks and genetic algorithms for the modeling, simulation, and performance prediction of solar energy systems”,
Assessment and simulation tools for sustainable energy systems, 225-245.
(2013).
25. Yadav, A.K. and S. Chandel., “Solar radiation prediction using Artificial Neural Network techniques: A review”, Renewable and sustainable energy reviews, 33: 772-781(2014).
26. Chen, C., Duan, S., Cai, T. and Liu, B., “Online 24-h solar power forecasting based on weather type classification using artificial neural network” Solar energy, 85(11): 2856-2870 (2011).
27. Benghanem, M., “Artificial intelligence techniques for prediction of solar radiation data: A review “, International Journal of Renewable Energy
Technology, 3(2): 189-220 (2012).
28. Besharat, F., A.A. Dehghan. and A.R. Faghih., “Empirical models for estimating global solar radiation: A review and case study” Renewable and Sustainable
Energy Reviews, 21: 798-821(2013).
29. Quansah, E., Amekudzi, L. K., Preko, K., Aryee, J., Boakye, O. R., Boli, D. and Salifu, M. R., “Empirical models for estimating global solar radiation over the Ashanti region of Ghana”, (2014).
30. Yacef, R., M. Benghanem, and A. Mellit., “Prediction of daily global solar irradiation data using Bayesian neural network: A comparative study” Renewable
energy, 48: 146-154 (2012).
31. Fadare, D., “Modelling of solar energy potential in Nigeria using an artificial neural network model”, Applied energy, 86(9): 1410-1422 (2009).
32. Solmaz, O. and M. Ozgoren., “Prediction of hourly solar radiation in six provinces in turkey by artificial neural networks” Journal of energy engineering, 138(4): 194-204 (2012).
33. Sözen, A., Arcaklioǧlu, E., Özalp, M. and Kanit, E. G., “Use of artificial neural networks for mapping of solar potential in Turkey”. Applied Energy, 77(3): 273-286(2004).
34. Jiang, Y., “Computation of monthly mean daily global solar radiation in China using artificial neural networks and comparison with other empirical models”,
Energy, 34(9): 1276-1283(2009).
35. Pandey, C. K. and Katiyar, A. K., “Solar radiation: Models and measurement techniques”, Journal of Energy, (2013).
36. Trnka, M., Žalud, Z., Eitzinger, J. and Dubrovský, M.,” Global solar radiation in Central European lowlands estimated by various empirical formulae”,
Agricultural and Forest Meteorology, 131(1-2):54-76(2005).
37. Bahel, V., H. Bakhsh, and R. Srinivasan., “A correlation for estimation of global solar radiation”, Energy, 12(2): 131-135.(1987).
38. Bristow, K.L. and G.S. Campbell., “On the relationship between incoming solar radiation and daily maximum and minimum temperature”, Agricultural and
forest meteorology, 31(2): 159-166(1984).
39. Allen, R.G.,“Self-calibrating method for estimating solar radiation from air temperature”,Journal of Hydrologic engineering, 2(2):56-67(1997).
40. Hargreaves, G.L., G.H. Hargreaves, and J.P. Riley, “Irrigation water requirements for Senegal River basin”, Journal of Irrigation and Drainage Engineering, 111(3): 265-275(1985).
41. Wu, G., Y. Liu, and T. Wang., “Methods and strategy for modeling daily global solar radiation with measured meteorological data–A case study in Nanchang station,China”, Energy conversion and management, 48(9): 2447-2452(2007). 42. Chen, R., Ersi, K., Yang, J., Lu, S., and Zhao, W., “Validation of five global
radiation models with measured daily data in China” Energy Conversion and
Management, 45(11-12): 1759-1769(2004).
43. Paulescu, M. and Z. Schlett., “Performance assessment of global solar irradiation models under Romanian climate”, Renewable energy, 29(5): 767-777 (2004) 44. Dagestad, K.-F., “Estimating global radiation at ground level from satellite
images”, 2005.
45. Polo, J.,” Solar radiation estimations over India using Meteosat satellite images”,
Solar Energy, 85(9): 2395-2406(2011).
46. Buytaert, W., “Human impact on the hydrology of the Andean páramos”,
Earth-Science Reviews, 79(1-2):53-72(2006).
47. Chuanyan, Z., N. Zhongren, and C. Guodong, “Methods for modelling of temporal and spatial distribution of air temperature at landscape scale in the southern Qilian mountains, China” Ecological Modelling, 189(1-2): 209-220 (2005).
48. Rehman, S. and S.G. Ghori., “Spatial estimation of global solar radiation using geostatistics”, Renewable Energy, 21(3-4): 583-605(2000).
49. Ertekin, C. and F. Evrendilek., “Spatio-temporal modeling of global solar radiation dynamics as a function of sunshine duration for Turkey”, Agricultural
and Forest Meteorology, 145(1-2): 36-47(2007).
50. Burrough, P.A.,”Principles of geographical information systems”, Oxford
university press(2015).
51. Bechini, L., “Modelling, interpolation and stochastic simulation in space and time of global solar radiation”, Agriculture, ecosystems & environment, 81(1): 29-42(2000)
52. Meza, F. and E. Varas, “Estimation of mean monthly solar global radiation as a function of temperature”,Agricultural and Forest Meteorology,100(2-3): 231-241(2000).
53. Mihalakakou, G., M. Santamouris, and D. Asimakopoulos., “The total solar radiation time series simulation in Athens, using neural networks”, Theoretical
![Figure 1.1. Renewable energy share of global energy in 2015 [6].](https://thumb-eu.123doks.com/thumbv2/9libnet/5403050.102103/16.892.314.657.936.1113/figure-renewable-energy-share-global-energy.webp)
![Figure 2.1. Global solar radiation components [17].](https://thumb-eu.123doks.com/thumbv2/9libnet/5403050.102103/22.892.227.732.236.495/figure-global-solar-radiation-components.webp)
![Figure 2.3. Grid-connected photovoltaic system [20].](https://thumb-eu.123doks.com/thumbv2/9libnet/5403050.102103/24.892.241.715.344.549/figure-grid-connected-photovoltaic-system.webp)
![Figure 2.4. Stand-alone structure [21].](https://thumb-eu.123doks.com/thumbv2/9libnet/5403050.102103/25.892.235.728.125.455/figure-stand-alone-structure.webp)
![Figure 2.6. The schematic diagram for the network structure [23].](https://thumb-eu.123doks.com/thumbv2/9libnet/5403050.102103/28.892.242.736.125.384/figure-schematic-diagram-network-structure.webp)