AN OPTIMIZED TEXT-INDEPENDENT SPEAKER
RECOGNITION SYSTEM USING FEED
FORWARD NEURAL NETWORK
SAEEDA MEFTAH SALEM ELTANASHI
2020
MASTER THESIS
COMPUTER ENGINEERING DEPARTMENT
Thesis Advisor
AN OPTIMIZED TEXT-INDEPENDENT SPEAKER RECOGNITION SYSTEM USING FEED FORWARD NEURAL NETWORK
Saeeda MEFTAH SALEM ELTANASHI
T.C.
Karabuk University Institute of Graduate Programs Department of Computer Engineering
Prepared as Master Thesis
Thesis Advisor
Assist. Prof. Dr. Ferhat ATASOY
KARABUK August 2020
I certify that in my opinion the thesis submitted by Saeeda MEFTAH SALEM ELTANASHI titled “AN OPTIMIZED TEXT-INDEPENDENT SPEAKER RECOGNITION SYSTEM USING FEED FORWARD NEURAL NETWORK” is fully adequate in scope and in quality as a thesis for the degree of Master of Science.
Assist. Prof. Dr. Ferhat ATASOY ... Thesis Advisor, Department of Computer Engineering
APPROVAL
This thesis is accepted by the examining committee with a unanimous vote in the Department of Computer Engineering as a Master of Science thesis. August 5, 2020
Examining Committee Members (Institutions) Signature
Chairman : Assoc. Prof. Dr. Turgut ÖZTÜRK (BTU) ...
Member : Assist. Prof. Dr. Ferhat ATASOY (KBU) ...
Member : Assist. Prof. Dr. Omar DAKKAK (KBU) ...
The degree of Master of Science by the thesis submitted is approved by the Administrative Board of the Institute of Graduate Programs, Karabuk University
Prof. Dr. Hasan SOLMAZ ... Director of the Institute of Graduate Programs
“I declare that all the information within this thesis has been gathered and presented in accordance with academic regulations and ethical principles and I have according to the requirements of these regulations and principles cited all those which do not originate in this work as well.”
ABSTRACT
M. Sc. Thesis
AN OPTIMIZED TEXT-INDEPENDENT SPEAKER RECOGNITION SYSTEM USING FEED FORWARD NEURAL NETWORK
SAEEDA MEFTAH SALEM ELTANASHI
Karabük University Institute of Graduate Programs Department of Computer Engineering
Thesis Advisor:
Assist. Prof. Dr. Ferhat ATASOY August 2020, 57 pages
Speaker Recognition Process is susceptible for a several challenges which are critical to speaker modelling. The main obstacle in speaker identification is the nature of voice signals. Such signals are termed by their randomness nature which can be caused by the time-varying nature of speech electric properties. The spectral information of speech varies overtime; therefore, it is difficult to rely only on the spectral domain in order to model a system for speaker recognition. In text-independent speaker recognition; frequency component analysis used to recognize the speakers. As voice signals are time-variant signal, the frequency spectrum information is changing by time. In this study, Mel Frequency Cepstral Coefficient (MFCC) alongside Fundamental Frequency are implemented to propose text-independent speaker recognition system approximation. In addition, Feed Forward Neural Network (FFNN) is applied for speaker prediction purpose. To further improve the performance, particle Swarm optimization algorithm was integrated by Freezing-FFNN. The simulation has
shown that newly proposed technique, namely PSO-FFNN has achieved accuracy by 83,4 % and reduced the Mean Square Error significantly.
Key Words : Prediction, FFNN, speaker recognition, particle swarm optimization,
MFCC, pitch frequency.
ÖZET
Yüksek Lisans Tezi
OPTİMİZE EDİLMİŞ İLERİ YAPAY SİNİR AĞI KULLANILAN METİNDEN BAĞIMSIZ KONUŞMACI ANIMA SİSTEMİ
SAEEDA MEFTAH SALEM ELTANASHI
Karabük Üniversitesi Lisansüstü Eğitim Enstitüsü Bilgisayar Mühendisliği Anabilim Dalı
Tez Danışmanı:
Dr. Öğr. Üyesi Ferhat ATASOY Ağustos 2020, 57 sayfa
Konuşmacı Tanıma Süreci, konuşmacı modellemesi için kritik olan çeşitli zorluklara sahiptir. Konuşmacı tanımlamasındaki ana engel, ses sinyallerinin doğasıdır. Bu tür sinyaller, konuşmanın elektrik özelliklerinin zamanla değişen doğasından kaynaklanabilecek rastgele olma doğası ile adlandırılır. Konuşmanın spektral bilgisi fazla zamana göre değişir; bu nedenle, hoparlör tanıma sürecinde bir sistemi modellemek için sadece spektral alana güvenmek zordur. Metinden bağımsız konuşmacı tanımada; hoparlörleri tanımak için frekans bileşen analizi kullanılır. Ses sinyalleri zamanla değişen sinyal olduğundan frekans spektrumu bilgisi de zamanla değişir. Bu çalışmada, metinden bağımsız hoparlör tanıma sistemi yaklaşımı önermek için Temel Frekans ile birlikte Mel Frekans Cepstral Katsayısı (MFCC) uygulanmıştır. Ayrıca, hoparlör tahmini amacıyla Feed Forward Sinir Ağı (FFNN) uygulanmıştır. Performansı daha da artırmak için, Parçacık Sürüsü optimizasyonu algoritması Freezing-FFNN ile entegre edilmiştir. Yeni önerilen tekniği simülasyon sonuçları yani
PSO-FFNN'nin% 83,4 oranında doğruluk elde ettiğini ve Ortalama Kare Hatasını önemli ölçüde azalttığını göstermiştir.
Anahtar Kelimeler : Tahmin, FFNN, konuşmacı tanıma, parçacık sürü
optimizasyonu, optimizasyon, MFCC, tepe frekansı.
ACKNOWLEDGMENT
First of all, I would like to say thank you for Allah and thank God for all the blessings. The next thankful for my country Libya that provided me with a scholarship, also i would like to give thanks to my advisor, Assist. Prof. Dr. Ferhat ATASOY, for his great interest and assistance in the preparation of this thesis. Finally, last big thanks for my husband and my sister and all member of my family.
CONTENTS Page APPROVAL ... ii ABSTRACT ... iv ÖZET... vi ACKNOWLEDGMENT ... viii CONTENTS ... ix LIST OF FIGURES ... xi
LIST OF TABLES ... xii
SYMBOLS AND ABBREVITIONS INDEX ... xiii
PART 1 ... 1 RESEARCH MOTIVATIONS ... 1 1.1. BACKGROUND ... 2 1.2. PROBLEM STATEMENT ... 3 1.3. OBJECTIVES ... 4 1.4. THESIS STRUCTURE ... 5 PART 2 ... 6 LITERATURE REVIEW... 6 2.1. SPEAKER RECOGNITION ... 6
2.1.1. Speaker Verification and Speaker Identification ... 8
2.1.2. Text-Independent and Text-Dependent ... 8
2.2. SPEECH FEATURES ... 9 2.3. CLASSIFICATION ... 13 PART 3 ... 16 SPEAKER MODELLING ... 16 3.1. SPEECH GENERATION ... 17 3.2. VOICE PRE-PROCESSING ... 20
Page
3.3. FEATURES EXTRACTION ... 21
3.3.1. Fundamental Frequency Coefficient... 22
3.3.2. Mel Frequency Spectrum Coefficients ... 24
PART 4 ... 29
EMPIRICAL MODEL ... 29
4.1. FEATURES EXTRACTION ... 29
4.2. OPTIMIZATION MODEL ... 31
4.2.1. Feed Forward Neural Network (FFNN) ... 31
4.2.2. Feed-Forward Neural Network (Freezing) ... 36
4.2.3. Particle Swarm Optimization Algorithm (PSO) ... 37
4.3. PERFORMANCE METRICS ... 42
PART 5 ... 44
RESULTS AND DISCUSSION ... 44
5.1. TIME AND ACCURACY MEASUREMENT ... 44
5.2. MSE MEASURE ... 45 5.3. MAE MEASURE ... 46 5.4. EPOCHS MEASURES ... 46 PART 6 ... 48 CONCLUSION ... 48 6.1. RESEARCH CONTRIBUTION ... 49 6.2. FUTURE WORKS ... 51 REFERENCES ... 52 RESUME ... 57
LIST OF FIGURES
Page
Figure 2.1. Speech processing taxonomy. ... 7
Figure 3.1. Speech production gates representation... 17
Figure 3.2. Cross-correlation resultant signal. ... 23
Figure 3.3. Peak (maximum) local maxima. ... 23
Figure 3.4. Bottom (minimum) local maxima. ... 24
Figure 3.5. Pre-emphasis filter a) Input signal, b) Output signal. ... 25
Figure 3.6. Overlapping window overview... 26
Figure 3.7. Hamming (single) window a) Samples, b) Frequency Domains. ... 26
Figure 3.8. Filter bank response on the Mel frequency scale of voice signal. ... 28
Figure 3.9. Mel frequency spectrum coefficients flow diagram. ... 28
Figure 4.1. Features formation at an empirical model. ... 30
Figure 4.2. Diagram refers to the ANN structure... 32
Figure 4.3. Layer structure of FFNN. ... 35
Figure 4.4. FFNN general work flowchart. ... 35
Figure 5.1. Graph of Mean Square Error values for the three models. ... 45
Figure 5.2. A depiction of a measure of Mean Absolute Error for all the models. .... 46
LIST OF TABLES
Page
Table 4.1. FFNN first experiment parameters. ... 36
Table 5.1. Accuracy calculations for the three models. ... 44
Table 5.2. Mean square error values for the three models. ... 45
Table 5.3. Measure of Mean Absolute Error for all the models. ... 46
Table 5.4. Values of time and epochs of the three models. ... 47
SYMBOLS AND ABBREVITIONS INDEX
SYMBOLS
Mf : mel frequency spectrum coefficients vector
E : error calculation Fs : sampling rate 2F : normal frequency fm : mel conversion Hm : hamming window H : hidden node HA : hidden node output W : wieght
O : output node values OA : output layer Vi(t) : velocity values
ABBREVITIONS
SV : Speaker Verification
IDSR : Indonesian Database Speaker Recognition WGN : White Gaussian Noise
MFCC : Mel Frequency Spectral Coefficients and PLP : Perceptual Linear Prediction
EPD : End Point Detection
LPCC : Linear Predictive Cepstral Coefficients RCC : Real Cepstral Coefficient
ANN : Artificial Neural Network FFNN : Feed Forward Neural Network PSO : Particle Swarm Optimization
ML-FFNN : Multilayer Feed Forward Neural Networks LM : Levenberg–Marquardt
MAE : Mean Absolute Error MSE : Mean Square Error RMSE : Root Mean Square Error
LFCC : Linear- Frequency Cepstral Coefficients UBM : Universal Background Model
SI : Speaker Identification FFT : Fast Fourier Transform SNR : Signal Noise Ratio
PART 1
RESEARCH MOTIVATIONS
The evolution of technology in modern days is driven by the wide range of developments in data sciences and in digital signal processing. Furthermore, as data applications (technologies) make more and more propagations in human daily lives, more and more challenges are coming to the light. Security and privacy of data are amongst those important challenges induced by the current demand. The development of digital signal processing has paved the way for recognition systems using biometrical properties such as face recognition, palm recognition, speaker recognition, and even eye recognition.
Speaker recognition is proved to have some strength over other recognition systems. Face structure might change due to aging, similarly, the palm and eye features might differentiate and even disappear because of aging. As a result, voice recognition is one of those options that is approved by many applications and it has proven its performance.
Another demand has been promoting more research work on voice signal analysis. The voice to text research has been developing day by day, and it has a great scope in auto driven vehicles and robotic customer service based on voice which replaces the necessity of human beings in call canters since they can operate completely on computerized services that are directed by voice signal processing.
Technically, the required accuracy of a speaker recognition system varies for different kinds of applications. The term accuracy in voice recognition depends on how robust the pre-processing is. On the other hand, most of the available research activities on
speaker identification are on text-dependent identification which would work ideally for particular data and could not accommodate other sources of data.
1.1. BACKGROUND
Voice is the oldest medium of communication between human beings on earth, it was driven mainly by the fact that human beings continuously need to share their feelings with each other in order to survive. The voice communication is inspired by the fact that an enormous amount of information can be exchanged with help of voice which makes it the optimum medium of communication compared to other possible ways such as writing and even the modern days' communications facilities such as electronic text [1-3].
In addition, all the languages arose as a kind of coding of the speech communication, variation in languages is due to the diversity of human descent exhibiting various geographical areas. Languages have differentiated in accordance with the surroundings and nature of the place exhibited by human beings. On these bases, different dialects and accents can be seen on the current popular languages [4]. Speaker recognition systems are implemented as an electronic solution in order to bring the support of security and privacy enforcement systems. It is widely preferred by technology and service providers to secure the personal data of clients and to prevent any autonomous attacks. The voice recognition system is based on the fact that a voice generation system is uniquely structured in every human [5].
Speaker identification is an evolved application that enforces a fresh means of personal identification in the top of the concurrent biometrical identification technology. Human voice involves a large number of features that are vital for the personal identity. Unlike speech recognition, other ways of personal recognition such as face recognition or thump impression are more susceptible to age effects. In other word, the wrinkles developing on hand palms and faces may degrade the performance of the particular recognition system; Also human voice has many features that are highly resistant to aging [6].
1.2. PROBLEM STATEMENT
The speech system shelters various challenges that are critical to the modelling process of the speaker. The main obstacle of speaker identification systems is the nature of voice signals. Those signals are defined by their randomness in their nature which can be realized from the fluctuations in electrical properties with time expansion. The information of the spectrum in a speech signal can be varying over a time period so it is difficult to rely on frequency information to modulate the speaker's voice track [7]. The speaker recognition process involves two different phases of processing which may take place in either of them. The first stage of processing is called text-dependent speaker identification system which simply depends on repeating the exact voice imprint at both testing and training. Text-dependent speaker recognition is achievable using the time domain analysis and drawback of this method is complete (full) similarity requirement, which is practically impossible [8].
On the other hand, in text-independent speaker identification, the speaker can be recognized based on frequency component analysis. This is generally done by using standard frequency domain analysis methods such as Fourier Transform. The main drawback of these methods is their inconsistency in the practical reality of voice nature. As voice signals are time-variant signals, frequency (spectrum) information changeover time [9].
According to the above scenarios, the traditional models seem unable to accommodate the varying nature of voice signals. Also, traditional models use the Fourier Transformation as an essential method to analyse the frequency. Other methods such as zero-crossing, convolution and correlation are commonly used as a time-domain method to analyse the speech signal. Conventional voice recognition models depending on the aforementioned approaches are not sufficient for overcoming the time-varying nature of voice signals [10].
On the other hand, the mapping of features into their particular entity is causes another challenge in the speaker recognition systems. A plenty of technologies are being used for facilitating the mapping process. Recently, machine learning methods are very
popular; Also, the problem of accuracy is yet disputable. The most relevant technology of mapping is using neural networks to predict the speakers. The prediction of speaker is highly impacted by the quality of training algorithm that is used to set the model training coefficients. In systems like the speaker identification, high accuracy predictors are essential in order to avoid any security (integrity) gaps [11].
1.3. OBJECTIVES
In order to tackle the issues mentioned in the problem statement section and to fulfil the requirements of research motivations, the following points are defined as the focus of this research dissertation:
First: in order to address the spectrum fluctuation problem, a hybrid model can be used to extract features from the voice signal. The term “hybrid” can be interpreted as a combination model of time and frequency features extraction.
Second: For modulation the speaker vocal track, human ear experience will be considered. A speaker model is actually meant to be simulating the human ear in discriminate individual speakers, we will try to adopt a relevant approach in this regard. This is by using the Mel Frequency Cepstrum Coefficients.
Third: For enhancement purposes, the speaker model can be enriched by several feature extraction methods. Our preferred methods to merge would be, Mel Frequency Cepstrum Coefficients and Fundamental Frequency Coefficient; the final features vector would stand for the hybrid features model.
Fourth: This study is to build a text-independent speaker recognition work with voice database, where each voice is sampled at 16000 Hz.
Fifth: Development of smart speaker recognition system based on machine learning approaches to enhance the speaker prediction performance.
All of the purposes listed above will be fulfilled by using Feed Forward Neural Network and then Particle Swarm Optimization algorithm is used for improving the recognition accuracy. In this stage, the main objective is to improve the performance of the existing Feed Forward Neural Network model after studying the strengths of the same model in various training challenges. Model prediction accuracy is to be monitored in the baseline model as well as in each one of the development stages. Model freezing as well as Practical Swarm Optimization are the main proposed techniques for performance enhancement.
1.4. THESIS STRUCTURE
This thesis includes six technical chapters and provides a complete explanation for the speaker identification system. These six chapters are listed as follow:
Chapter One: Has a general overview of speech recognition and research motivation. Also introduces the problem statement and objectives of this study.
Chapter Two: Provides brief literature of the main sections of the speech processing by the previous and current of related work studies.
Chapter Three: This chapter provides an overview of speech generation, speech pre-processing, and also illustrates that the main methods used on the system are the fundamental frequency and Mel spectrum coefficients.
Chapter Four: This chapter presents the “Empirical Model" is used in this study. Basically, the Feed-Forward Neural Network is used for learning the features and their targeted speaker, and then uses this Neural Network and Particle Swarm Optimization models to predict speakers according to the input features.
Chapter Five: Describe an experiential evaluation of speaker recognition.
Chapter Six: Summarizes the indicators derived from this study and highlights contributions system.
PART 2
LITERATURE REVIEW
This chapter shows an overall literature review of former related works to this research. Section 2.1 presents briefly reviews speaker recognition system. Section 2.2 speech features and in Section 2.3 Classification.
2.1. SPEAKER RECOGNITION
In the 1960s, the first speaker recognition method was invented by using signal spectrograms. This is called voiceprint analysis. Until now, many feature extraction techniques commonly used in speech recognition have been used to recognize people. The field has been evolving since the mid-1980s, the commercial use of speaker recognition is expanding, and as of now, many organizations are providing this innovation. From the recent research on signal processing, voice is characterized in signals carrying message information [1]. Moreover, the voice signal itself is identified by its language information and speaker vocal tract information. The speech produced in the vocal trajectory is affected by the shape of the vocal trajectory and the nature of the speech path such as teeth, moths, etc., and they all accumulate to form the final content of the speech signal. Recent technological advancements have involved multiple applications that enable people to control machines remotely, such as the reliability of banking applications and voice retrieval. Therefore, in order to identify a specific speaker, his vocal trajectory features should be modelled so that man-machine applications can work effectively [2]. There are three main tasks in speech signal processing: coding, analysis, and recognition. The recognition fields are subdivided into three different parts Speaker, Language and speech, recognition. Moreover, the recognition systems work in different applications and it is classified into text-independent, text-dependent, close-set, and opened-set., shown in Figure 2.1. These days increasingly more consideration has been paid on the speaker recognition
field, which includes two applications: speaker verification and speaker identification [3].
Speaker recognition is a vital stage in various personal authentication and security systems. It constructs the logic of individual verification using more precise bio-metric tools known as voice characteristics. This technicality makes it conceivable to utilize the speaker' s voice to confirm their character and control access to administrations, for example, voice dialling, banking by phone, phone shopping, database get to administrations, data administrations, voice message, security control for classified data territories, and remote access to PCs. The main purpose of speaker recognition is to recognize speakers from a set of different speakers based on his/her speech samples [4].
2.1.1. Speaker Verification and Speaker Identification
Speaker verification (SV) is the process of deciding if the speaker's personality is who an individual claim to be. The objective is to define if testing of speech belongs to a singular particular speaker (i.e., deciding if an unbeknown voice is from a specific enlisted speaker). Also, different expressions that have a similar definition, such as voice authentication, voice verification, talker/speaker authentication. Speaker verification is divided into text-dependent and text-independent. Speaker identification is about comparing one speaker with many speakers (usually with speakers’ dataset) and hence, uncovering the similarity between (matching) existence if signal matched any of dataset contents. The problem is raised speaker’s identification system is being deployed country with many local languages. For that, some studies attempt to figure out the issues in the cross-lingual model of speaker identification [5].
Speaker verification/identification systems are subdivided open-set. or close-set. Open-set speaker identification proof alludes to the situation where the speaker is a known individual from a set of speakers and the definition of an opened-set speaker amplifier also includes another possibility that the speaker is not a member group of speakers [6].
2.1.2. Text-Independent and Text-Dependent
Speaker identification is taken place either when the speaker speaks particular phrase (sentence) and the system is aware about this sentence, the same is called text-dependent speaker identification. Otherwise, when the speaker can speak any phrase and system is not aware of the content of this phrase but still can recognize the speaker, this is termed as text-independent identification. Also it is stated that three possibilities of identification model can be derived according to the speaker language more likely in the cross-lingual system, the spoken language can be different in both testing and training, whither, the spoken language can be one in during training phase and multiple in testing phase which is termed as a multilingual system [7].
Furthermore, the state of art for processing speech signals as proposed by the authors involves using Dataset is prepared to a server by recording a speech using five recorders and two languages with several environments such as (laboratory, collators, rooms). The recording of the speech is done by sampling the speech signal at 16 kHz [7].
Indonesian Database Speaker Recognition (IDSR) is introduced in this paper, which is an Indonesian corpus collected using multi-languages in Indonesia, which are Bahasa, Javanese, and Sundanese. Speech is recorded using multi-recording devices aiming to bring session variability problems toward the building of the speaker’s model. Session variability problems are the main focus of our experiment using IDSR. The experiment performed shows that session variability can be handled using factor analysis approaches. Factor analysis approaches show promising results for both cases of data type used in this research. It is argued that to handle session variability problem effectively, especially in the case where multi-channels included, various information which is collected from different channels need to be provided. Additionally, if the requirement could not be met, the data uses to build the model should be recorded in top quality. In the future, Indonesian Database Speaker Recognition (IDSR) will be used to analyse the language effect on the performance of speaker recognition. The examination of how well the system performs when the speaker is talking using more than one language will also be done. Furthermore, more data needs to be collected to obtain a variety of speakers. All of the recordings are recorded and sampled at 44.1 kHz and 16-bit rate [8] .
2.2. SPEECH FEATURES
Speech signal itself is recognized by its language information and speaker vocal track information. The speech that produced in the human’s vocal track is affected by the shape of the vocal track and the nature of speech path such as teeth, moth, etc. which all accumulate to form the final content of speech signal. Technology advancement in recent years involves several applications that enabled the human to control machines remotely such as bank application and reliability by voice retrieving. Hence, in order to recognize a particular speaker, the characteristics of its acoustic path should be
formulated so that the human application of the machine interface works efficiently [9].
The first step in speaker identification system involves from end signal processing and feature extraction tasks which is directly impact the quality of recognition. In other word, voice imprint of the speaker can be recognized depending on this front-end process. Speech features are likely to be estimate at short window of time where the nature of those features is constant during that time frame [10].
The features extraction from speech signal may involve several features; so, as features are extracted, a vector may be formed to accommodate those features (called features vector). The recognition process is taking place by finding the similarity level or the probability of speaker detection. It is achievable by measuring the distance between the features in both dataset features vector and the unknown speaker’s vector of features. The development of text dependant speaker identity system that recognizes the speaker as they provide the digit wise password to the system such as two, three, etc. the speaker is hereby required to utter a single digit at the system [10].
The last experiments revealed how accurate the results will be after using the distance estimation approach to find the minimum distance between the test features vector and the training features vector. The cosine distance evaluation method is employed to find the distance between the vectors [11] . Moreover, the speech signal is constant (stationary) at time frames of ten to twenty milliseconds. Segmentation of speech signal is vital to the success of further (high-level) speech processing in an ant speaker identification system. The implementation of enhancing the segmentation method to be applied to speech signals to optimize the correlation between the practical (real) characteristics of speech and the likelihood vector of utterances [12].The authors revealed that speaker gender information availability directly influences the performance of segmentation and hence influence the recognition accuracy of the speech [12].
Voice signals are affected by noise and the testing signal with unity variant White Gaussian Noise (WGN) for testing the efficiency of the different techniques to process
the said noisy input speech. Since the speaker is presented at uncontrolled environments more likely, other voices might be a presence when the speech signal is recorded, so the testing signal is combined with noise to meet the ground environments. Furthermore, features are extracted using Mel Frequency Spectral Coefficients (MFCC) and Perceptual Linear Prediction (PLP) methods. Results revealed that MFCC is outperformed over the other technique [13].
Some approaches are known to tackle the background voice information drawbacks such as background samples are declared as one of the performance degradations factors and hence, it required to be removed from the said signal. One of the hogging techniques is the deployment of two microphones; one can be used to detect the main speaker signal and others to be placed far away from the speaker to detect the vicinity vice signals. Ultimately, samples of background are subtracted from the vice sample and resulting in a clean signal. This technology or method is not suitable in speaker recognition as matching both samples from both microphones is not an easy task and results in a low-resolution signal. The echo is another distortion cause in speech processing, it results due to reflection of a speech signal on the surrounding objects which produce a copy of the same signal in delayed time that also distorts the system performance [14].
The common trend in speech processing is recording a signal in a determined laboratory environment where low noise and almost no background disturbances are expected. Such environments help a lot to detect the only speaker samples and use them in the further stages of the recognition system [15].
In many cases where speech recognition is required, some of the speakers are under stress where the resultant utterances are influenced by this stress. Some studies are focusing on the use of aggregation methods to emphasize speaker recognition. According to reports, aggregation methods are the best method for performing decision-making processes on such inputs [16].
The overall system proposed by "Roman Martsyshyn" involved five sections more likely speech pre-processing where the signal is prepared for feature extraction which
dominate the second section of this system. The third section is represented by modelling the voice signal by training the system to recognize the extracted features. The last section of the system involves the classification model which made for mapping the speech signals to the appropriate target after performing the training process and it is used of Mel Frequency Cepstrum Coefficients MFCC algorithm as an underlying model and results revealed that system run time is reduced relatively by thirty-five percent as compared to similar studies [17].
In the process of analyzing the whisper signal, the researchers pointed out that whisper is a conventional means of communication. The spectrum of this speech is completely different from the natural speech spectrum, and most of the spectrum is not similar. Therefore, the recognition of low voice speech has different aspects [18].
Where it is already revealed by the previous studies that voiced part excitation is totally disappeared in such signals with speech formants are being shifted to the region of low frequency; and it is observed the slop of spectrum is more-flatter in whispered speech than normal speech. In order to recognize the speaker by depending on whisper speech, several features are dependent such as features of high-level processing, features of spectrum temporal, features from the source of voice (source unique features) [19].
The pre-processing of people’s speech signals is playing a big role in the accuracy of the recognition process as a whole. In practical situations (environments), the speech signals may be wrapped with unwanted speech (background interference) so, the pre-processing may take place to isolate the unwanted speech or any component of non-speech nature from the input signal. One of the popular algorithms that perform pre-processing is called End Point Detection (EPD) algorithm. The major of this algorithm involves the discovery of the beginning point (starting) and endpoint in the speech signal. End Point Detectionalgorithm is also determining the zero-crossing number in the said speech signal and hence it detects the noise region of the speech. All these features (boundaries, zero-crossing, and noise locations) are critical to the accuracy of the speaker identification system as revealed by the author of this study [20].
The further step of speech recognition and speaker identification as well is about good features extraction; the best definition of the feature extraction is more likely conversion the speech signal into a compacted vector that includes all the important speech characteristics. The authors defined the unit of Mel as human ear level of preservation which is equivalent to lesser than One-Kilohertz of linear spacing and bigger than One-Kilohertz in logarithmic scale. The author has mentioned that the Mel Frequency Cepstrum Coefficients )MFCC (algorithm outperforms in speech feature extraction. Post the feature extraction step, Speech is passed machine algorithms, usually, a discreet matching algorithm is used where similar features from the testing phase and training phase are analyzed discretely (point by point) in order to evaluate the minimum matching between them [20].
The several approaches have been proposed to perform features extraction for speech signal such as: Linear Predictive Cepstral Coefficients (LPCC), Real Cepstral Coefficient (RCC), Fundamental Frequency and Mel Frequency Cepstrum Coefficients (MFCC). Recent approaches empowered by MFCC outperformed all other methods such as LPCC and RCC [19,21].
2.3. CLASSIFICATION
Classification is the processing to identify unknown speakers by using a classifier to match the features of unknown speakers with existing databases. The performance monitoring of the speaker recognition system is crucial for system optimization and further enhancement of functions. The monitoring of the system is particularly concerned with determining the error rate or error probability in speaker recognition. Due to the variety of leaks in performance monitoring technology, this task is very difficult in actual situations [21].
The log-likelihood method was used to evaluate the performance to evaluate the errors in speaker recognition by performing several tests (experiments), and an estimator was applied in each experiment. The advantage of this estimator is the dependence of the number of tests. In other words, only five tests can reach the minimum variance.
Therefore, the method of log-likelihood estimation is to solve the problem of insufficient testing (experiment) [22].
The experiments were conducted using the YOHO database. The speech is recorded from one-handed and thirty-seven speakers in such way every speaker will speak twice so that one speech imprint will be used for training and other will be used for the testing. The study is covered the pre-processing part as author mentioned that speech signals are undergone silences removing process from both ends. Hence, signals are segmented where each segment is of twenty-five milliseconds length and ten milliseconds overlapping [21].
Text-independent speaker recognition is required by the majority of virtual applications such as those applications involves voice interaction between human and virtual machines. Human (user) voice should be well recognized by such an application in order to ensure the security of information and authenticity. Text-independent speaker recognition is required by the majority of virtual applications such as those applications involves voice interaction between human and virtual machines. Human (user) voice should be well recognized by such an application in order to ensure the security of information and authenticity.
The development of other technology sectors such as data mining techniques and artificial intelligence has made the advancement of those techniques usable by all engineering sectors. The authors here have demonstrated the big role of the neural network to classify the voice data. Artificial Neural Network methods (ANN), in data processing, the artificial neural network has strong interference ability, adaptive learning, and other advantages, so in recent years, various types of Neural networks are used in speaker recognition, Also, the voice data are flexibly classified using the probabilistic neural network for the application adopted [23].
The results show an accuracy of recognition equal to ninety-six percent by using short voice imprint during the testing phase. A populistic neural network was said as the best option since the design simplicity and straightforward functionality in classification tasks. Form the other hand, the authors have stated that the probabilistic
neural network is fit for the classification of complex problems with many advantages such as the ability to upgrade the data any time and the accuracy in the results of classification. One realized drawback is a long time of processing due to the complexity of its internal operations [24].
Feed Forward Neural Network is one of the significant techniques in speech processing and image processing. it is started to pattern recognition by selecting a set of attributes or features from signal samples, it is used to classify patterns. The performance of speaker recognition Feed Forward Neural Network(FFNN) is best than other patterns recognition such as backpropagation network [25].
An optimization algorithm is an advanced technology that can be used in many different applications such as science and engineering. Particle Swarm Optimization (PSO) is an optimization algorithm based on crowd intelligence. Another algorithm classification is a more efficient parallel search algorithm. By searching for complex variables, the optimal solution in high-dimensional space has good moderate adaptability and agility. It retains the omitted population-based search strategy, and the velocity-displacement model is used to simplify the operation. PSO has a fast convergence speed and few setting parameters, which has attracted wide attention. This is a simple concept applicable to a naturally dispersed and self-organizing system in which all particles move to obtain better results [26].
PART 3
SPEAKER MODELLING
Speaker recognition is a vital stage in many personal authentication and security systems, it builds the logic of person using verification their biometrical features; more specifically, voice features. The entity of the speaker recognition system involves the major two stages called feature extraction and speaker classification. Though, these processes may begin with voice pre-processing which involves the preparation of voice signals and set them together in the dataset. Speech features include time domain and frequency domain processing, each is an integral part of speech processing and can be used to form a final recognition system.
Speech signal pre-processing is about signal enhancement by reducing the noise level and removing the other unnecessary information such as background noise and other associates. It might involve silence removal which deletes the samples of low power that represent the silence in the uttered sentence (breaks while speaking). These processes are important to enhance the signal quality which makes the signal more readable by the further process (stages). Moreover, pre-processing is important to reduce the extra computation power that might utilize the capacity of the processor and distort the performance of the entire system.
On the other hand, several approaches are used to perform features extraction of the speech signal. The fundamental frequency and Mel Frequency Cepstrum Coefficients are the main approaches employed over this system. Whither, deep learning approaches are however employed for speaker classification tasks (mapping the features to a particular speaker).
The ultimate stage of processing is set to be system performance examination which monitors the system performance to recognize the speakers. The system is examined during the training and testing to evaluate the accuracy of speaker recognition and to highlight the error during the model training.
3.1. SPEECH GENERATION
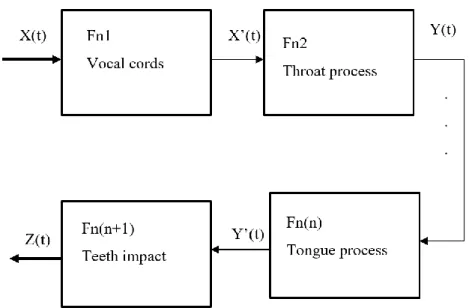
Speech is one of the essential tools of human beings which is used to translate the thoughts and other brain orders. The speech is produced after a set of stages in the utterance system of humans. In order to understand speech features and to derive the speech processing digital systems, speech production must be discussed. The human utterance system can be described mathematically in the form of gates where each gate represents a transfer function that applies some marks to the input. Each stage’s output is diverted to the next stage (next gate) which also applies some new marks [27]. Ultimately after a set of gates, a final speech signal is formulated, and speech is produced as in Figure 3.1.
Figure 3.1. Speech production gates representation.
The figure demonstrates n gates of speech production; it declares that signal x(t) is the very first signal that goes to the first gate of the utterance system. This gate in turn
produces x’(t) which goes to the next stage of the system and so on. The system output is drescribed in the following formulas (from 3.1 to 3.4).
𝑥′(𝑡) = 𝑓 𝑛1 . 𝑥(𝑡) 𝑦(𝑡) = 𝑓𝑛2 . 𝑥′(𝑡) 𝑦′(𝑡) = 𝑓 𝑛𝑛 . 𝑦(𝑡) 𝑧(𝑡) = 𝑓𝑛𝑛+1 . 𝑦′(𝑡) (3.1) (3.2) (3.3) (3.4)
Each gate or stage in the utterance system has its’ own impact on the speech signal and all together are forming the final speech signal. Utterance system is having the same structure in all human beings but internally, the gates may differ in their size and dimensions from person to person that may justify the fact that there is a variance of tone in speech among people as rarely two-person may have same or even similar speech signals.
The uniqueness of speech signal for each person is a result of the differences in the dimensions of utterance system organs and their size. Basically, the vocal cords are the main participants in the speech generation process. As air passes over the cords, a vibration of them may generate the tone of speech and utterance, hence after, the resultant signal is passed through throat which itself forms the next form of the speech signal. The ultimate stage of speech production is passing the signal through the mouth. A signal in the final stage (mouth) is affected by the tongue and the presence of teeth.
Furthermore, a voice signal can be studied and processed after it gets recorded from the speaker. Mainly, the signal is required to be sampled. The sampling process is vital in the speech processing system; the signal is broken into a set of segments called samples which can be used to study the signal afterward by applying features extraction methods.
Sampling is nothing but selecting a point (with amplitude and phase) from the set of points of the speech signals with a known sampling rate. The sampling rate must be higher or equal to two-fold of normal frequency as in equation (3.5) [28].
𝐹𝑠 ≥ 2𝐹 (3.5)
Where Fs is the sampling frequency and F is the normal frequency of the signal, many studies have reported using the 16000 Hz as the sampling frequency of the speech signals. This amount of sampling frequency ensures high-resolution signal processing and fast recovery of the original signal without losing the important samples. The sampling signal and a normal signal is shown in Figure 3.2 [28] .
Figure 3.2. a) Continuous time signal, b) Sampled time signal demonstration [28].
A sampling of a continuous-time signals as in Figure 3.2 would produce the signal with only particular samples in a known sampling rate. Additionally, each sample in the sampled signal is represented with amplitude (voltage) and phase or sample number. So-to-say, if the sampling rate is 16000 hertz per second, the voice signal of (three seconds) will have a total of 48000 samples. The sample series is beginning with sample number one and is ending with sample number 48000.
Studying the nature of the voice signal is involving analysing the samples of such signals by conducting the so-called sample to sample analysis. One noteworthy fact about this process is the sampling is folded under time-domain signal processing.
3.2. VOICE PRE-PROCESSING
Pre-processing of the voice signal is including all of the changes that are applied to the signal before it is actually passed to the analysers. In addition, pre-processing is succeeded by sampling where a signal is converted to a set of samples for efficient analysis. Herein, as a speaker recognition system might deal with a large number of speakers, dataset preparation is an important step in pre-processing. The hereinafter points are noteworthy and set to be covered while pre-processing [29].
In this project, the data set includes transcribed high-quality audio, and the data is downloaded from http://www.openslr.org/70/,by using 25 speakers 12 males and 13 females and spoke ten different sentences, each of which lasted from 5 to 15 seconds. The voice sampling frequency is 16khz. The data set contains 250 voice clips, which are recorded from many speakers.
The same clips are sorted and named in numerical or alphabetical order to easily enter them into the processing system.
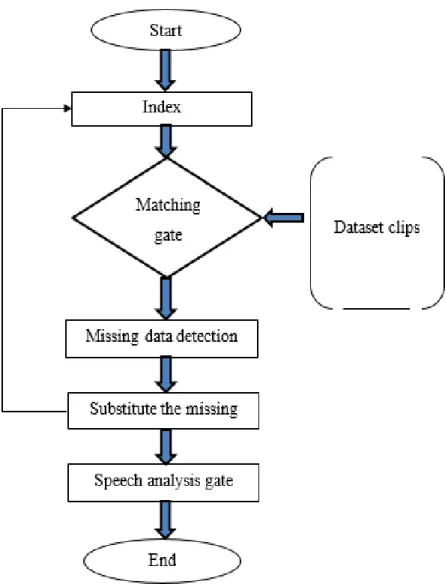
An index is associated with the dataset that enlists all the speech signals names. If the same is not available on the dataset, it needs to be created. Such an index can be formed as a character string as follows= [voice1, voice2, voice3, voice4, voice5, ----, voice n];
In case such an index is available by default along with the dataset, index verification should be handled for matching the index with the voice clips in a database as in many cases indices may escape some voice clips and that will create an error on the further processing stages. The index controls the sequence of dataset items and hence after each operation of pre-processing index counter need to updated Figure 3.3 shows the process of dataset pre-processing.
Figure 3.3. Dataset preparation action plan.
3.3. FEATURES EXTRACTION
Speaker verification based on speaker’s voice (speech) is required to determine the uniqueness of the speech signal which distinguishes a particular speaker from any other speaker. This requires a high knowledge of speech signal processing and speech analysis. The problem raised from the fact that voice signal is composed of large samples and some of those samples is not really related to the physical properties of the speech. Such samples can be the adaptive white Gaussian noise or background voice information [30].
Background voice can be defined as the samples of voice that mixed with original voice signal and generated from sources apart from the speaker [31], especially voices produced by surrounding objects such as cars, people at the vicinity and others. This information can be regarded as a random process which can exist at both testing and training signals. Background voice data cannot be detected nor can be represented mathematically in an easy way.
3.3.1. Fundamental Frequency Coefficient
The fundamental frequency is one of the interesting features in the speech signal, it can be produced in time domain analysis using the cross-correlation approach. The aim of this feature is to identify the fundamental frequency in the speech signal.
The fundamental frequency is also called as pitch frequency and calculated using the pitch period. This period lies on the cross-correlation signal and represents the time between the minimum local maxima and maximum local maxima on the signal corps. Assuming that the sampled speech signal is represented by S[n], the S’[n]=S(n-1) be the time-shifted copy of the same signal. Cross-correlation can be given in equation (3.6).
𝐶[𝑛] = ∑ 𝑆[𝑛]. 𝑆′[𝑛] 𝑁
𝑛=1
(3.6)
Figure 3.4 shows the results of the cross-correlation between the speech signal and the same copy of it in shifted samples (phase). The next steps are to evaluate the peaks of the resultant signal, those peaks are named as maximum local maximum as in Figure 3.5 and minimum local maxima as in Figure 3.6 [31].
Figure 3.4. Cross-correlation resultant signal [31].
Figure 3.6. Bottom (minimum) local maxima [31].
3.3.2. Mel Frequency Spectrum Coefficients
Mel scale is a popular subject in speech context, it simulates the value of human ear sensation to the speech signal. Mel frequency has differed from a local frequency of the signal and Mel spectrum coefficients are formulation the Mel set which represents the amount of ear sensitivity to the human ear to a particular voice signal. So, each voice signal has different effects on the ear and Mel frequency spectrum coefficients represent the ear response in the form of a vector of eight values. The Mel frequency spectrum coefficients vector can be represented in the following expression. Each member in the following array represents a coefficient in the MFCC model [32].
𝑀𝑓 = [𝑚1, 𝑚2, 𝑚3, 𝑚4, 𝑚5, 𝑚6, 𝑚7, 𝑚8]
In order to derive the Mel frequency spectrum coefficients which, represent the ear response to the voice signal, firstly, a voice signal is passed through pre-emphasis filter as an attempt to amplify the low power samples. This process is important for the following reason: voice may include low-Frequency segments resulting in voice waveform (samples) due to Whispering or non-loud voice. Furthermore, the pre-emphasis filter will take the voice signal and attempt to unify the power so that power can be distributed uniformly among the frequencies as demonstrated in Figure 3.7 [33].
Figure 3.7. Pre-emphasis filter a) Input signal, b) Output signal [34].
Signal passing from the pre-emphasis filter can result in a new version of the signal with an enhanced signal to noise ratio. As low power frequencies are more susceptible to noise impact, pre-emphasis filter produces a signal with a higher power of those slots and hence the ratio of the signal power to the noise power will be larger [34].
As soon as the signal has resulted in good SNR (Signal Noise Ratio) from the pre-emphasis filter, signal framing is the next process in the Mel frequency spectrum coefficient algorithm. Also, since speech signal is a time-variant signal which means that frequency keeps changes with time and not fixed frequency reposed can be ensured, researchers agreed to a fact that speech signal remains stationary in a very short time frame more likely within 25 milliseconds. For this purpose and in order to determine the signal properties as time-invariant signals, the framing of the signal is a must [35].
A 25-millisecond frame window with 10 seconds overlapping frames are set to be signal windowing is applied to the speech signal, the same is demonstrated in Figure 3.8.
Figure 3.8. Overlapping window overview [35].
This window is called hamming window T[n] and can be presented by the following equation (3.7), the samples and Fourier transform of the hamming window is shown in Figure 3.9.
𝑇[𝑛] = {46 × 10−2× cos[(2𝑛𝜋)(𝑁 − 1)−1]} + 0.56
(3.7)
Figure 3.9. Hamming (single) window a) Samples, b) Frequency Domains [36].
In further steps, each hamming window is converted from samples into a spectrum using the Fast Fourier Transform (FFT) as given in equation (3.8) [37].
𝑆[𝑛] = ∑ 𝑠[𝑛] 𝑒2𝑛𝜋 𝑁
𝑛=1
Where S[n] is the Fast Fourier Transform of the sampled signal s[n], furthermore, Mel frequency is derived from the above components using the Mel conversion equation as in (3.9).
𝑓𝑚 = 2595 log(1 + 𝑓𝑛
700) (3.9)
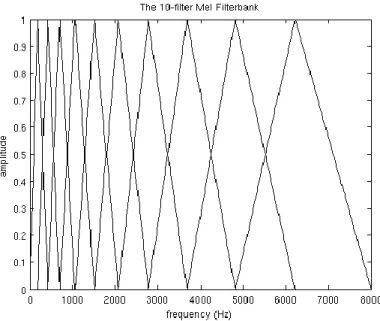
The last step in the Mel frequency spectrum algorithm is to simulate the human ear perception to the voice signal. So, the filter bank is used to perform the same. Filter bank with the transfer functions given in equation (3.10) is implemented to produce the human ear voice perception [38].
𝐻𝑚(𝑘) = { 0 𝑘 < 𝑓(𝑚 − 1) 𝑘−𝑓(𝑚−1) 𝑓(𝑚)−𝑓(𝑚−1) 𝑓(𝑚 − 1) ≤ 𝑘 < 𝑓(𝑚) −𝑘+𝑓(𝑚+1) −𝑓(𝑚)+𝑓(𝑚+1) 𝑓(𝑚) < 𝑘 ≤ 𝑓(𝑚 + 1) 0 𝑘 > 𝑓(𝑚 + 1) (3.10)
The filter bank response to the input can is demonstrated in Figure 3.10. The same figure represents the Mel scale of the spectrum according to the ear which usually responds to the voice signal in low and high frequencies, so ear as shown in the Figure can respond with narrow response to the low frequencies and wide response to the high frequencies and accordingly for each voice signal there will be different response [39]. Generally, the algorithm like Mel spectrum coefficients can convert the signal into the equivalent representation in the Mel scale that reflects the human ear perception to the voice. It performs the same by completing five essential stages namely: pre-emphasis, framing, windowing, power spectrum density, and filter bank. The same is demonstrated in Figure 3.11 which presents the functional steps of Mel frequency spectrum coefficients [40, 41]. [40] [41].
Figure 3.10. Filter bank response on the Mel frequency scale of voice signal.
PART 4 EMPIRICAL MODEL
EMPIRICAL MODEL
The speaker model was formulated using one feature from fundamental frequency and eight features from the Mel frequency spectrum coefficient. Furthermore, a dataset consists of many speakers and each speaker has got several clips. So, the empirical model which is discussed over this chapter is about detailing how the dataset is treated in light of speaker modelling and classification. In other words, how a model has accommodated the total input signals from the dataset. The following sections of this chapter include the discussion about the classifiers which used as smart mappers of features to their particular speaker. Basically, the Feed-Forward Neural Network is used for learning the features and their targeted speaker. This Neural Network model is then employed to predict speakers according to the input features.
4.1. FEATURES EXTRACTION
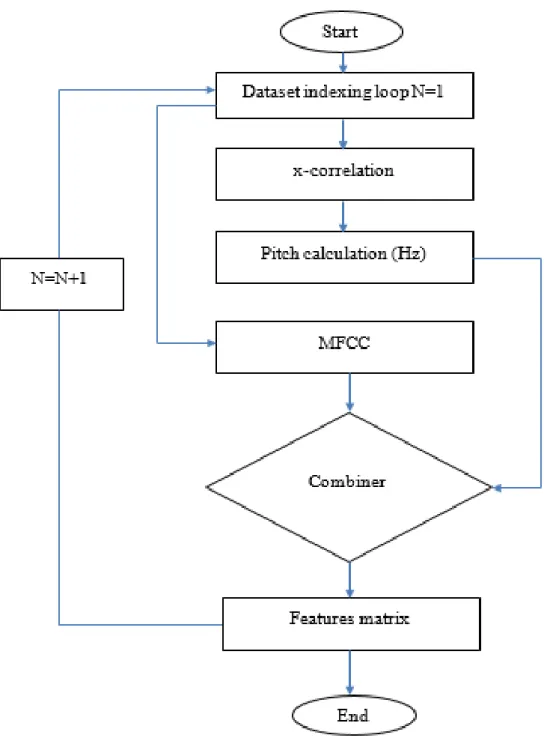
Features of the speech signal are generated from both the Mel Frequency Spectrum Coefficient method and the Fundamental Frequency method (pitch frequency). Mel scale of the speech signal is obtained from the MFCC method, which represents the human ear response to the speech and it basically divides the speech signal into a set of windows using a triangular filter bank and returns different window sizes for the higher and lower frequencies. In other words, MFCC may segregate the speech signal according to the frequency range presented on it and depends on the Mel scale (human ear perception). Furthermore, the pitch frequency is also obtained from the speech signal, it is produced a single value in hertz, the fundamental frequency is vital in speaker recognition because it presents the minimum frequency of vocal vibration [42].
Figure 4.1. Features formation at an empirical model.
The combination of the two aforementioned methods is performed as pitch frequency may be affected by the noise association and hence it might not return the exact character of the speech signal. Accordingly, features from both, pitch frequency method and Mel frequency spectrum coefficients methods are obtained and used for recognition work. For 250 speech signals and nine features for each signal, a total of 2250 features (elements) are generated from the speaker model. Figure 4.1 depicts the process of features combination.
4.2. OPTIMIZATION MODEL
4.2.1. Feed Forward Neural Network (FFNN)
Neural networks are advanced technology and are very useful in many different fields of science and engineering. Neural networks represent the further development of artificial intelligence and are known for their speed, accuracy, and efficiency. As the name suggests, the function of nerves is the same as that of nerve cells in the human brain. Biologically speaking, nerve cells activate ordered nerves and then pass them to higher-order cells through neurons. When a neuron receives a command, it is updated as the situation changes until the command reaches the final stage or final cell [43].
So, Artificial Neural Networks or (ANN) are the most popular terms in the machine learning applications. ANN takes the same concept of biological brain cells to classify, predict and cluster the data. The most popular sort of Artificial Neural Networks is the Multi Layer Feed Forward Neural Networks (ML-FFNN). This sort of machine learning is mostly used for predicting future incidents or problems by learning about the incident/problem. Fig.4.3 presents the topology of Feed Frward Neural Network; it consists of three layers which are input, hidden and output layer. Layers are built up with several nodes; the neurons are used to connect these layers [46].
Figure 4.2. Diagram refers to the ANN structure.
The input layer has two nodes 𝑋1 and 𝑋2, 𝑊1 to 𝑊12 is connection weight of the network, hidden layer has two nodes 𝐻1 and 𝐻2, output layer has two nodes 𝑂1 and 𝑂2, HA1 and 𝐻𝐴2 are known as hidden node outputs and 𝑂𝐴1 and 𝑂𝐴2 are known as output node outputs. The hidden node values are expressed as:
𝐻1 = 𝑋1 ∗ 𝑊1 + 𝑋2 ∗ 𝑊3 + 𝐵1 ∗ 𝑊5 (4.1)
𝐻2 = 𝑋1 ∗ 𝑊2 + 𝑋2 ∗ 𝑊4 + 𝐵1 ∗ 𝑊6 (4.2)
Let activation function in the hidden layer is sigmoid function; then node output of the hidden layer expressed as:
𝐻𝐴1 = 1
1 + 𝑒−𝐻1 (4.3)
𝐻𝐴2 = 1
The output node values are expressed as:
𝑂1 = 𝐻𝐴1 ∗ 𝑊7 + 𝐻𝐴2 ∗ 𝑊9 + 𝐵2 ∗ 𝑊11 (4.5)
𝑂2 = 𝐻𝐴1 ∗ 𝑊8 + 𝐻𝐴2 ∗ 𝑊10 + 𝐵2 ∗ 𝑊12 (4.6)
Let activation function in the output layer is linear; then output of the output layer expressed as:
𝑂𝐴1 = 𝑂1 (4.7)
𝑂𝐴2 = 𝑂2 (4.8)
For total error calculation, consider 𝑂𝐴𝑖 is the output value of the output node 𝑖 and 𝑦𝑖 is the output target then:
𝐸 = 1
2∑(𝑦𝑖 − 𝑂𝐴𝑖)2
2
𝑖=1
(4.9)
By employing propagation algorithm, weights of the connection (𝑊1 to 𝑊12) are adjusted to minimize error between actual output value and target value. Functions in the forward direction such that inputs can be processed from the input layer to the output layer through the hidden layer without any feedback process. This makes the model (FFNN) more suitable for those applications about time preservation. FFNN is generally working in two stages namely the training stage and testing stage [44].
During the training stage, a neural network learns the statistical data and accordingly updates its parameters. This process is called machine tuning and it more likely changing the weights and biases values repeatedly until reaching an acceptable learning quality. So-to-say, the following points are the major considerations while working with neural networks.
Selecting the layers: This means that layers number must be identified carefully in order to prevent the delay resulted due to a higher number of layers. It is definite that the more layers, the more accuracy and that depends upon the application [45]. In applications such as image processing layer selection is usually 6 to 13 hidden layers and that takes huge time in the training stage. In voice applications, using a three layers neural network is challenging as high accuracy and less processing timeare required. According to this assumption, three layers of a neural network is the best possible option as an initial alternative [46].
Model tuning: in this, the model is set to be trained periodically in order to finalize the values of weights and biases. Basically, the Levenberg–Marquardt algorithm (LM) is integrated with the neural network in the deep learning toolbox and hence, this algorithm is choosing random values of the weights and then reaching a particular performance [46].
Performance evaluation: The performance of the neural network is to be evaluated at both training and testing stages in order to identify the number of errors in the results. Furthermore, the training process can be expressed in the following equations.
Let us consider the neural network given in Figure 4.3, which represents a single layer of the neural network. Also, the input of this layer is represented as x[n] and the output of it is represented as y[n]. Furthermore, w[n] is the weight value of this layer. So, wh[n] is a weight hidden layer and wo[n] is the weight of the output layer.
𝑦[𝑛] = 𝑥[𝑛]. 𝑤ℎ[𝑛] (4.10)
Figure 4.3. Layer structure of FFNN.
Where Y[n] is the final output of the neural network and hence, the general framework of this can be given in Figure 4.4.
4.2.2. Feed-Forward Neural Network (Freezing)
This project uses a feed-forward neural network model to predict the speaker's personality. Also, the features of each speaker are applied to the model for training, a model is established according to the parameters in Table 4.1. A three layers FFNN with 30,20 and 1 nodes are made, the reason for selecting this number of nodes is to reduce the delay taking by the model at the training and testing stages. According to Figure 4.5, the Levenberg–Marquardt algorithm is used to train the model and target performance (mean square error). Target must be set to very small values, so made equal to 1e-29. Three experiments are made as a timeline of enhancement to the model, in each experiment, the model is upgraded for the sake of performance enhancement. So-to-say, the first experiment has relied on the parameters given in Table 4.1. During the training stage of this experiment, results were noticed varying at every time model is restarted since the LM algorithm is allotting the weight values randomly and it repeats the same whenever the model is used. In order to monitor the model performance and to tackle this random nature of results, the experiment is repeated 100 times and results are recorded and then average results are recorded on examining the model performance.
Table 4.1. FFNN first experiment parameters.
TERM VALUES
TOTAL LAYERS Three
NODES DISTRIBUTION Thirty, twenty and one.
LEARNING ALGORITHM Built-in LM
MSE GOAL 1e-200
REPETITIONS 100
The second experiment was conducted according to the results monitored from the first experience, the performance of a neural network is realized for all 100 repetitions and hence the weight of every repetition is recorded. In addition, weight freezing
method involves pre-setting of the weight values of the FFNN model to that weight values that return the best cost. The method of freezing dispenses the need for training algorithms as readymade weights can be fed into the model with pre-determined performance. The selection of proper weight values depends totally on the previous experiment which involves the record of weights and their cost values. Figure 4.5 demonstrates the process of model freezing. The figure shows the program may be established to test all the weights and to select the weight that yields the best cost.
Figure 4.5. Weight freezing program flow diagram.
4.2.3. Particle Swarm Optimization Algorithm (PSO)
Particle Swarm Optimization is an optimization algorithm that inspired by the bird’s swarm motion. In order to implement the particle swarm algorithm, three parameters are required to be configured. Inertia coefficients, random variables (a1 and a2) and velocity. Furthermore, the inertia coefficient is set as constant variable and made as 2, whereas the random variable is to be configured where the summation of both must equal to four. Ultimately, random variables are made as a1=2 and a2=2. Eventually,
the velocity is made as constant variable which is equal to 1.5. particle swarm algorithm may work to generate limited (pre-defined) number of swarms in random fashion where each swarm is representing the search space of this optimization algorithm [47].
Swarms are being randomly generated in accordance to the value of the random variables a1 and a2. Those random variables are representing upper and lower limit of the swarm values. The total number of swarms is made equal to fifty swarms and each swarm is represented with X values where X is the number of items in the weight vector of feed forward neural network. Particle swarm algorithm is working to upgrade the swarms from the search space into the fitness function through several iterations and in accordance to the inertia coefficient and velocity values.
𝑉𝑖(𝑡) = 𝑊 + 𝐶1𝑎1[𝑝𝑖′(𝑡) − 𝑝𝑖(𝑡)] + 𝐶2𝑎2[𝑏(𝑡) − 𝑝𝑖(𝑡)] (4.12)
𝑉𝑖(𝑡 + 1) = 𝑉𝑖 𝑊 + 𝐶1𝑎1[𝑝𝑖′(𝑡) − 𝑝𝑖(𝑡)] + 𝐶2𝑎2[𝑏(𝑡) − 𝑝𝑖(𝑡)] (4.13)
Where the equation (4.12) demonstrates the velocity representation before the new swarm updating and equation (4.13) demonstrates the updated velocity after substitution the new swarm. The term W is representing the inertia coefficient and p(t) is the upgraded swarm and P’(t) is the previous swarm values. The best warm position according to the fitness function is termed as b(t) [47].
Particle Swarm Algorithm may update the swarms one by one into the fitness function generating a variable cost which must be minimized at the ended of the iterations. In this thesis, Particle Swarm Optimization is used for minimizing the mean square error while training the feed forward neural network. The fitness function is given in equation (4.14). If swarm (weight) vector is S and let the Feed Forward Neural Network output to be X, similarly the desired output (target) is to be T [48].
The third experiment is performed as another attempt to enhance the performance of prediction, so, a new algorithm is used as a training algorithm. Particle Swarm Optimization algorithm has a proven noticeable performance in optimizing the feed-forward neural network. Figure 4.6 shows the flow diagram of the PSO-FFNN algorithm. PSO algorithm is made to produce the weight values that yields an enhanced performance, the following steps are taken to execute the algorithm.
Process starts by generating the set of weights (swarms), which is also called population. These weights are used at the PSO algorithm. PSO will search for the best weight.
Searching of the best weight is done with help of cost function, cost functions are the mean square error of the results after training.
PSO will search the weight that minimizes the cost function by setting parameters such as velocity and inertia coefficients.
The results of PSO will be applied to the feed-forward neural network as weights. FFNN will be used further to predict the speakers.
![Figure 2.1. Speech processing taxonomy [4].](https://thumb-eu.123doks.com/thumbv2/9libnet/5399412.101976/22.892.173.748.532.968/figure-speech-processing-taxonomy.webp)
![Figure 3.2. a) Continuous time signal, b) Sampled time signal demonstration [28].](https://thumb-eu.123doks.com/thumbv2/9libnet/5399412.101976/34.892.223.624.523.786/figure-continuous-time-signal-sampled-time-signal-demonstration.webp)
![Figure 3.4. Cross-correlation resultant signal [31].](https://thumb-eu.123doks.com/thumbv2/9libnet/5399412.101976/38.892.235.724.130.478/figure-cross-correlation-resultant-signal.webp)
![Figure 3.6. Bottom (minimum) local maxima [31].](https://thumb-eu.123doks.com/thumbv2/9libnet/5399412.101976/39.892.232.721.130.426/figure-bottom-minimum-local-maxima.webp)
![Figure 3.7. Pre-emphasis filter a) Input signal, b) Output signal [34].](https://thumb-eu.123doks.com/thumbv2/9libnet/5399412.101976/40.892.223.698.126.514/figure-pre-emphasis-filter-input-signal-output-signal.webp)
![Figure 3.8. Overlapping window overview [35].](https://thumb-eu.123doks.com/thumbv2/9libnet/5399412.101976/41.892.263.708.158.343/figure-overlapping-window-overview.webp)