Research Brief 13/155
25
September 2013
WE ARE POSTPONING RETIREMENT
Seyfettin Gürsel*, Gökçe Uysal ve Ayşenur Acar
Executive Summary
The regulations allowing early retirement in 1990’s had made Turkey a country of young and early retired people. We have been seeking for reforms that will provide a solution for this unsustainable problem since 1999. Using data from the Income and Living Conditions Survey conducted by TURKSTAT, we show that the regulations which aim to postpone retirement age have started to kick in. We can clearly observe their impacts although still limited. Although the number of retired people above 35 years of age has increased from 5.800.000 to 7.100.000 between the years of 2006 and 2010, data indicates that both the number and the share of young retired people have declined. We observe that the number of retired people aged between the years of 35 and 49 has fell through 941,000 to 802,000 in the period under study and their share in the population has declined from 7.1% to 5.5%. It should be highlighted that women have significant role in this decline. Parallel to this decline in the share of the young, the share of retired people in the population aged above 50 years continues to increase.
Retirees are more likely to live in western regions of Turkey as expected as these regions are more populated. When we focus on the ratio of retirees to population aged above 35 years as an indicator for the density of retirees, the highest ratio belongs to East Marmara, followed by the Aegean. The lowest ratios are, as expected, in the Central East and Southeast regions.
Outlook on retirement
Retirement was introduced to the economic agenda in Turkey by Suleyman Demirel, a former prime minister of Turkey in 1990’s, with regulations which lead to early retirement. In that time period, a popular slogan used by unions was “pension in tomb”. The government of the time took this slogan seriously and allowed women to retire after 15 years and men after 20 years of employment. Hereafter, it became possible to retire while still at the age of 35 – 40 years. In meantime, life expectancy in Turkey was increasing towards 70 years of age. The government also declared that early retirement was going to expand job opportunities for the youth. In the late 1990’s, fiscal deficit had reached to substantial amount and economic instability had reached highest levels. The role of early retirement in this collapse was not substantial, but the new system was absolutely not
sustainable in the long run. Subsequently, IMF stipulated the conditions of financial aid to Turkey, i.e. structural reforms as well as a pension reform. This regulation aimed to defer retirement age. The impacts of the reform put into practice in 1999 are gradually seen in statistics. Now, the number of retirees increases rapidly but at the same time, we are postponing retirement.
In this research brief, we are exploring the dynamics of retirement. This brief will be followed by other briefs which will tackle other aspects of the issue like working retirees, income of retirees, etc. In this analysis, we are using both EUROSTAT data to compare Turkey to Europe, and the data from “Income and Living Conditions Survey” to study the demographics of retirement in Turkey and its regions.
** Prof. Seyfettin Gürsel, Betam, Director, [email protected]
Asst. Prof. Gökçe Uysal, Betam Vice Director, [email protected]
We retire earlier than Europeans
In Table 1, share of the retirees in both Turkey and Europe are provided. We are using data from Eurostat for this comparison. We use the age groups provided by Eurostat to study early retirement. We focus on the retirement ratios separately for the people aged between 40 and 64 years and the people aged above 65. Data shows that retirement ratios for the people above 65 years of age in Turkey (35.2%) are lower than in Europe (86%). Large part of this difference is caused by the differences in women’s retirement. This is the reflection of a very low female labor force participation rate in Turkey. Nevertheless, there is also a significant difference between men in Turkey and men in Europe. The retirement ratio of the men above 65 years of age is 75.1% in Turkey and 93.4% in Europe. This discrepancy is caused by a wider incidence of self-employment and hence informality. Population aged between 40 and 64, which are included to our analysis in order to reflect early retirement, point to a very different picture. In this age group, the retirement ratios for men are
relatively higher compared to Europe. According to the data, while the retirement ratio among the men between 40 and 64 years of age is 72.5% for Turkey, the ratio is 51.4% in Europe. In other words, men in Turkey are still getting retired earlier than in Europe.
Table 1 Share of retirement in the age groups of 40-64 and 65 and above
Age 40-64 Age 65 and above
Total Male Female Total Male Female
Turkey 25,6 72,5 8,7 35,2 75,1 8,9
AB-27 40,5 51,4 34,3 86,0 93,4 79,9
Source: EuroStat, 2011
The number of young retirees is decreasing in Turkey
In this research brief, we are exploring early retirement from 2006 to 2010 by using data from the Survey of Income and Living Conditions (SILC), published by TURKSTAT since 2006. Even though SILC only goes back to 2006, it provides reliable information about retirement. Moreover, SILC data allows analysis at the regional level (NUTS 1).
Individuals who declare that they are receiving pension income are defined as retired.1 This definition
does not include individuals who paid the required premiums and also completed the working day requirements for retirement, but who are not receiving pension payments due to the age limit for retirement. Unfortunately, data does not contain the necessary information to identify these individuals.
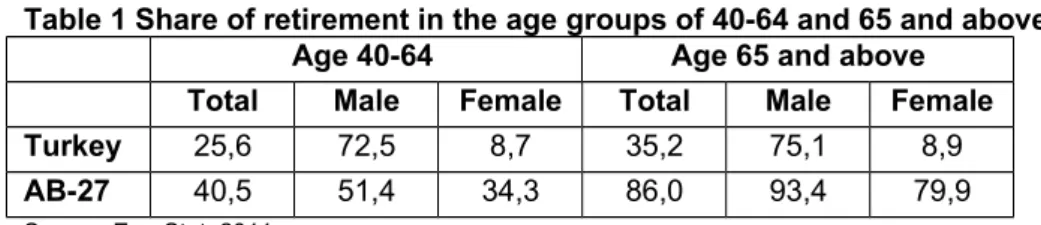
In Turkey, the number of retirees above 35 years of age approximately increased from 5.8 million in 2006 to 7.1 million in 2010 (Additional Table 1). Number of retirees has increased by 325 thousand yearly on average. Furthermore, although the employment rate has increased by 1.5 percent (through 41.5% to 43%) in the years between 2006 and 2010, number of retirees per employee significantly increased as well: In four years, the ratio of retirees to total employment has risen from 23.1% to 24.9%. (Figure 1 and Additional Table 2). These increases show that the financial burden of retirement has gradually deepened.
1 We take 35 years of age to be the minimum age for formal retirement. In the age group 15-34, there are some people who
receive pension payments. These people may receive such payments under certain specific conditions. For example, women, who do not work and whose retired husband or father have died, may be a part of this group. There were 8500 women who may fall into this category in 2010 (Additional Table 4). However, 223 thousand people of 7 million over the age of 35 have been receiving a pension despite having never worked before. We think that these people have been paying their social security taxes without working in a formal institution.
Figure 1 The ratio of retirees to population by age 35-40 40-44 45-49 50-54 55-59 60-64 65+ 0 10 20 30 40 50 60 0.4 3.2 19.6 31.8 39.5 41.2 48.7 0.2 1.8 16.2 34.5 43.0 46.4 52.9 Age group N u m b e r o f re t re e s/ A ge p o p u la t o n
Source: Income and Living Conditions Survey, Betam
However, if this reform had not been realized, this burden undoubtedly would have been much larger and would have increased more rapidly. An obvious proof is that the number of young retirees has been diminishing both relatively and absolutely. In the age group between 35 and 49, the existing number of retirees was 941 thousand in 2006; this number is decreased to 802 thousand in 2010. Decreases are also observed within each age group (35-39, 40-44 and 45-49). Concordantly, the ratio of the number of retirees to population is systematically falling in these age groups. As shown in Figure 1, the curve for 2010 is below of that of 2006. In total, the share of retirees in the population aged between 35 and 49 decreases from 7.1% to 5.5%. The impact of the reform implemented in 2000’s is reflected in the statistics. However, note that age 50 poses a break point and beyond this limit, both the number and also the share of retirees are increasing (Figure 1 and Additional Table 1).
Women are retiring later than previously
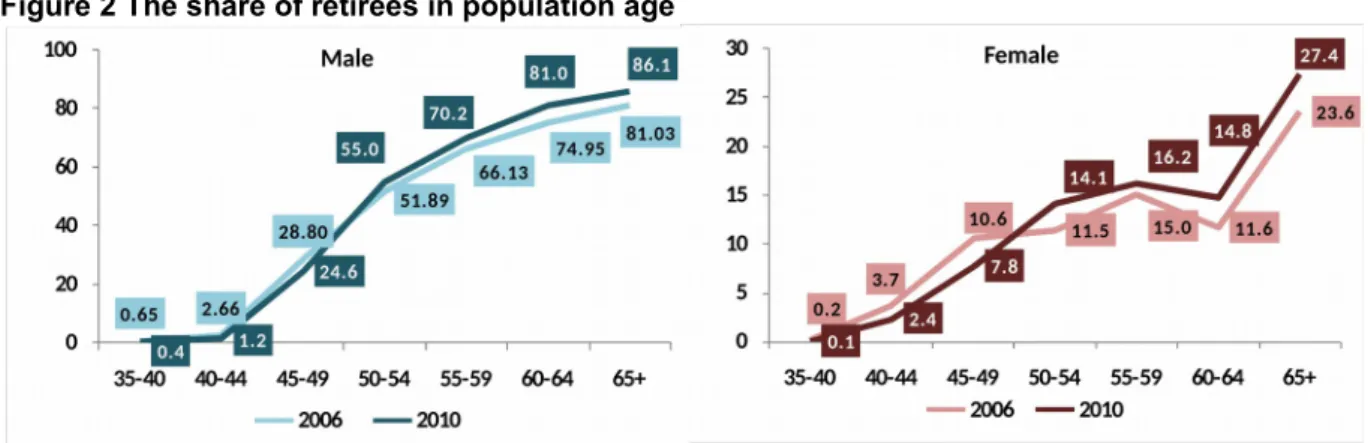
When we analyze the retirees by age and gender, we find that the average age of retirees is increasing due women who have started to retire later (Figure 2). The number of retired men has decreased from 645 thousand to 575 thousand and the number of retired women has decreased from 296 thousand to 227 thousand from 2006 to 2010. Although the declines are similar in magnitude, note that the number of retired women is approximately half the number of retired men, marking a remarkable percentage change for women. In other words, we can conclude regulations affected women’s early retirement relatively more. Among men, the number of young retirees decreased by 10.7%, while the number of young retirees in women decreased by 23.3% (Additional Table 2). Note that age 50 is an approximate breaking point for both genders. Put differently, the number and the share of retired above the age of 50 increases drastically both for men and women. The ratio of retirees to population aged above 50 years is persistently increasing from 51.9% to 81%. Also, while the ratio of retired women to population aged between the years of 50 and 64 is about 15%, it goes up to 27.4% for its population aged above 65 years. We suppose that this increase comes from the women who start receiving pension payments of their husbands’ following the latter’s death.
Figure 2 The share of retirees in population age
Source: Income and Living Conditions Survey, Betam
East Marmara has the largest share of retirees
As expected, population distribution of retirees in Turkey is closely related to the distribution of the general population. In 2010, 1.3 million of 7.1 million retirees (18.3%) are living in Istanbul. Northeast Anatolia has the lowest share at 1.9%. However, once we consider the share of retired in the relevant population by region, the picture changes. Three regions have higher rates than the average, which is 24.9%. The highest rate is in East Marmara at 26.6%, followed by the Aegean Region at 28.2%. The third highest rate belongs to West Black Sea. Southeast Anatolia, Northeast Anatolia and Central East Anatolia take the last three places with the lowest rates, 17.5% , 18.3% and 18.8%, respectively. This is an expected finding given the strong relationship between retirement and formal work. Note further that retirees’ regional distribution seems less unequal than expected.
Table 2 Number of retirees / Population age by regions (2010)
2010 Total of retirees (000) Regional distribution of retirees (%) Population (000) Total of retirees / Population (%) TR1- İstanbul 1,308 18.3 5,075 25.8 TR2- West Marmara 380 5.3 1,502 25.3 TR3- Eagean 1,212 17.0 4,302 28.2 TR4- East Marmara 821 11.5 2,825 29.1 TR5- West Anatolia 686 9.6 2,735 25.1 TR6- Mediterranean 872 12.2 3,771 23.1 TR7- Central Anatolia 349 4.9 1,523 22.9
TR8- West Black Sea 559 7.8 2,105 26.6
TR9- East Black Sea 285 4.0 1,156 24.6
TRA- Northeast Anatolia 133 1.9 727 18.3
TRB- Centraleast
Anatolia 195 2.7 1,039 18.8
TRC- Southeast Anatolia 343 4.8 1,967 17.5
Turkey 7,144 100 28,727 24.9
Source: Income and Living Conditions Survey, Betam
Dependent population has been increasing due to early retirement
Turkish population is aging, rapidly. The burdens of aging population have already started to direct our economic policy. Early retirement indicates that the dependent population may increase faster than the elder population. In this sense, we will discuss early retirement, retirees, their income and living conditions more in the upcoming years. Further research and awareness is needed for evidence-based discussions.
Appendix
Additional Table 1: Number of retirees in age population
2006 2010 Retirees (000) Age population (000) Retiree/Age population (%) Retirees (000) Age population (000) Retiree/Age population (%) 35-40 21 4,947 0.4 11 5,374 0.2 40-44 138 4,357 3.2 85 4,843 1.8 45-49 782 3,983 19.6 706 4,351 16.2 50-54 964 3,030 31.8 1,310 3,797 34.5 55-59 968 2,451 39.5 1,311 3,048 43.0 60-64 795 1,929 41.2 1,071 2,307 46.4 65+ 2,111 4,331 48.7 2,650 5,007 52.9 Total 5,778 25,028 23.1 7,144 28,727 24.9
Source: Income and Living Conditions Survey, Betam
Additional Table 2 Number of retirees in age population by gender
Age grou p Male Female 2006 2010 2006 2010 Retirees(0 00) Retiree s/Age populati on (%) Retirees(000) Retiree s/Age populati on (%) Retirees(000) Retiree s/Age populati on (%) Retirees(000) Retirees/ Age populatio n (%) 35-40 15,855 0.6 9,557 0.4 4,661 0.2 1,761 0.1 40-44 58,935 2.7 28,246 1.2 78,749 3.7 57,240 2.4 45-49 569,722 28.8 537,346 24.6 212,676 10.6 168,207 7.8 50-54 791,394 51.9 1,041,696 55 172,353 11.5 268,514 14.1 55-59 775,741 66.1 1,061,566 70.2 192,194 15 249,044 16.2 60-64 675,187 75 893,080 81 119,744 11.6 177,642 14.8 65+ 1,537,977 81 1,876,298 86.1 573,148 23.6 773,462 27.4 Topl am 4,424,812 36.5 5,447,789 38.9 1,353,524 10.5 1,695,871 11.5
Additional Table 3 Number of retirees / Total employment 2006 2010 Retirees (000) Total employment (000) Number of retirees / Total employment (%) Retirees (000) Total employment (000) Number of retirees / Total employment (%) 5,778,336 20,423,000 28.3 7,143,659 22,594,000 31.6
Source: Income and Living Conditions Survey, Betam
Additional Table 4 Number of retirees in the age between 15-34 Age
group
2006 2010
Male Female Male Female
15-19 - - 592
-20-24 - - 1,080
-25-29 - - 4,072
-30-34 4,691 - 1,325 1,444