1
Measuring Employees’ Psychological Capital Using Data Mining Approach
Uju Violet Alola1,2 & Donald Douglas Atsa'am3 First published: 10 November 2019
https://doi.org/10.1002/pa.2050
Abstract
In this research, the Logistic Regression model was employed to develop a classifier that measures psychological capital of workers in organization. Psychological capital (PsyCap) is the positive state of an individual, comprising of self-efficacy, optimism, hope, and resilience. Employees with high psychological capital contribute positively to objectives and business strategy of an organization. An experimental dataset comprising of the psychological capital information of 329 employees in an organization was used to fit a data mining classification model. To ensure model accuracy, 220 observations were used as training set while 109 were set aside to validate the model. Various statistical tests for goodness of fit and predictive accuracy were deployed to test model performance. The model has the ability to classify an individual‘s psychological capital into either high or low class with a predictive accuracy of 93%. The classification model is expected to serve as a tool in human resource management when measuring psychological capital of employees during recruitment interviews and promotion appraisals.
Keywords: Psychological capital, Classification, Data Mining, Logistic Regression, Predictive
Accuracy, Confusion Matrix.
1 Author Information
Reprint Address: Alola, UV (reprint author)
Istanbul Gelisim Univ, Fac Econ Adm & Social Sci, Istanbul, Turkey. E-mail Addresses: [email protected] 2 Istanbul Gelisim Univ, Fac Econ Adm & Social Sci, Istanbul, Turkey
South Ural State Univ, Sch Econ & Management, Lenin Prospect 76, Chelyabinsk 454080, Russia 3 Univ Agr, Dept Math Stat & Comp Sci, Makurdi, Nigeria
2 1. INTRODUCTION
For decades, researchers have paid close scrutiny to the most important factors affecting performance (Ottenbacher, 2007; Salam, 2014) and what provides the level of firms‘ competitiveness (Cho and Pucik 2005; Hult et al., 2005; Damanpour et al., 2009), growth and enhanced profitability. Several literature investigate the impact of human resource management practices in diverse organizations and industry, either directly or indirectly, as it affects organizational performance (Chang et al., 2011; Beugelsdijk, 2008; Cabello et al., 2011; Chen and Huang 2009) and strengthen organization. The quest of whom to recruit by an employer is of utmost benefit to the organization. During the recruitment process, organization looks out for the best candidates to hire, in considerations of things like academic qualifications and years of experience, efficiency and technical know-how. Breaugh (2013) pointed out that the primary purpose of recruitment is to bring an individual that is efficient and can remain in the position for a satisfactory period of time. Therefore, human resource managers (HRM) are often faced with the task of recruiting the best employee for an organization in a dynamic and competitive global work environment. Organizations are affected by frequent employee turnover thus, recruiting and educating a new employee is costly (Alola and Alola, 2018; Alola et al, 2019).
Existing literature indicates that positive psychological capital can produce positive result, self-development and improved individual performance (Paterson et al., 2014), financial performance (McKenny et al., 2013), organizational commitment (Luthans et al., 2008), job performance (Avey et al., 2011; Luthans et al., 2007), and subdue the desire to quit (Avey et al., 2009). It is on this premise that HRM are in dire need to find a better way for effective recruitment in different organizational sectors. According to Luthans et al., (2015), psychological capital is a four positive state of an individual that is measurable. These include self-efficacy
3
(efficacy), optimism, hope, and resilience. Efficacy is the confidence to undertake a given task successfully despite challenges, while optimism is the ability to make a positive ascription towards success, both now and in the future. Hope, on the other hand, is the ability to persevere until set goals are achieved, while resilience is the ability to self-recover and bounce back when faced by obstacles and problems (Luthans, Youssef and Avolio, 2007).
Employees with high psychological capital perform better in an organization than those with low psychological capital (Kappagoda et al., 2014; Bouckenooghe et al., 2015). Although the four components that constitute psychological capital can stand as individual constructs, Luthans and Youssef (2017), Luthans, Avolio, Avey and Norman (2007) pointed out the significance of combining them to measure an individual‘s overall worth. All the components of psychological capital share a common sense in goal pursuit, control and common objective. Interestingly, these constructs interact with each other to make a meaningful work setting, sharing positive appraisal of situations and possibility of achievement of set goals (Luthans et al., 2007). Additionally, optimism and resilience are more outward oriented while hope and efficacy share an internal focus, contributing to both external and internal resources to combat organizational stress.
Basically, an individual‘s psychological capital is measured using the Psychological Capital Questionnaire (PCQ) (Luthans, Youssef and Avolio, 2007). Several versions of the PCQ have been presented in various studies, the most prominent of which is the PCQ-24 reported in Luthens et al. (2007). The PCQ-24 consists of 24 items that seek responses on a 6-point scale for purpose of assessing and individual‘s PsyCap. Some modifications to the PCQ-24 have been reported in some literature. For example, Paek et al. (2015) presented a 20-item PCQ on a 5-point scale questionnaire for specific use in measuring PsyCap of hospitality employees.
4
Furthermore, Lorenz et al. (2016) presented a 12-item German self-report sxale (CPC-12) questionnaire for measuring PsyCap in German context. It should be noted that all versions of the PCQ are manual approaches where respondents provide answers on a scaled questionnaire that assists in evaluating their PsyCap worth. It is a known fact that manual approaches are faced with several problems including waste of time and energy. Against this backdrop, this research is motivated to develop a statistical model, using data mining approach, which will serve the purpose of measuring psychological capital. When the classification model has been successfully developed in this research, it can be possible to implement the model into a software application in subsequent research.
The purpose of this study is to develop a model that can classify an employee‘s psychological capital as high or low. This would be achieved by deploying the classification (Agarwal et al., 2012) technique of data mining (Ali and Senan, 2017) to fit a logistic regression model (Hosmer and Lemeshow, 2013). The model will aid human resources managers to predict whether an employee has high or low psychological capital. It is meant to be used as a measurement tool during job recruitment and promotion appraisals with specific regard to psychological capital. Data mining is the process of extracting useful but hidden information from existing data sources (Han and Kamber, 2000). Classification is one of the techniques of data mining that is concerned about developing models that accurately distinguish one data class from another (Al-Radaideh and Nagi, 2012). After this is done, the developed model is then used to predict the class of objects whose class is not known. Logistic regression belongs to a group of models referred to as generalized linear models (Yussuf et al., 2012). It serves in developing models for prediction where the classes to be determined are binary, such as passed/failed,
5
high/low, present/absent. Since the psychological capital to be investigated in this research has binary outcome of high/low, the logistic regression will be the appropriate tool to use.
2. RELATED LITERATURE
2.1 Psychological Capital Constructs
Psychological capital (PsyCap) is the positive state of an individual, comprising of four components: self-efficacy, optimism, hope, and resilience (Antunes, Caetano and Cunha, 2017). Efficacy is the positive psychology of an individual‘s conviction on the ability to carry out a given task effectively and efficiently, within a given time frame (Luthans and Youssef, 2017; Stajkovic and Luthans, 1998). According to Bandura (2012), individuals with high efficacy are capable of achieving a given task despite challenges. Efficacy enhances employee confidence which has been linked with work-related outcomes (Luthans and Youssef, 2017; Alola, Avci and Ozturen, 2018). Employees with high level of efficacy are likely to mobilize, motivate and exhibit energy, accept challenges, and exert additional efforts to achieve goals. Most researches have linked self-efficacy with several positive organizational outcomes. For instance, Van et al. (2011) link self-efficacy with work engagement, Brown, Hoye and Nicholson (2012) link efficacy with job satisfaction, while Feltz, Short and Sullivan (2008) link efficacy with performance. Efficacy research has been fruitful for organizations by unraveling its influence over developmental processes, thus making it a relatively more well-established part of psychological capital. Efficacious employees have a clear target and source for resources to achieve goals (Breevaart, Bakker and Demerouti, 2014).
According to Kobau et al., (2011), optimism as an explanatory style that attributes positive events to personal and permanent causes, while interpreting negative events as external, temporary, and situational. It enables one to view things in a positive light. Luthans et al. (2007)
6
and Lu et al. (2018) further stressed that optimistic employees are associated with positive outcomes like, career success, psychological well-being and job performance. Additionally, optimistic individuals are highly attached to the organization where they work, which is one of the attributes of work engagement (Avey et al., 2010). Highly optimistic individual are flexible and pragmatic (Carver and Scheier, 2002), focusing on a positive outcome in attainment of a desired goal in the future (Alarcon et al., 2013). Moreover, Huang and Luthans et al. (2015) opined that pragmatic nature of individuals helps to capitalize on strength and opportunity, accepting the fact that situations beyond ones control will surface in the future.
Hope is a motivational state of wishful thinking that is based on successful achievement towards a desired goal (Snyder et al., 1991). Hope is distinguished from other types of psychological capital because of its planned part and the ability to set a realistic goal. According to Huang and Luthans et al. (2015), when a planned work is not futile, hope has the ability to look for alternative means to success.
Resilience is the ―positive psychological capacity needed to ‗bounce back‘ from adversity, uncertainty, conflict, failure, or positive change, progress and increased responsibility‖ (Luthans, 2002a). Positive emotion enhances resilience even in the context of a negative event (Tugade et al., 2004), and increases an individual‘s resilience level (Fredrickson & Joiner, 2002). This includes not only recovering from a setback but also being able to triumph in challenges. According to Salanova et al. (2005), employees‘ mental attitude and behavior are very vital in carrying out their functions in an organization. Alola and Alola, (2018), pointed out that resilience has a protective effect on the employee which reduces turnover intention. This has the long term positive effect on employees‘ performance, organizational outcomes and customer satisfaction.
7
.
2.2 Data Mining and Classification
Data mining, according to Han and Kamber (2000) is the process undertaken to extract useful but hitherto hidden information from large data sources. There are seven steps involved, including cleaning, integration, selection, transformation, mining, evaluation, and presentation (Al-Radaideh and Nagi, 2012; Sumathi et al., 2016). During the cleaning step, data that is irrelevant to the task at hand is eliminated. At the integration step, the data for mining are combined into a single dataset. This is necessary when the data is obtained from multiple sources. The selection step is when relevant fields of the data to be mined are decided upon according to the task at hand. The transformation step scales the data into summarized forms to ease the mining process, while the mining step is where useful patterns are extracted from the data. During pattern evaluation, the validity of the extracted knowledge is determined, while the knowledge presentation step makes available to the public the useful information extracted. Wu (2013); Wu (2017) identify three major techniques of data mining as clustering, association rule mining, and classification. Clustering models are used to group similar data objects into same classes called clusters. Association rule mining technique is concerned about developing models that extract the relationship existing among data items in a database. On the other hand, the classification technique is about developing classifiers that are capable of distinguishing one class of data from another. After developing the classifier, the model can then be used in predicting the class label of objects with unknown classes. The classification technique has been applied in several studies to develop prediction models. Norouzi et al. (2016) developed a classification model to detect and classify malware according to their behaviour. The model has the capacity to identify malware features present in particular software or network facilities. This scheme is based on
8
known characteristics of malicious codes and can predict the presence of malware in information technology equipment.
Another classification model was developed by Li et al. (2012) to detect fraudulent transactions on banking platforms, such as ATMs. The study collected necessary features that characterize financial fraud, such as suspicious bank accounts, transaction history, transaction pattern, etc. After examining these features, rules were developed accordingly that can classify transactions as fraudulent and non-fraudulent. Algur et al. (2016), on the other hand, constructed a model that relates to educational data mining. The model, fitted on an academic database, has ability to predict whether a student will be qualified for recruitment after their course of study. The prediction is premised on the student‘s academic performance and other factors captured in the database. Zmiri et al. (2012) in their research developed a classifier capable of classifying patients in the emergency ward of a hospital. The classification is done according to the degree of ailments. The model is designed to assess variables such as type of injury, vital signs, patient complaints, and medical history, etc., and then place patients into one of the five severity grades adopted in the investigation.
No classification model has been developed, to the knowledge of the researchers, to classify psychological capital of individuals in the high or low class labels. This gap needs to be addressed.
2.3 Logistic Regression Model
Logistic regression avails an effective means for modeling classification problems (Liu et al., 2013). It is one of the discriminant analysis tools that are used in predicting the classes of a set of observations, consisting of one dependent variable and several independent variables (Rawlings et al., 1998). It is based on the logistic function (Kleinbaum and Klei, 2010) where values must lie between 0 and 1. These values correspond to class labels thus; the probabilities indicating the
9
possibility of an observation belonging to a certain class are modeled. The highest probability generated from the logistic function determines the class label of an observation (Liu et al., 2013).
Logistic regression models are appropriate when the dependent variables to be predicted have binary outcome, such as high/low, passed/failed, accepted/rejected, etc. (Hosmer and Lemeshow, 2013). In practice, 0 relates to the negative outcome while 1 to the positive outcome. Take P to be the proportion (probability) of all the observations with positive outcome, then 1-P will be the probability of negative outcomes. Probability represents the ratio of the number of occurrences that will favour an outcome to the total number of occurrences. It ranges between 0 and 1 (Sperandei, 2013). The Odds are a measure of the ratio between probabilities (Montano et al., 2014). That is, the probability of an occurrence favourable to an outcome and the probability of an occurrence against the same outcome. The Odds, defined by
1
P P
, run between 0 and
infinity. The logarithm of the Odds is called the log odds or the logit. The logistic regression equation (Montano et al., 2014) is therefore given by
0 1 1 2 2 ln ... 1 n n P b b X b X b X P
where b0is the intercept, and bi‘s running from 1 to n, are the coefficients of regression to be estimated from given data. On the other hand,Xi‘s are data values for each independent variable. From equation (1), the value of P can be obtained as
00 1 111 2222
... 1 ... n n n n exp b b X b X b X P exp b b X b X b X Let PA be the probability of favourable outcome in group A, and PB be the probability of favourable outcome in group B. Then, the odds ratio is defined by
(1)
10
/ 1 ( ) / 1 A A B B P P Odds Ratio OR P P The odds ratio serves the purpose of comparing proportions among groups, such as employed versus unemployed; males versus females.
3. METHODOLOGY
3.1 The Experimental Dataset
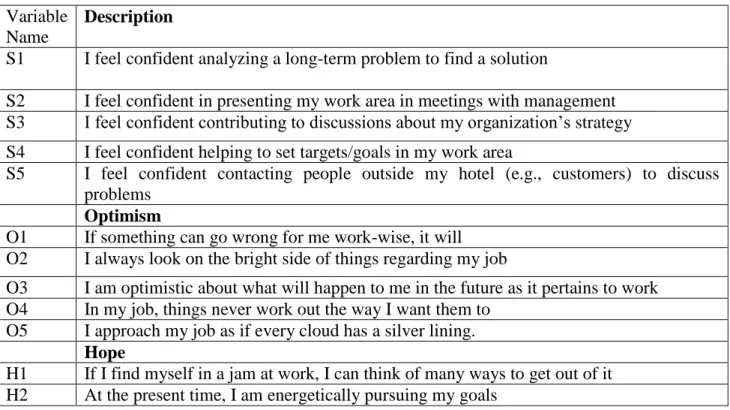
The psychological capital dataset used in this experiment was collected from 329 hospitality employees in Nigeria. The questionnaire reported by Paek et al. (2015) was distributed to the employees to assess their PsyCap. Twenty items that determine an employee‘s psychological capital were skewed to run from 1 (minimum) to 5 (maximum), corresponding to Strongly Disagree and Strongly Agree, respectively. The items of PsyCap were used to form the dataset variables as shown in Table 1.
Table 1. Dataset Variables Variable
Name
Description
S1 I feel confident analyzing a long-term problem to find a solution
S2 I feel confident in presenting my work area in meetings with management S3 I feel confident contributing to discussions about my organization‘s strategy S4 I feel confident helping to set targets/goals in my work area
S5 I feel confident contacting people outside my hotel (e.g., customers) to discuss problems
Optimism
O1 If something can go wrong for me work-wise, it will O2 I always look on the bright side of things regarding my job
O3 I am optimistic about what will happen to me in the future as it pertains to work O4 In my job, things never work out the way I want them to
O5 I approach my job as if every cloud has a silver lining.
Hope
H1 If I find myself in a jam at work, I can think of many ways to get out of it H2 At the present time, I am energetically pursuing my goals
11
H3 There are lots of ways around any problem that I am facing now H4 I can think of many ways to reach my current goals
H5 At this time, I am meeting the work goals I have set for myself
Resilience
R1 When I have a setback at work, I have trouble recovering from it and moving on R2 I can be ―on my own,‖ so to speak, at work if I have to
R3 I usually take stressful things at work in my stride
R4 I can get through difficult times at work because I have experienced difficulties before R5 I feel I can handle many things at a time at my job
As defined in Table 1, twenty (20) independent variables were generated for the dataset as S1, S2, S3, S4, S5, O1, O2, O3, O4, O5, H1, H2, H3, H4, H5, R1, R2, R3, R4, R5. For example, variable S4 is ―I feel confident helping to set targets/goals in my work area‖. For each variable, a respondent can score from 1 to 5 based on the response selected.
3.1. Data Preprocessing
In order to prepare the data for modeling, any record that had missing or multiple values in an entry was discarded from the dataset. For each observation, the values for all the 20 variables were summed up to obtain a total score. The total score obtainable by an employee is 100. Decision boundary of 65 (out of 100) was used to classify an employee as having high psychological capital. All totals below 65 were classified as low psychological capital. Based on the fact that some few questions in the PCQ are on reverse scale, a threshold of 65 and not 60 was chosen to categorize an individual as having high PsyCap.
A binary dependent (outcome) variable was defined which takes only 0 or 1; where 0 indicates low psychological capital, and 1 represents high psychological capital. The next task was to normalize the data. Data normalization (Ali and Senan, 2017) is the process of transforming a dataset from its original scale to a specific scale before models are fit on the data. This is done in order to coerce all values to specific scales to guarantee more accurate model
12
results. In this experiment, original entries ran from 1 to 5 but were however, normalized to run between 0 and 1.
3.2 Model Construction and Preliminary Results
Before constructing models on the dataset, the data was subdivided into two: the training set and testing or validation set. The first 220 records out of the 329 observations were used to train the models; while the rest of 109 observations were used to test model accuracy. The testing set was not used in fitting the models but strictly for validation purposes. The result in Table 2 was produced after the logistic model was fit on the entire 20 variables of the dataset.
Table 2. Full Model
Estimate Std.Error Estimate Std.Error
(Intercept) -720.6 232233 H1 90.1 193953 S1 159 164834 H2 47.9 123101 S2 4.5 188515 H3 72.3 214841 S3 36.7 101319 H4 83 328985 S4 47.3 308678 H5 15.7 269991 S5 60.2 185049 R1 40.2 56801.9 O1 72.7 169832 R2 76.7 75332.3 O2 49.3 447391 R3 58.8 218321 O3 -17.8 425568 R4 15.5 132099 O4 57.5 204846 R5 92.3 113203 O5 73 198180
Two types of coefficients are reported in the output of Table 2, the Estimate and the Standard Error. Estimate represents the amount by which the log odds of the outcome will change for a unit increase in the predictor variable. For instance, it could be interpreted from the output as, for every one unit change in the variable S1, the log odds of a high psychological capital versus low psychological capital increases by 159 logits. For every one unit change in O3, the log odds of a high psychological capital versus low psychological capital decreases by -17.8 logits. The Standard Error coefficients quantify the uncertainty in the values of Estimate. It could be
13
interpreted from the output in Table 2 as, the Full Model is uncertain about the Estimate coefficient of S1 by 164834.
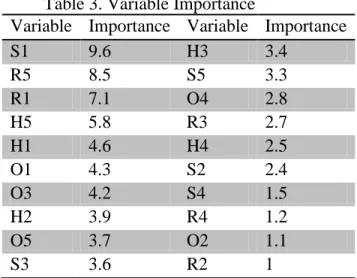
The results shown in Table 2 indicate that the Full Model is not good for prediction due the large Standard Error values for each variable. The way forward was to drop some variables from the full model to fit a reduced model. This was achieved by running the Variable Importance (Hosmer and Lemeshow, 2013) function in order to determine which variables to discard. The importance of individual variables is determined by evaluating the absolute value of the t-statistic (Hosmer and Lemeshow, 2013) for each parameter. When this was done, the results in Table 3 were obtained.
Table 3. Variable Importance
Variable Importance Variable Importance
S1 9.6 H3 3.4 R5 8.5 S5 3.3 R1 7.1 O4 2.8 H5 5.8 R3 2.7 H1 4.6 H4 2.5 O1 4.3 S2 2.4 O3 4.2 S4 1.5 H2 3.9 R4 1.2 O5 3.7 O2 1.1 S3 3.6 R2 1
The variables are listed in descending order of importance. Variable S1 is the most important while R2 is the least important. Considering the importance of each variable as shown in Table 3, twelve less important variables were dropped and a reduced model, Model_Two, was fit on the dataset consisting of only eight variables.
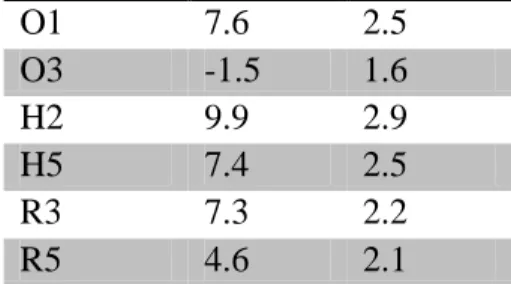
Table 4. Model_Two
Estimate Std.Error (Intercept) -31.9 6.5
S1 12.1 2.9
14 O1 7.6 2.5 O3 -1.5 1.6 H2 9.9 2.9 H5 7.4 2.5 R3 7.3 2.2 R5 4.6 2.1
The output of Model_Two presented in Table 4 shows an improvement over the full model in Table 2. It could be observed that Standard Error values have significantly dropped. This is indicative of the fact that reducing the model has led to better results. Still making reference to the importance of individual variables, one more variable was dropped from Model_Two to fit Model_Three, consisting of seven variables as shown in Table 5
Table 5. Model_Three Estimate Std.Error (Intercept) -32.5 6.5 S1 11.3 2.7 S3 4.3 2.5 O1 7.4 2.5 H2 9.6 2.9 H5 7.2 2.4 R3 7.3 2.2 R5 4.8 2.1
By comparing the results of Model_Two with the results of Model_Three, no significant difference exist among these models at a glance. This indicates that reducing the models further will have no effect on goodness of model fit. The preliminary results of the three models: Full Model, Model_Two, and Model_Three, show that the Full Model is not a good candidate model. This is immediately apparent due to the large Standard Errors of this model. Based on this observation, the Full Model was therefore dropped. The low Standard Errors exhibited in
15
Model_Two and Model_Three are imperative of good candidate models. As a result, further evaluation was carried out in the next section to decide on which of them is the best.
4. RESULTS AND DISCUSSION 4.1 Evaluation of Goodness of Model Fit
Two stages of evaluation are necessary to determine a good model (Rawlings et al., 1998). The first stage is concerned about how well the model fits the dataset in question, while the second stage evaluates the accuracy of the model in predicting the class of vectors whose class is unknown. Three techniques, namely, the McFadden‘s test (Hausman and McFadden, 1984), Likelihood ratio test (Fox, 1997), and Analysis of Deviance test (Johnston and DiNardo, 1997), were employed to evaluate how well Model_Two and Model_Three fit the psychological capital dataset.
4.1.1. McFadden’s Pseudo R2 Test
This test provides a mock form of least squared estimation similar to what obtains in linear regression (Hausman and McFadden, 1984). The log likelihood values of both the model and its intercept are used in calculating the McFadden‘s R-squared (Kleinbaum and Klei, 2010) and is given by 1-[ln(model)/ln(intercept)]. The McFadden‘s values run between 0 and 1, where values closer to 0 indicate that the model being evaluated does not fit well. The results of this test are shown in Table 6.
Table 6. McFadden‘s Pseudo R2 Test McFadden
Model_Two 0.7 Model_Three 0.7
The McFadden‘s Pseudo R2
test produced same results for both models as shown in Table 6. A value of 0.7 indicates that Model_Two and Model_Three have good fit.
16 4.1.2. Likelihood Ratio Test
The likelihood ratio test provides a way of comparing the goodness of fit among two models in which one model has more predictors than the other (Long, 1997). Since there are two competing models in this investigation, this test was considered appropriate. It could be recalled that Model_Two includes 8 predictors, while Model_Three has 7 predictors. In order to determine which of the models is best, the following hypotheses are considered.
H0: the smaller model is best. HA: the larger model is best.
If the test produces a p-value of less than 0.05 (Hosmer and Lemeshow, 2013), then H0 is rejected, indicating that the larger model is the best. The result of the log likelihood test of Model_Two with Model_Three is presented in Table 7.
Table 7. Likelihood Ratio Test LogLik Pr(>Chisq) Model_Two -32.0
Model_Three -32.5 0.35
The result in Table 7 shows that Model_Two and Model_Three have log likelihoods of 32 and -32.5 respectively. The test yields a p-value of 0.35, thus H0 is accepted which means Model_Three fits better than Model_Two.
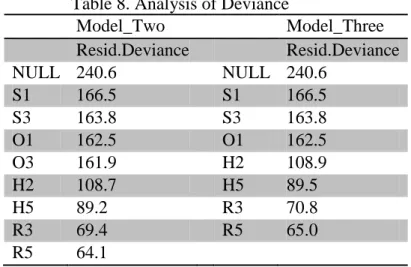
4.1.3. Analysis of Deviance Test
The Deviance statistic is a chi-square value (Fox, 1997) that measures the difference between observed and predicted values in a dataset. A smaller deviance indicates a better fit. The analysis of deviance tables of Model_Two and Model_Three, as presented in Table 8, report two types of deviances: null deviance and residual deviance. The null deviance is concerned about how well a
17
model predicts the outcome variable using only the intercept. The residual deviance indicates how well the outcome variable is predicted by each independent variable in the model (Liu et al., 2013). If a wide margin exists between the null deviance and residual deviance, it is imperative that the model fits well.
Table 8. Analysis of Deviance
Model_Two Model_Three Resid.Deviance Resid.Deviance NULL 240.6 NULL 240.6 S1 166.5 S1 166.5 S3 163.8 S3 163.8 O1 162.5 O1 162.5 O3 161.9 H2 108.9 H2 108.7 H5 89.5 H5 89.2 R3 70.8 R3 69.4 R5 65.0 R5 64.1
It could be observed from Table 8 that, as variables are being added to the models, the deviance keeps dropping. This continues until the program obtains the smallest possible deviance that represents the best fit. The best fit of Model_Two is 64.1 while that of Model_Three is 65.0. Both models could be said to have good fit since wide margins exist between the null and residual deviances.
4.2 Evaluation of Predictive Power of Models
The goodness of fit evaluation performed on Model_Two and Model_Three indicates that both models fit the psychological capital dataset well. The next issue of concern is, which of these models has the ability to accurately classify unknown employees into either the high psychological capital or low psychological capital class? The 109 observations earlier set aside as testing set were used to determine the level of predictive accuracy of these models. Three
18
techniques were used in the evaluation: threshold probabilities, ROC curve and AUC (Hopley and Schalkwyk, 2011), and confusion matrix (Fox, 1997).
4.2.1. Evaluation with Probabilities Boundary of 0.5
The accuracies of Model_Two and Model_Three were evaluated separately by running a procedure of the form: If P(Outcome = 1|Xi) > 0.5 then Outcome = 1, otherwise Outcome = 0. This procedure calculates the probability P, for each observation Xi, in the training set. If the resulting probability is greater than 0.5, then the Outcome is 1 (high psychological capital), otherwise the Outcome is 0 (low psychological capital). When this test was run on the two models, their predictive accuracies were obtained as shown in Table 9.
Table 9. Accuracy with Probability Boundary 0.5 Accuracy
Model_Two 0.94 Model_Three 0.92
From Table 9, it could be observed that Model_Two has a slightly better predictive power than Model_Three. Further tests are required to conclude on which of these models is best.
4.2.2. ROC curve and AUC Test
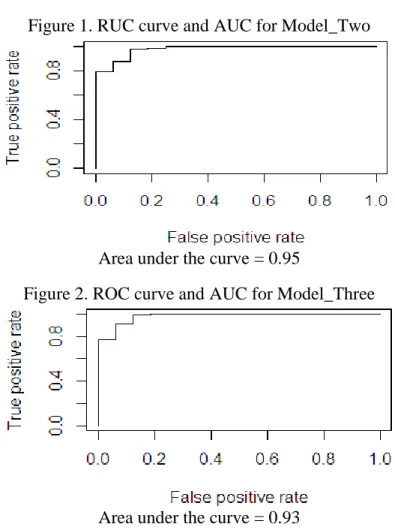
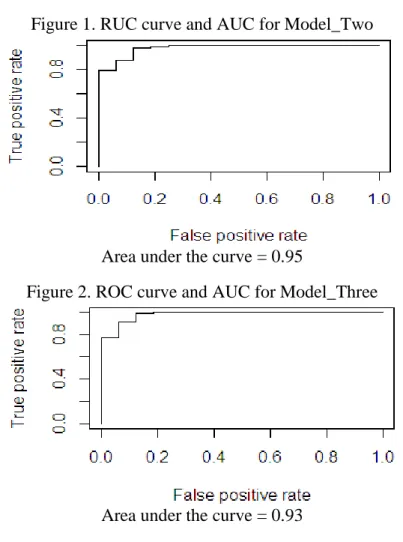
The ROC (Receiver Operating Characteristics) curve (Hopley and Schalkwyk, 2011) shows graphically the tradeoffs between positive outcomes in the data that are correctly predicted as positive, and the negative outcomes that are incorrectly predicted as positive by the model. On the other hand, the AUC (Area under the Curve) measures the area under the ROC curve (Hopley and Schalkwyk, 2011). It takes values between 0.5 and 1. Models that have AUC values closer to 1 have better predictive ability.
19
Figure 1. RUC curve and AUC for Model_Two
Area under the curve = 0.95
Figure 2. ROC curve and AUC for Model_Three
Area under the curve = 0.93
The ROC curves and AUC values of Model_Two and Model_Three are presented in Figure 1 and Figure 2 respectively. These results show that both models have high predictive accuracies.
4.2.3. Confusion Matrix
The confusion matrix tabulates a summary of total correct predictions versus incorrect predictions (Montano et al., 2014). Four quantities are represented in the confusion matrix as: true positives (TP), false positives (FP), true negatives (TN), and false negatives (FN). The TP is the correct prediction of all observations with outcome 1, FP is the incorrect prediction of all observations with outcome 0, TN is the correct prediction of all observations with outcome 0, and FN is the incorrect prediction of all observations with outcome 1.
20
The confusion matrices of Model_Two and Model_Three are presented in Table 10. Table 10. Confusion Matrices
Model_Two FALSE TRUE 0 14 2 1 6 87 Model_Three FALSE TRUE 0 14 2 1 7 86
Model accuracy can be obtained from confusion matrix by,
TP TN
TP TN FP FN
When equation (4) is applied on Table 10, the accuracy of Model_Two is, 87 14 0.93 93% 87 14 6 2
while that of Model_Three is 86 14
0.92 92% 86 14 7 2
.
4.3. Final Psychological Capital Measurement Model
The outcome of the evaluation carried out on Model_Two and Model_Three indicates that Model_Two has the best goodness of fit and better prediction capability than Model_Three. Based on this fact, the final results of this investigation are given in equations (5) and (6).
1 3 2 5 3 5 1 3 og ( ) ln 31.9 12.1 3.9 7.6 1.5 9.9 7.4 7.3 4.6 1 P L it P S S O O H H R R P 1 3 2 5 3 5 1 3 1 3 2 5 3 5 1 3 exp 31.9 12.1 3.9 7.6 1.5 9.9 7.4 7.3 4.6 1 exp 31.9 12.1 3.9 7.6 1.5 9.9 7.4 7.3 4.6 S S O O H H R R P S S O O H H R R
Equation (5) is therefore, presented as the logistic regression model to be used in classifying the psychological capital worth of an employee, with accuracy of 93%. In order to determine the probability, P, that an employee‘s psychological capital is either high or low, equation (6) can be applied.
(4)
(5) (6)
21 5. CONCLUSION AND FUTURE WORK
The success of any profit-making organization is dependent largely upon the level of productivity of her employees (Ottenbacher, 2007, Salam, 2014; Atsa‘am and Kuset 2019). Apart from factors like technical know-how, academic qualifications and years of experience that employers look out for in employees, the psychological capital is equally desirable. In order to maximize profit and attain the strategic goals for which they are established, companies look out for employees with high psychological capital during recruitment and promotion (Luthans et al., 2007). The model developed in this research will serve the purpose of measuring the psychological capital of individuals and thus, are recommended for use during promotion appraisals and employment interviews. This investigation reveals that, statistically speaking, out of the several variables for measuring psychological capital using the PCQ, only 8 are necessary and sufficient to model the outcome of an individual‘s psychology capital. These variables include, I feel confident analyzing a long-term problem to find a solution; I feel confident contributing to discussions about my organization‘s strategy; If something can go wrong for me work-wise, it will; I am optimistic about what will happen to me in the future as it pertains to work; At the present time, I am energetically pursuing my goals; At this time, I am meeting the work goals I have set for myself; I usually take stressful things at work in my stride; I feel I can handle many things at a time at my job. These variables are represented as S1, S3, O1, O3, H2, H5, R3, R5 respectively. In subsequent research, the logistic regression classification model developed in this research can be implemented as a software module that computerizes employees‘ psychological capital measurement. This will assist human resource managers in evaluating who to hire, who to promote and who to retain in an organization when considering
22
psychological capital worth. By replacing the manual method of measuring PSYCap that uses PCQ with this model, a lot of time and energy will be saved and accuracy guaranteed.
REFERENCES
Agarwal, S., Pandey, G. N., & Tiwari, M. D. (2012). Data mining in education: data classification and decision tree approach. International Journal of Education, e-Business, e-Management and e-Learning, 2(2), 140.
Alarcon, G. M., Bowling, N. A., & Khazon, S. (2013). Great expectations: A meta-analytic examination of optimism and hope. Personality and Individual Differences, 54(7), 821-827.
Algur, S. P., Bhat, P., & Kulkarni, N. (2016). Educational Data Mining: Classification Techniques for Recruitment Analysis. International Journal of Modern Education and Computer Science, 8(2), 59.
Ali, A., & Senan, N. (2017, August). The effect of normalization in violence video classification performance. In IOP Conference Series: Materials Science and Engineering (Vol. 226, No. 1, p. 012082). IOP Publishing.
Alola, U. V., & Alola, A. A. (2018). Can Resilience Help? Coping with Job Stressor. Acad. J. Econ. Stud, 4, 141-152.
Alola, U. V., Olugbade, O. A., Avci, T., & Öztüren, A. (2019). Customer incivility and employees' outcomes in the hotel: Testing the mediating role of emotional exhaustion. Tourism Management Perspectives, 29, 9-17.
Alola, U., Avci, T., & Ozturen, A. (2018). Organization Sustainability through Human Resource Capital: The Impacts of Supervisor Incivility and Self-Efficacy. Sustainability, 10(8), 2610.
Al-Radaideh, Q. A., & Al Nagi, E. (2012). Using data mining techniques to build a classification model for predicting employees performance. International Journal of Advanced Computer Science and Applications, 3(2).
Antunes, A.C., Caetano, A., & Cunha, M.P. (2017). Reliability and construct validity of the Purtuguese version of the psychological capital questionnaire. Psychological Reports, 120, 520-536.
23
Atsa‘am, D. D., & Kuset Bodur, E. (2019). Knowledge mining on the association between psychological capital and educational qualifications among hospitality employees. Current Issues in Tourism, 1-5.
Avey, J. B., Luthans, F., & Jensen, S. M. (2009). Psychological capital: A positive resource for combating employee stress and turnover. Human resource management, 48(5), 677-693. Avey, J. B., Luthans, F., & Youssef, C. M. (2010). The additive value of positive psychological
capital in predicting work attitudes and behaviors. Journal of management, 36(2), 430-452.
Avey, J. B., Reichard, R. J., Luthans, F., & Mhatre, K. H. (2011). Meta‐ analysis of the impact of positive psychological capital on employee attitudes, behaviors, and performance. Human resource development quarterly, 22(2), 127-152.
Bandura, A. (2012). On the functional properties of perceived self-efficacy revisited.
Beugelsdijk, S. (2008). Strategic human resource practices and product innovation. Organization Studies, 29(6), 821-847.
Bouckenooghe, D., Zafar, A., & Raja, U. (2015). How ethical leadership shapes employees‘ job performance: The mediating roles of goal congruence and psychological capital. Journal of Business Ethics, 129(2), 251-264.
Breaugh, J. A.: (2013) Employee recruitment. Annual review of psychology, 64, 389-416
Breevaart, K., Bakker, A. B., & Demerouti, E.: (2014) Daily self-management and employee work engagement. Journal of Vocational Behavior, 84(1), 31-38
Brown, K. M., Hoye, R., & Nicholson, M.: (2012) Self-esteem, self-efficacy, and social connectedness as mediators of the relationship between volunteering and well-being. Journal of Social Service Research, 38(4), 468-483
Cabello-Medina, C., López-Cabrales, Á., & Valle-Cabrera, R.: (2011) Leveraging the innovative performance of human capital through HRM and social capital in Spanish firms. The International Journal of Human Resource Management, 22(04), 807-828
Carver, C. S., & Scheier, M. F.: (2002) Control processes and self-organization as complementary principles underlying behavior. Personality and social psychology review, 6(4), 304-315
24
Chang, H. H., & Chuang, S. S. (2011). Social capital and individual motivations on knowledge sharing: Participant involvement as a moderator. Information & management, 48(1), 9-18.
Chen, C. J., & Huang, J. W. (2009) Strategic human resource practices and innovation performance—The mediating role of knowledge management capacity. Journal of business research, 62(1), 104-114
Cho, H. J., & Pucik, V. (2005). Relationship between innovativeness, quality, growth, profitability, and market value. Strategic management journal, 26(6), 555-575
Damanpour, F., Walker, R. M., & Avellaneda, C. N. (2009). Combinative effects of innovation types and organizational performance: A longitudinal study of service organizations. Journal of management studies, 46(4), 650-675
Feltz, D. L., Short, S. E., & Sullivan, P. J. (2008). Self-efficacy in sport: Research and strategies for working with athletes, team, and coaches. Champaign, IL: Human Kinetics
Fox, J.: (1997). Applied regression analysis, linear models, and related methods. Thousand Oaks, CA: Sage Publications
Han, J., & Kamber, M. (2000). Data mining: Concepts and techniques. Morgan Kaufmann Publishers, Massachusetts
Hausman, J. & McFadden, D. (1984). Specification texts for the multinomial logit model. Econometrics, 52(5), 1219-1240
Hopley, L. & Schalkwyk, J. (2011) The magnificent ROC. Retrieved February 25, 2018, from http://www.anaesthetist.com/mnm/stats/roc/Findex.htm.
Hosmer, D. W., Jr., Lemeshow, S. A. & Sturdivant, R. X.: (2013) Applied logistic regression (3rd ed). Hoboken, NJ: Wiley
Huang, L., & Luthans, F. (2015). Toward better understanding of the learning goal orientation– creativity relationship: The role of positive psychological capital. Applied Psychology, 64(2), 444-472
Hult, G. T. M., Ketchen, D. J., & Slater, S. F. (2005) Market orientation and performance: an integration of disparate approaches. Strategic management journal, 26(12), 1173-1181. Johnston, J. & DiNardo, J. (1997). Econometric Method (4th ed.). New York, NY: The
25
Kappagoda, U. W. M. R., Othman, P., Zainul, H., & Alwis, G. (2014). Psychological capital and job performance: The mediating role of work attitudes. Dr. Hohd. Zainul and Alwis, Gamini, Psychological Capital and Job Performance: The Mediating Role of Work Attitudes (June 27, 2014). Journal of Human Resource and Sustainability Studies.
Kleinbaum, D.G. and Klei, M.: (2010) Logistics regression: A self-learning text. Springer, New York.
Kobau, R., Seligman, M. E., Peterson, C., Diener, E., Zack, M. M., Chapman, D., & Thompson, W. (2011). Mental health promotion in public health: Perspectives and strategies from positive psychology. American journal of public health, 101(8), 1-9
Li, S., Yen, D.C., Lu, W., & Wang, C. (2012) Identifying the signs of fraudulent accounts using data mining techniques. Computers in Human Behavior, 28, 1002–1013
Liu, D., Li, T., & Liang, D.: (2013). Incorporating logistic regression to decision-theoretic rough sets for classifications. International Journal of Approximate Reasoning, 55, 197-210 Long, J. Scott.: (1997) Regression Models for Categorical and Limited Dependent Variables.
Sage.
Lorenz, T., Beer, C., Putz, J., and Henitz, K. (2016). Measuring psychological capital: Construction and validation of the compound PsyCap scale (CPC-12). Plos One, 11(4), e0152892.
Lu, X., Xie, B., & Guo, Y. (2018). The trickle-down of work engagement from leader to follower: The roles of optimism and self-efficacy. Journal of Business Research, 84, 186-195
Luthans, F., & Youssef-Morgan, C. M. (2017) Psychological capital: An evidence-based positive approach. Annual Review of Organizational Psychology and Organizational Behavior, 4, 339-366
Luthans, F., Avolio, B. J., Avey, J. B., & Norman, S. M. (2007) Positive psychological capital: Measurement and relationship with performance and satisfaction. Personnel psychology, 60(3), 541-572
Luthans, F., Norman, S. M., Avolio, B. J., & Avey, J. B. (2008). The mediating role of psychological capital in the supportive organizational climate—employee performance relationship. Journal of organizational behavior, 29(2), 219-238
26
Luthans, F., Youssef, C. M., & Avolio, B. J. (2007). Psychological capital: Investing and developing positive organizational behavior. Positive organizational behavior, 1(2), 9-24 Luthans, F., Youssef, C. M., & Avolio, B. J. (2015) Psychological capital and beyond. Oxford
University Press, USA.
Luthans, F., Youssef, C. M., and Avolio, B. J. (2007). Psychological capital. New York: Oxford University Press.
Luthans, F.: (2002). The need for and meaning of positive organizational behavior. Journal of organizational behavior,23(6), 695-706
McKenny, A. F., Short, J. C., & Payne, G. T. (2013). Using computer-aided text analysis to elevate constructs: An illustration using psychological capital. Organizational Research Methods, 16(1), 152-184
Montano, J.J., Gervilla, E., Cajal, B., & Palmer, A. (2014) Data mining classification techniques: an application to tobacco consumption in teenagers. Annals of Psychology, 30(2), 633-641
Norouzi, M., Souri, A. & Zamini, M.S.: (2016). A data mining classification approach for behavioral malware detection. Journal of Computer Networks and Communications, 2016, 1-9
Ottenbacher, M. C.: (2007) Innovation management in the hospitality industry: different strategies for achieving success. Journal of hospitality & tourism research, 31(4), 431-454
Paek, S., Schuckert, M., Kim, T. T., & Lee, G.: (2015). Why is hospitality employees‘ psychological capital important? The effects of psychological capital on work engagement and employee morale. International Journal of Hospitality Management, 50, 9-26
Paterson, T. A., Luthans, F., & Jeung, W.: (2014). Thriving at work: Impact of psychological capital and supervisor support. Journal of Organizational Behavior, 35(3), 434-446 Rawlings, J.O, Pantula, S.G. & Dickey, D.A.: (1998). Applied regression analysis: A research
tool. Springer, New York.
Salam, A., & Tufail, S.: (2014). Competitiveness and comparative advantage of important food and industrial crops in punjab: Application of policy analysis matrix. Journal of International Agricultural Trade and Development, 10(1), 81
27
Salanova, M., Llorens, S., Cifre, E., & Martínez, I. M.: (2012). We need a hero! Toward a validation of the healthy and resilient organization (HERO) model. Group & Organization Management, 37(6), 785-822
Snyder, C. R., Harris, C., Anderson, J. R., Holleran, S. A., Irving, L. M., Sigmon, S. T., ... & Harney, P.: (1991). The will and the ways: Development and validation of an individual-differences measure of hope. Journal of personality and social psychology, 60(4), 570 Sperandei, S.: (2013) Understanding logistic regression analysis. Biochemia Medica, 24(1),
12-18
Stajkovic, A. D., & Luthans, F.: (1998). Self-efficacy and work-related performance: A meta-analysis. Psychological bulletin, 124(2), 240
Sumathi, K., Kannan, S., & Nagarajan, K.: (2016) Data mining: Analysis of student database using classification techniques. International Journal of Computer Applications, 141(8), 22-27
Tugade, M. M., Fredrickson, B. L., & Feldman Barrett, L.: (2004). Psychological resilience and positive emotional granularity: Examining the benefits of positive emotions on coping and health. Journal of personality, 72(6), 1161-1190
van Dinther, M., Dochy, F., & Segers, M.: (2011). Factors affecting students‘ self-efficacy in higher education. Educational research review, 6(2), 95-108
Wu, L.: (2017). Production adoption rate prediction in a competitive market. IEEE Transactions on Knowledge and Data Engineering, 30(2), 325-338
Wu, X.: (2013). Data mining with big data. IEEE Transactions on Knowledge and Data Engineering, 26(1), 97-107
Yussuf, H., Mohamad, N., Ngah, U. K., & Yahaya, A.S.: (2012) Breast cancer analysis using logistic regression. International Journal of Recent Research and Applied Studies, 10(1), 14-22
Zmiri, D., Shahar, Y. & Taieb-Maimon, M.: (2012). Classification of patients by severity grades during triage in the emergency department using data mining methods. Journal of Evaluation in Clinical Practice, 18, 378-388
28
Figure 1. RUC curve and AUC for Model_Two
Area under the curve = 0.95
Figure 2. ROC curve and AUC for Model_Three