49
Dokuz Eylül Üniversitesi Denizcilik Fakültesi Dergisi Cilt: 2 Sayı: 1 2010 THE POTENTIAL OF TURKEY AS A LOGISTICS CENTER BETWEEN FAR EAST AND EUROPE: AN APPLICATION IN
ELECTRONICS INDUSTRY♣♣♣♣
Dr. İsmail Bilge ÇETİN1 Prof. Dr. A. Güldem CERİT2 ABSTRACT
The trade between Asia and Europe is steadily increasing. In some industries the products are mainly produced in Far East countries due to their cost advantages and exported Europe directly. In some cases however, some final products are produced at the markets or close to them in European Union since these products gain weight or volume in case they are produced at origin. The electronics industry is organized in such a context and the parts that are produced in the Far East countries are imported by Turkey where they are assembled into electronic products and exported to the European countries.
In this study, it is tried to analyze if Turkey can be a logistics center to store, distribute and add value to the parts coming from Far East and sending the resulting products into the EU. In the study, location choice theories and models are used. The study showed that many quantitative and qualitative techniques are used in location choice decision on plant and distribution centers but very few studies exist on logistics center location choice.
The study is based on Alfred Weber’s location theory. In our analysis, we have used the center of gravity method which is a method of
♣
A previous version of this paper was presented at IAME 2008 Conference held on 2 – 4 April 2008 in Dallian, China and at IFSPA 2008 Conference held on 25-28 May 2008 in Hong Kong.
1 Dokuz Eylul University, Maritime Faculty, [email protected] 2 Dokuz Eylul University, Maritime Faculty, [email protected]
operational researches to understand if Turkey is the right location which minimizes the transportation costs between Far East and EU.
The study has revealed that with current market potential and supply sources, the location which minimizes the total transportation costs in electronics industry is not within the boundaries of Turkey. Giving the location decisions for logistics centers necessitates further studies.
Key words: Turkey, Logistics Centers, Electronics ÖZET
Asya ve Avrupa arasındaki ticaret gün geçtikçe artmaktadır. Bazı endüstrilerde ürünler maliyet avantajı nedeniyle Uzak Doğu ülkelerinde üretilmekte ve Avrupa’ya ihraç edilmektedir. Bazı durumlarda ise, üretildikleri yerde ağırlık ya da hacim kazanan bazı ürünlerin üretimleri Avrupa Birliği pazarlarında ya da pazara yakın noktalarda olmaktadır. Elektronik endüstrisinde de benzer bir durum söz konusudur. Elektronik ürünlerin parçaları Uzak Doğu’da üretilmekte ve parçalar Türkiye’de birleştirilmektedir. Üretilen ürünler Avrupa ülkelerine ihraç edilmektedir.
Bu çalışmada Türkiye’nin Uzak Doğu’dan gelen parçalar için bir depolama, dağıtım ve katma değer yaratılan bir nokta ve üretilen ürünlerin Avrupa’ya yollandığı bir lojistik merkez olup olamayacağının analizi yapılmıştır. Araştırmada yer seçim teorileri ve modelleri incelenmiştir. Çalışma göstermiştir ki, fabrika ve dağıtım merkezlerinde yer seçimiyle ilgili bir çok kantitatif ve kalitatif çalışma mevcuttur. Ancak lojistik merkez yer seçimi ile ilgili olarak çok sınırlı sayıda çalışma bulunmaktadır.
Bu çalışma Alfred Weber’in yer seçim teorisi üzerine kurulmuştur. Çalışmamızda ağırlık merkezi yöntemi kullanılmıştır. Bir yöneylem araştırması methodu olan bu yöntemle Türkiye’nin Uzak Doğu ve Avrupa arasında ulaştırma maliyetlerinin minimize olduğu bir noktada olup olmadığı anlaşılmaya çalışılmıştır.
Araştırma göstermiştir ki, şu anki piyasa potansiyeli ve tedarik kaynaklarıyla, elektronik endüstrisinde ulaştırma maliyetlerinin minimize olduğu yer Türkiye sınırları içerisinde değildir. Lojistik merkezin yerinin tespiti için daha yeni ek çalışmalara ihtiyaç vardır.
51
1. INTRODUCTION
East- West trade is growing steadily and in this trade, particularly East- West trade is growing steadily China and other East and North East Asian countries’ share is dominating the shares of the rest of the world. According to UNESCAP’s (2007) report , the share of the East and North Asian Countries in World export and import will reach a rate of 62 % and 48 % respectively by 2015. Therefore, the carriage of cargo by sea between Asia and Europe is increasing accordingly. The container traffics in East-West trade will reach about 109 millions TEU in 2015 by comparing the volume of 54 millions TEU in 2005 (UNESCAP 2007).
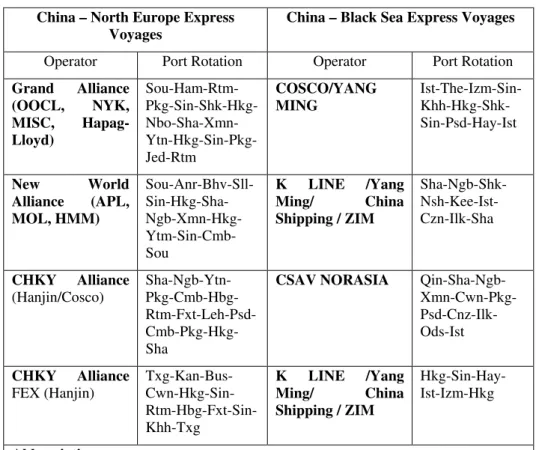
The increase in seaborne trade between Asia and Europe created a new approach in the operation of container vessels which is known as express voyages. Due to the high demand for Chinese and Asian products both in Europe and Black Sea Region including Turkey, direct China – North Europe and direct China – Black Sea container vessel voyages has started. Although there is an imbalance in favour of Asian countries in the trade, the trade is still growing continuously. At Table 1, some of the liner operators and their port of calls are given.
Table 1. Asia – Europe Express Container Lines
China – North Europe Express Voyages
China – Black Sea Express Voyages
Operator Port Rotation Operator Port Rotation
Grand Alliance (OOCL, NYK, MISC, Hapag-Lloyd) Sou-Ham-Rtm- Pkg-Sin-Shk-Hkg- Nbo-Sha-Xmn- Ytn-Hkg-Sin-Pkg-Jed-Rtm COSCO/YANG MING Ist-The-Izm-Sin- Khh-Hkg-Shk-Sin-Psd-Hay-Ist New World Alliance (APL, MOL, HMM) Sou-Anr-Bhv-Sll- Sin-Hkg-Sha- Ngb-Xmn-Hkg- Ytm-Sin-Cmb-Sou K LINE /Yang Ming/ China Shipping / ZIM Sha-Ngb-Shk- Nsh-Kee-Ist-Czn-Ilk-Sha CHKY Alliance (Hanjin/Cosco) Sha-Ngb-Ytn- Pkg-Cmb-Hbg- Rtm-Fxt-Leh-Psd- Cmb-Pkg-Hkg-Sha
CSAV NORASIA Qin-Sha-Ngb- Xmn-Cwn-Pkg- Psd-Cnz-Ilk-Ods-Ist CHKY Alliance FEX (Hanjin) Txg-Kan-Bus- Cwn-Hkg-Sin- Rtm-Hbg-Fxt-Sin-Khh-Txg K LINE /Yang Ming/ China Shipping / ZIM Hkg-Sin-Hay-Ist-Izm-Hkg Abbreviations:
Anr = Antwerp; Bhv = Bremerhaven; Bus = Busan; Cmb = Colombo; Cwn = Chiwan; Fxt= Felixstowe; Ham= Hamburg; Hkg= Hong Kong; Jed=Jeddah; Kan= Kwanyang; Khh=Kaoshiung; Leh=Le Havre; Nga=Nahoya; Ngb=Ningbo; Pkg=port Klang; Psd=Port Said; Qin= Qingdao; Rtm=Rotterdam; Sha= Shanghai; Shk=Shekou; Sin=Singapore; Sll=Salalah; Sou=Southhampton; Txg=Xingang; Xmn=Xiamen; Ytn=Yantian; Zee=Zeebruggee; Cnz =Constanza; Hay= Haydarpaşa; Hkg=Hong Kong; Ilk=Ilyichevsk; Ist=İstanbul; Izm=İzmir; Kee=Keelung; Ods=Odessa; The=Thessaloniki
Source: Containerisation International 2006 ; Containerisation International 2005;
http://www.klineurope.com/container-services/schedule.asp?sg=eur_med_asa&di=w;; http://www.kline.co.jp/news/2007/070827_e.htm;,
<http://www.csavnorasia.com/pages/servicepro_nabs.html#;>
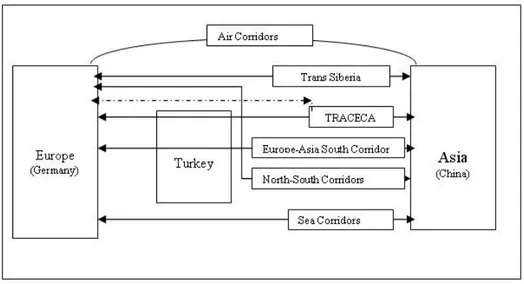
Beside seaborne trade between Asia and Europe, the countries in those continents are creating alternatives transport corridors under the name of Eurasian Land Bridge to improve the trade and creating a new Silk Way. These corridors are mainly connecting Far East and Middle Asian countries to Europe by railways and road transportation. Turkey being on and close to
53
these transport corridors (See Figure 1 )and one of the important actor in Eurasia trade has a potential of being a logistics center in her region.
Figure 1. Transportation Corridors Passing on and around Turkey
Source: Authors
Since years the main trade partners and the biggest market for Turkey is European countries and particularly Germany. However, in the middle of 1990s, Turkey met Asian countries and since than the relation has been developing. China has become an important trade partner of Turkey and It became the third biggest exporter to Turkey after Germany and Russia.
In this study, it is tried to analyze if Turkey can be a logistics center to store, distribute and add value to the parts coming from Far East and sending the resulting products into the EU. In the study, location choice theories and models are used. The study showed that many quantitative and qualitative techniques are used in location choice decision on plant and distribution centers but very few studies exist on logistics center location choice. Basic location theories, location analysis techniques and previous studies are given in the following sections.
1.1. Location Choice Theories
The traditional location theory has been dealing with two basic problems: 1. Where does a company or an industry locate in order maximize its
profits, while all other things being equal? Or in other words, why do some certain locations develop?
2. By considering the existing locations, Where is the right location for a certain company or industry to market its products in a most profitable way? This approach is known as “market place theory”. In this theory, the product is processed in a place close to the market. The main aim in two approaches is to minimize the costs. Transportation cost is accepted as an important location choice criterion (Baser 2004).
The first location theories were created by Johann Von Thünen, Alfred Weber, T. Palander, August Lösch, Edgar Hoover, Melvin Greenhut and Walter Isard whose field of studies are economy and geography. The common topic of all these early studies are transportation costs (Ballau 1999).
1.2. Location Analysis Techniques
Typical location analysis problems can be characterized as very complex and data intense. Sophisticated modeling and analysis techniques must be employed to effectively deal with such complexity and data intensity in order to identify the best alternatives. The tools used to support location analysis generally fall into the categories of analytic techniques, optimization or linear programming techniques, and simulation (Bowersox and Closs 1996).
A location issue is defined as a spatial resource allocation problem in that one or more service facilities, or ‘servers’, serve a spatially distributed set of demands, or ‘customers’. This issue has long been receiving attention from both academicians and practitioners. From a holistic perspective, it can be generally classified into two most popular categories of location research issues, namely, locating the manufacturing facilities (such as plants, warehouses etc) and distribution centers in a retailer facility network (Thaive and Grewal 2005).
The research literature on manufacturing facilities location issue is substantial. As far as the cost-based models of location selection are concerned, various research projects have been done in this respect. One of the objectives of cost-based location problems is the minimization of discounted costs associated with the plant location or expansion, for instance, costs of expansion, maintenance and inventory. While the literature on locating manufacturing facilities based on costs and quantitative variables models is extensive, it possesses a major short coming that of focusing only on the cost and quantitative variables aspects of the
55
location decision. Other researchers have attempted to investigate other qualitative variables in location research of manufacturing facilities (Thaive and Grewal 2005).
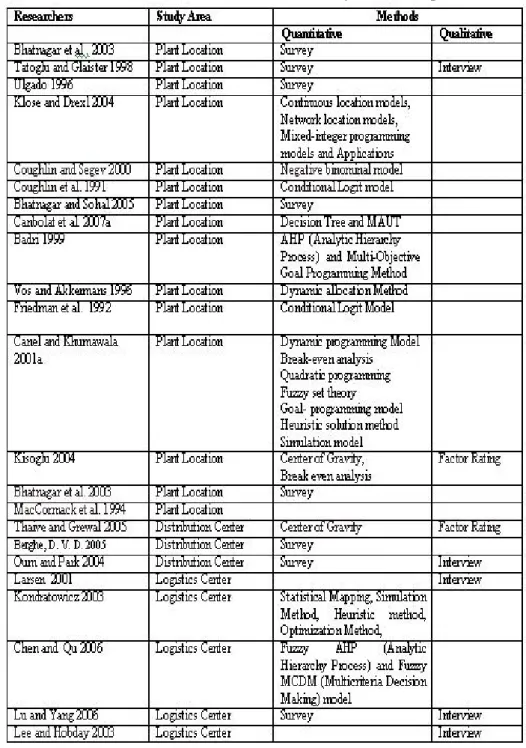
Some quantitative and qualitative studies regarding to location analysis techniques are given at Table 2.
Table 2. Studies on Location Analysis Techniques
Source: Prepared by the Authors
Majority of the studies are made on plant and distribution center location choices and different methods are used in these areas. On the other hand, studies on logistics center locations are very rare. The studies
57
evaluating a country’s potential as a logistics center are rather limited. In this study, to evaluate Turkey’s potential as a logistics center, center of gravity methods is used.
2. METHODOLOGY
In location choices, analytics, optimizations and simulation methods can be used. However, the difficulty of obtaining data regarding cost and revenue of the companies forced us to choose the most proper one. Therefore, the potential of Turkey as a logistics center will be evaluated by using Center of Gravity Method. This method is a location choice method and it is used to determine the location of geographic position of a place in a region (Chopra and Meindl 2007).
In this study, there are mainly three variables which are transportation cost (freight), cargo quantity and coordinates of suppliers and markets. Transportation costs and coordinates of suppliers and markets were found easily, but the difficulty was met in obtaining cargo quantity from the company who accepted to support the study.
2.1. General Geographical Area – Centre of Gravity (CoG) Principle In physics, the Centre of Gravity (CoG) of a collection of masses is defined as an imaginary point where all the weights of the object can be considered to be concentrated through that point, and hence, there is no momentum arm to make the object unbalanced. Figure 2 represents the idea of this concept.
Figure 2. Center of Gravity Model
Suppose that an object carries a collection of weights W1, W2, …
Wn and the relevant distances from these to an imaginary CoG are d1, d2 … dn. The forces exerting on this object at various locations are calculated
based on Newton’s law of gravity as follows:
F1 = W1 x d1, F2 = W2 x d2, ... Fn-1 = Wn-1 x dn-1, Fn = Wn x dn
In order to make the object balanced, the CoG should be placed where the following equation is satisfied:
F1 + F2 +… Fn-1 + Fn = 0 or
∑
= = n i 1Fixdi 0 ( 1 )The equation (1) indicates that all weights of the object have a mutual relationship, and any changes in one direction of a weight should be reflected in the other direction of the other weight so that the balance status is maintained. Further more, as the force exerting from a weight depends on weight and distance to CoG, an increase in weight will be reflected by the decrease in that distance so that the object is still kept balanced. The CoG in this case will, there fore, shift to the new area which is near the heavier weights. Further realization can be mentioned here, as a diagnosis from equation (1), is that in order to have the balance status quo the CoG will tend to locate in the area near major weights to off set other lighter ones in fur their distances (Thai and Grewal 2005).
Center of gravity model is classified mathematically as a static continuous location model (Ballou 1999). Given a set of points that represent source points and demand points, along with their volumes that are to be moved to or from a facility of unknown location and their associated transportation rates, where should that facility be located ?
Min TC =
∑
i
ViRidi (1)
Where
TC : total transportation cost
59
Ri : transportation rate at point i
di : distance to point i from the facility to be located
The facility location is found by solving two equations for the coordinates of the location. These exact center of gravity coordinates are :
∑
∑
= i i di ViRi di ViRixi X / / (2 ) and∑
∑
= i i di ViRi di ViRiyi Y / / (3) WhereX, Y = Coordinate points of the located facility
xi, yi = Coordinate points of source and demand points
The distance di is estimated by
di = k. (xi−X)2 +(yi−Y)2
(4)
where k represents a scaling factor to convert one unit of a coordinate index to a more common distance measure, such as miles or kilometers.
2.2. The Solution Process
The solution process involves several steps that are outlined as follows:
1. Determine the X, Y coordinates points for each source and demand point, along with point volumes and linear transportation rates.
2. Approximate the initial location from the center of gravity formulas by omitting the distance term di as follows:
∑
∑
= i i ViRi ViRixi X (5) and∑
∑
= i i ViRi ViRiyi Y (6)3. Using X, Y from step 2, calculate di according to Equation (4) (The scaling factor k need not be used at this point).
4. Substitute di into Equations (2) and (3), and solve for the revised
X, Y coordinates.
5. Recalculate di based on the revised X, Y coordinates.
6. Repeat steps 4 and 5 until either of the X, Y coordinates do not change for successive iterations, or they change so that continuing the calculations is not fruitful.
7. Finally, calculate the total cost for the best location, if desired, by using equation (1) (Ballou 1999).
3. AN APPLICATION IN ELECTRONICS INDUSTRY 3.1. Application of Center of Gravity
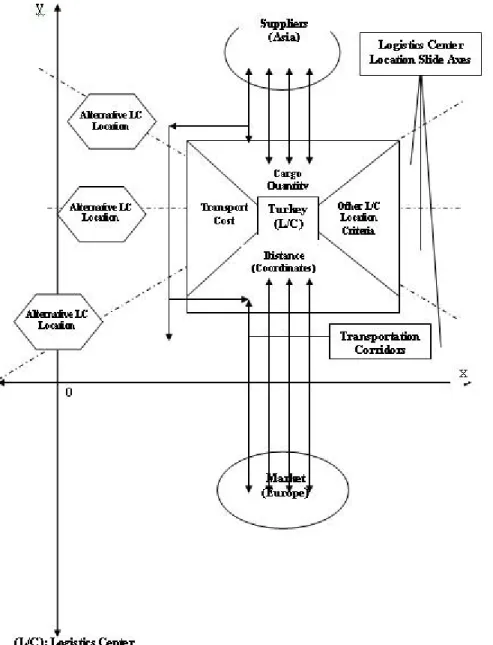
The application analyzes the potential for logistics center from the aspect of value added services in the geographical region surrounding Turkey, between the supplier and market countries. The study aims to identify whether the place of facility that we chose during the performance of the study is located at a point suitable to minimize the transportation costs. The application model is given in Figure 3.
Figure 3 shows the combination of center of gravity model, transportation corridors and the other logistics center location criteria which are quite important to determine the logistics center potential of Turkey in her region.
61
3.1.1. Main Countries and Product Groups for Electrical-Electronic Equipment Exports of Turkey
In the electrical and electronics industry, products were exported to 190 countries in 2005. As of 2005, the top destinations for exports of electrical and electronics industry were Germany with 1.101 million dollars and 15.4 percent share in total exports; the United Kingdom with 965 million dollars and 13.5 percent share, and France with 491 million dollars and 6.9 percent share. Iraq, to which the products have been exported since 2003 ranked the fifth in 2005 with 406 million dollars and 5.7 percent share. European countries account for 66 percent of total exports; indicating that the exports of the industry are depended to certain markets, although not very strongly (DTM 2005).
Accordingly, 41 percent of the exports in the industry belong to the television purchasers in position code 8528, 10 percent to refrigerator product group in position code 8418, and 10 percent to insulated wires and fiber optic cables product group in position code 8544. In addition to these three groups, the exports of washing machines, electrical water heaters, electrical transformers and electrical circuit equipments with less than 1000 Volts account for 80 percent of the total exports in the industry.
Figure 3. Center of Gravity Application Model
63
3.1.2. The Group of Products that Constitute the Sampling Set
The scope of the study is held limited with the products of the sample enterprise, and it does not include all electrical and electronic products.
These product groups mostly include televisions and household appliances, and partially the air conditioners. The commodity classification codes of sample products according to the 2002 Harmonized System (HS) of tariffs are given in Table 3.
Table 3. Commodity Description and Coding
Code (HS2002) Product Description
8528 Reception apparatus for television
8418 Refrigerators, freezers and other refrigerating or freezing equipment
8450 Household or laundry-type washing machines, including machines which both wash and dry.
8415 Air conditioning machines, comprising a motor-driven fan
Source:
http://comtrade.un.org/db/mr/rfCommoditiesList.aspx?px=H2&cc=TOTAL
3.1.3. Stages of the Center of Gravity Application
The application is basically realized in two stages:
1. Data gathering stage: In the initial stage, it is required to identify
the loading points at the supplier countries and the unloading points at the market; the load quantities at these points, the coordinates at these points and the transportation (freight) costs between the production point and the supplier and market, the distances of the supplier and market points to the production facility, and the transportation cost per unit weight (TEU) for each kilometer.
2. Identification of the Center of Gravity: Through the data
compiled in the first stage and the formulas used in the center of gravity calculations, the point that minimizes the cost between the supplier and market points has been identified. The calculations in this regard have been made as computer-supported with Excel software SOLVER.
3.1.3.1. Identification of the Supplier and Market Points
In the center of gravity application, the reference points that supply the sampling enterprise of the study and the countries that are the markets of the mentioned enterprise have been identified as the reference points according to the place or loading/discharge ports in those countries. Here, not the city or the final consumption points at the supplier or market countries, but the loading port / place and discharge port / place are considered.
The reason is the fact that the ports are the entrance gates of the countries, the industry and cities are generally concentrated around the ports, and the determination of freight between ports is easier. Another factor is the fact that the study aims to identify the location of a country on a wide geography (from the Far East to West Europe) rather than a geographical region in a country, requiring to identify the most weighted location in the relevant country. Under these circumstances, it is thought that the loading/discharge points of the countries would best represent those countries, and the densest ports at the relevant countries and those ports densely used by the sample enterprise are accepted as the reference points whose coordinates would be adopted for those countries.
The issue of country and loading/discharge port and places given in Table 4 and 5 indicate the points of handling in those countries for the enterprise in question.
In order to narrow down the geographical scope of the application, especially the supplier and market countries in Europe and Asia have been selected as the supplier and market countries. There are two basic reasons for this selection:
The first reason is, because the application is on the transportation corridors between Far East and Europe, the study mostly aims to concentrate on this region, and the regions on the west of zero degree longitude (prime meridian) are kept outside of the calculation. Under these circumstances, the continents of Europe and Asia, and some important countries in market status in North Africa are included in the area of the study.
97.5 percent of the total supplier countries and 97 percent of the market countries are included in our study.
65
The supply of components and marketing of products are not made only to the countries other than Turkey, but also 3 percent of the total supply and 10 percent of the total sales are provided from and delivered to the domestic market. In this regard, the authorities of the enterprise were requested to identify the place where both the supply point and the market are mostly concentrated in Turkey; accordingly Istanbul has been identified as the center of gravity both as a supply center and the market.
3.1.3.2. Determination of the Load Quantities at the Loading and Discharge Points
When expressing the quantity of load at each point, the annual demand quantity is expressed in standard units. For example, in this study, it is assumed that the products demanded in the market and the components received from the suppliers are shipped in 20-foot containers (TEU).
The subject enterprise of the application supplies 97 percent of the components it consumes through imports and 3 percent from the domestic market.
To the components brought to Turkey, 3 percent of Turkish-origin components are added and so the televisions and household appliances are produced. Again, almost all (90%) of the finished televisions and household appliances are exported, while nearly 10 percent are sold domestically. Please see Table 5 for the exported products and shares of importer countries.
There are some limitations in the application. These limitations are as follows:
In the application, the enterprise’s full container import and export quantities have been taken into account and the calculations have been made according to these values. For the loads less than full container load (LCL-partial loads), the number of load quantity could not be identified by the enterprise, and because the full containers account for a large portion of both imports and exports, the number of full containers (FCL- Full Container Load) have been taken into consideration in our calculations.
3.1.3.3. Identification of the Coordinates of the Market and Supply Points
The third stage of the application is the determination of the identification of the coordinates of the supply and market demand points on the coordinate system. In the application, the coordinates of the pre-determined points have been identified in terms of degrees, minutes and seconds with the help of Google Earth 2007 software, and then, all coordinates have been converted into degrees in order to obtain a common unit. The coordinates of the supplier and market points are given in Table 4 and Table 5.
3.1.3.4. Determination of the Transportation Cost (Freight)
In the determination of the transportation cost; Izmir Port, which handles the components and products of the production facility assumed to be built in Izmir, has been taken as the reference point, and the freight calculations for both import and export shipments have been determined according to this port. Because the freight movements subject to the application are the import and export freight movements of the related enterprise in 2006, the freight rates are also considered as the average freights in 2006.
In determining the freight rates, the freight rates of five different regular line agencies and forwarders working on the relevant shipment regions have been taken into consideration.
3.1.3.5. Determination of the Distances Between Production Facility and Sources and Production Facility and Markets and Determination of Transportation Cost per Km
The distances between production facility and sources and markets are determined by using distances and freight rates and than transportation cost of one TEU per Km is calculated. In center of gravity model there are some assumptions:
1. Both sources and markets are accepted as a point on plane 2. All distances on the plane is calculated as geometric distances 3. The cost of transportation increases with the increase of cargo
carried (Chopra and Meindl 2007)
By stating these assumptions, it is worth to say that the distances given at Table 4 and 5 are not the real distances but the geometric distances.
67
These distances are calculated by Marine Calculators and Converters by giving the longitude and latitude of each point http://www.portfocus.com.
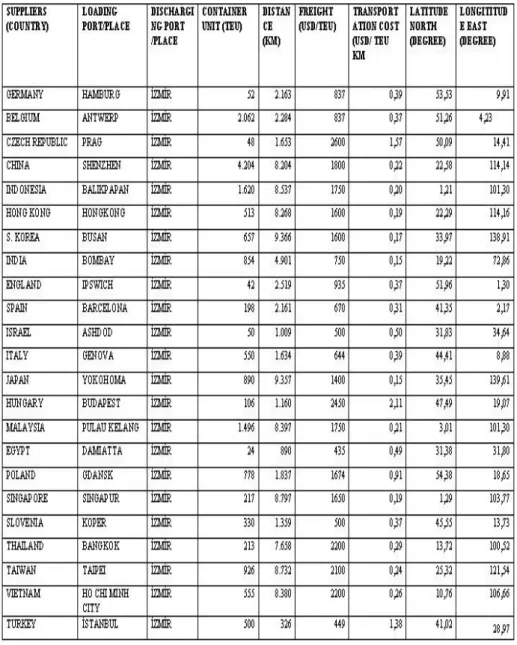
Table 4. Data Related to Production Facility and Sources
Source: Cargo Data Obtained from Production Facility; Freight Data of Container Lines and Freight Forwarders; Marine Calculators and Converters, http://www.portfocus.com; Google Earth, Image NASA, Europe Technologies, 2007
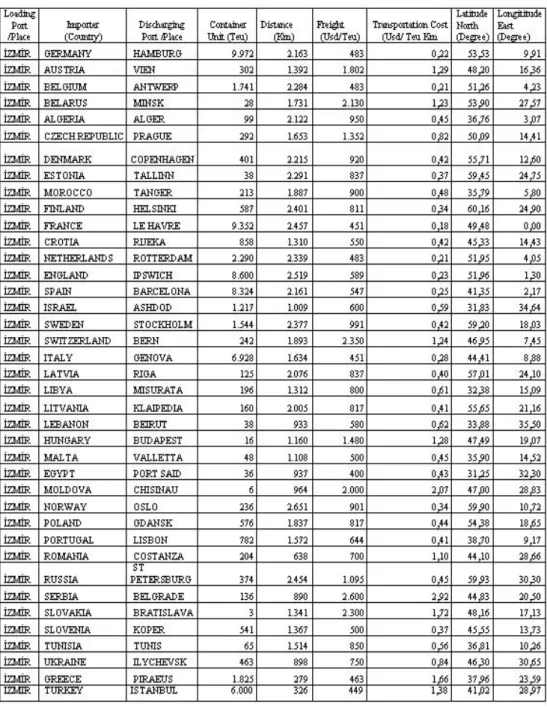
Table 5. Data related to Production Facility and Markets
Source: Cargo Data Obtained from Production Facility; Freight Data of Container Lines and Freight Forwarders; Marine Calculators and Converters, http://www.portfocus.com; Google Earth, Image NASA, Europe Technologies, 2007
69
2.1.3.6. Determination of Center of Gravity
At this stage of the application, all the data collected up to now will be put into the center of gravity model. Optimal center of gravity point is a point where the total transportation cost is minimum.
Optimum solution is calculated by using SOLVER tool in Excel program.
The initial logistics center location point at the calculation is accepted as City of Izmir, Turkey whose coordinates are 38,43 Degree
North (38°25'48.00"N) and 27,15 Degree East (27° 8'60.00"E). The
initial logistics center location point is given at Figure 4.
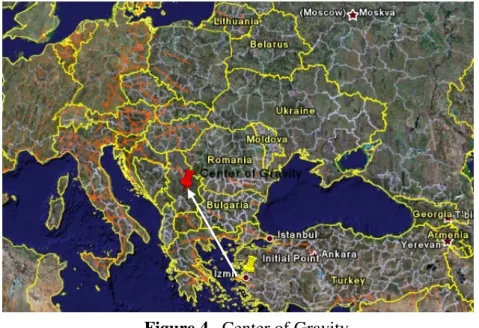
Figure 4. Center of Gravity
Source: Google Earth, Image NASA, Europe Technologies, 2007 At the next stage, by using the data at Table 4 and 5 and SOLVER tool, the point where the total transportation cost is at minimum, is calculated.
After calculation, It is seen that the new center of gravity and initial one which is in Turkey is completely different. The new center of gravity is a point in the center of Serbia (See Figure 4) whose coordinates are 43,53
Degree North and 21,02 Degree East. The position and cost differences
Table 6. The Position and Cost Differences Before and After the
Calculation
Transportation Cost (Min)
Name Original Value Final Value
Cost = Turkey 660388,2092 617380,6538 Center of Gravity Location
Name Original Value Final Value
X (Latitude) = Turkey 38,43 43,53397731
Y (Longitude) = Turkey 27,15 21,02444256
The new center of gravity whose coordinates are 43,53 Degree
North and 21,02 Degree East is not the final logistics center location .
Since center of gravity is a point determined on coordinate plane and the distances are geometric distances, this location is a point where only the transportation cost is minimum. In determining the logistics centers, some other variables have to be considered.
3.2. Evaluation of the Findings
The findings of the study can be evaluated as follows:
The center of the gravity in this application is calculated as 43,53 degrees North (latitude) and 21,02 degrees East (longitude). This point is different than the initial point and it is in the center of Serbia.
1. Since the center of gravity depends on the number of cargo (containers) in supply and market points, any changes in numbers of containers at those points will change the center of gravity.
2. While considering the location of the logistics center in Serbia, geographic structure, transportation infrastructure, availability of labor and other costs factors should be analyzed and final decision must be given accordingly.
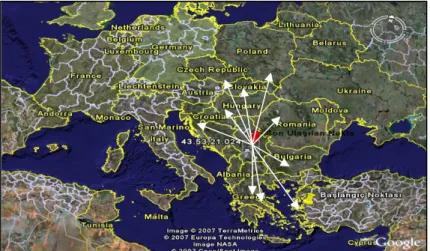
3. In addition to Serbia, some other countries around Serbia can be considered alternative logistics centers. These countries are today attracting foreign direct investments and they are either on important transport corridors an/or have important transportation infrastructures. These countries are mainly Greece, Romania, Bulgaria, Croatia, Hungary, Slovakia, Czech Republic and Poland. The new center of gravity and possible logistics centers are given at Figure 5.
71
The final decision about logistics center location will be given upon evaluating each country’s potential. In evaluation, each country will be evaluated according to the logistics center location criteria.
Figure 5. Center of Gravity and Countries having Logistics
Source: Google Earth, Image NASA, Europe Technologies, 2007.
CONCLUSION
Although there is an imbalance in trade between Asia and Europe, the trade is growing and both side increasing their trade volume. In this trade two countries China in one side and Germany on the other are playing a key role. As Turkey’s biggest trade partners, they also make great impact on Turkish economy.
Turkey as between two continents and two countries has the willingness to improve the cooperation between countries both in Asia and Europe and instead of competing in many fields. In this study the geographic position of Turkey is analyzed if it can be used as a logistics center between Asia and Europe to improve Eurasian trade in both direction.
In this study, value adding side of logistics centers is analyzed by center of gravity model. The results show that in electronic industry, the location for a production facility goes Serbia rather than Turkey. Of course, this location is not the final location for the production facility. The final location will be determined by evaluating the gravity center and by considering the other location choice criteria and methods. In this respect, some further qualitative and quantitative techniques must be applied to determine the right location. The opinions of electronics industry experts,
logistics service providers and liner container ship operators have to be taken through interviews and/or a survey can be conducted by using logistics center location choice criteria.
REFERENCES
Badri, M. A. (1999) Combining The Analytic Hierarchy Process And Goal Programming For Global Facility Location-Allocation Problem, Int. J. Production Economics , 62, pp. 237-248.
Baser, S.Ö. (2004) Türkiye’nin Uluslararasi Denizlerdeki Tarifesiz Gemi Taşımacılığının Ekonomik Analizi, Dokuz Eylül Üniversitesi Sosyal Bilimler Enstitüsü Dergisi, Cilt E: 6 Sayi: 2004.
Berghe, D. V. D. (2005) European Headquarters: Location Decisions And Establishing Sequential Company Activities Final Report, Ernst SL Young International Location Advisory Services.
Bhatnagar, R., J. Jayaram.,Y. C. Phua. (2003) Relative Importance of Plant Location Factors: A Cross National Comparison Between Singapore and Malaysia, Journal of Business Logistics, 24, 1; ABI/INFORM Global p. 147.
Bhatnagara R. and A.S. Sohalb. (2005) Supply Chain Competitiveness: Measuring The Impact Of Location Factors, Uncertainty And Manufacturing Practices, Technovation, 25.
Bowersox, D. J. and D.J. Closs. (1996) Logistical Management, The Integrated Supply Chain Process, McGraw-Hill Publishing.
Canbolat, Y.B., K. Chelst, N. Garg. (2007) Combining Decision Tree and MAUT for Selecting A Country For A Global Manufacturing Facility, Omega The International Journal of Management Science, 35, pp. 312 – 325.
Canel, C. and B. M. Khumawalaz. (2001) International Facilities Location: A Heuristic Procedure for the Dynamic Uncapacitated Problem, International Journal of Production Research, , Vol. 39, no. 17.
Chen, Y. and L. Qu .(2006) Evaluating the Selection of Logistics Centre Location Using Fuzzy MCDM Model Based on Entropy Weight, Proceedings of the 6th World Congress on Intelligent Control and Automation, June 21 – 23.
73
Chopra, S. and P.Meindl. (2007) Supply Chain Management, Strategy, Planning, and Operation, 3rd edition, Pearson Prentice Hall, 130.
Containerisation International 2005. Containerisation International 2006.
Coughlin ,C.C. and E. Segev. (2000) Location Determinants of New Foreign-Owned Manufacturing Plants, Journal of Regional Science, Vol. 40, No. 2, pp. 323-351.
Coughlin, C.C., J. V. Terza, V. Arromdee (1991). State Characteristics and the Location of Foreign Direct Investment within the United States, The Review of Economics and Statistics, Vol. 73, No. 4. pp. 675-683.
DTM, Dis Ticaret Müstesarligi, Dis Ticaret Istatistikleri,
<http://www.foreigntrade.gov.tr/IHR/madde/elektrik%20elektronik%20sekt oru%20>
Friedman, J., D.A. Gedrlowski ., J. Silberman. (1992) What Attracts Foreign Multinational Corporations? Evidence from Branch Plant Location in The USA, Journal of Regional Science, Vol. 32, No: 4, pp. 403-418.
Google Earth, Image NASA, Europe Technologies, 2007.
IGEME. (2007) 2007 Yılı Ocak – Haziran Dönemi Ihracatının Genel ve Sektörel Değerlendirilmesi, Ar-Ge ve Degerlendirme Dairesi.
Kisoglu, S. (2004) Kurulus Yeri Seçiminin Boyutsal Analiz Yöntemi ile Belirlenmesi; Giyim Sektörü Örnegi,
<http://www.mmo.org.tr/muhendismakina/arsiv/2004/mart/makale_giyim.ht m 18/08/2007>
Klose, A., A. Drexl. (2004) Facility Location Models for Distribution System Design, European Journal of Operational Research,
<www.elsevier.com/locate/dsw>
Kondratowicz, L. (2003) Work Package 1, Planning of Logistics Centers, Final Report, Edited by– NeLoC Work Package 1 Leader ,Volume II ,Gdańsk, Poland.
Larsen, T. S. (2001) Logistics in the Öresund Region After the Öresund Link, Report: No 3120/2001, Copenhagen Business School, Ulf Paulsson & Sten Wandel, Lund University.
Lee, Y and M. Hobday (2003) Korea’s New Globalization Strategy: Can Korea Become a Business Hub in Northeast Asia? Management Decision;; 41, 5/6; ABI/INFORM Global p. 498.
Lu, C. S. and C. C. Yang. (2006) Comparison of Investment Preferences for International Logistics Zones in Kaohsiung, Hong Kong, and Shanghai Ports from a Taiwanese Manufacturer’s Perspective, Transportation Journal; Winter 2006; 45, 1; ABI/INFORM Global p. 30.
MacCormack A. D., L. J. Newman, D.B. Rosenfield. (1994) The New Dynamics of Global Manufacturing Site Location, Sloan Management Review; Summer 1994; 35, 4.
Marine Calculators and Converters, <http://www.portfocus.com> Oum, T. H. and J. H. Park. (2004) Multinational Firm’s Location
Preference for Regional Distribution Centers: Focus on the Northeast Asian Region, Transportation Research Part E 40 pp.101–121.
Tatoglu, E. and K.W. Glaister. (1998) Western MNCs' FDI in Turkey: An Analysis of Location Specific Factors, Management International Review; Second Quarter; 38, 2; ABI/INFORM Global p. 133.
Thai, V.V, and D. Grewal. (2005) Selecting the Location of Distribution Centre in Logistics Operations: A Conceptual Framework and Case Study, Asia Pacific Journal of Marketing and Logistics, Volume 17, Number 3. Ulgado, F. M. (1996) Location Characteristics of Manufacturing Investments in the U.S.: A Comparison of American and Foreign Based Firms. Management International Review; First Quarter; 36, 1; ABI/INFORM Global p. 7.
UNESCAP (Economic and Social Commission For Asia and The Pacific), Regional Shipping and Port Development, Container Traffic Forecast 2007 Update, New York.
Vos, B., and H. Akkermans. (1996) Capturing the Dynamics of Facility Allocation, International Journal of Operations & Production Management, Vol. 16,No. 11, pp. 57-70.
75 http://www.csavnorasia.com/pages/servicepro_nabs.html#; http://comtrade.un.org/db/mr/rfCommoditiesList.aspx?px=H2&cc=TOTAL > http://www.klineurope.com/container-services/schedule.asp?sg=eur_med_asa&di=w;; http://www.kline.co.jp/news/2007/070827_e.htm;,