Expression of the insulin-like growth factor (IGF) gene family in feline uterus
during pregnancy
Özgecan Korkmaz Ağaoğlua, Ali Reha Ağaoğlub, Özlem Özmenc, Mustafa Saatcid, Sabine Schäfer-Somie,
and Selim Aslanf
aDepartment of Animal Science, Faculty of Veterinary Medicine, Burdur Mehmet Akif Ersoy University, Burdur, Turkey; bDepartment of Obstetrics and Gynecology, Faculty of Veterinary Medicine, Burdur Mehmet Akif Ersoy University, Burdur, Turkey; cDepartment of Pathology, Faculty of Veterinary Medicine, Burdur Mehmet Akif Ersoy University, Burdur, Turkey; dDepartment of Animal Science, Fethiye Agriculture Faculty, Muğla Sıtkı Koçman University, Muğla, Turkey; eCentre for Artificial Insemination and Embryo Transfer, University of Veterinary Medicine, Vienna, Austria; fDepartment of Obstetrics and Gynecology, Veterinary Faculty, Near East University, Mersin, Turkey
ABSTRACT
Members of the IGF gene family participate in cell differentiation and proliferation during pregnancy. We used 35 cats assigned to experimental groups (G) based on pregnancy stages: G1, pre-implantation; G2, implantation; G3, early pregnancy; G4, mid-pregnancy; G5, nonpregnant. Quantitative polymerase chain reaction (qPCR) and immunohistochemistry were used to analyze the expression of the IGF gene family. During pregnancy, expression of IGF-1 gene was significantly greater at implantation sites in the G1 and G2 groups than at placentation sites in G3 and G4 groups. IGF-2 expression was greater in the G2, G3 and G4 groups than in G1. Expression of the IGF-1R gene was significantly greater at placental sites in G3 than in G1 and G4. IGF-2R genes were expressed in all groups. Insulin-like growth factor binding proteins (IGFBPs) were expressed at intensities that depended on the stage of pregnancy; they were detected in different cell types and at different sites in the uterus. We found that members of the IGF gene family were expressed differentially in the endometrium during pregnancy. Our findings suggest that the IGF family may be a regulatory factor for pregnancy in cats.
KEYWORDS
Cat; gene expression; IGF family; pregnancy
Understanding the mechanisms of pregnancy in domestic animals is essential for developing assisted reproductive technologies and for solving infertility problems. The biochemical interactions between mother and fetus, which are established by various cytokines, hormones and the immune system, begin during the first contact between the embryo and endometrium, and last until birth (Mendelson 2009; Bazer et al. 2011; Ott et al. 2014).
The insulin-like growth factor (IGF) family plays an essential role during pregnancy (Forbes and Westwood
2008). There are two isoforms of IGF, IGF-1 and IGF-2; two cell surface receptors, IGF-1R and IGF-2R; and six binding proteins, IGFBP1 − 6 (Le Roith 2003). IGFs are crucial for uterine and embryonic cell proliferation and differentiation (Keller et al. 1998). For example, in female dogs, IGF-1 is expressed in the endometrium from the peri-implantation stage until day 35 of pregnancy, while IGF-2 is expressed only during mid-pregnancy at placental sites (Beceriklisoy et al. 2009). In cats, IGF-2 gene expression increases from pre-implantation until
mid-gestation (Agaoglu et al. 2016). IGF-2 also participates in trophoblast invasion in humans (Han et al. 1996) and mice (Han and Carter 2000). Insulin- like growth factor binding proteins (IGFBPs) control the bioactivity of IGF-1 and IGF-2 (Allard and Duan 2018). IGFBPs are expressed in many tissues during pregnancy including endometrial cells at implantation sites in cats (Boomsma et al. 1994), luminal and glandular epithelia in sheep (Simmons et al. 2009) and uterine luminal fluid in pigs (Ashworth et al. 2005). IGFBP3 expression decreases in the endometrium during early pregnancy in cattle (Robinson et al. 2000). In women, IGFBP-4, -5, -6 are expressed in placental cells and IGFBP-2, -4, -5 are expressed in the maternal decidua (Petraglia et al. 2006).
We hypothesized that members of the IGF gene family are expressed differentially in the uterus during feline pregnancy. We investigated this by identifying the gene expressions of IGF-1, IGF-2, IGF-1R, IGF-2R and IGFBPs in cat uterine tissue during pregnancy using quantitative polymerase chain reaction (qPCR) and immunohistochemistry.
CONTACT Özgecan Korkmaz Ağaoğlu [email protected] Department of Animal Science, Faculty of Veterinary Medicine, Burdur Mehmet Akif Ersoy University, Burdur 15030, Turkey
https://doi.org/10.1080/10520295.2020.1818285
Material and methods
Animals and tissue sampling
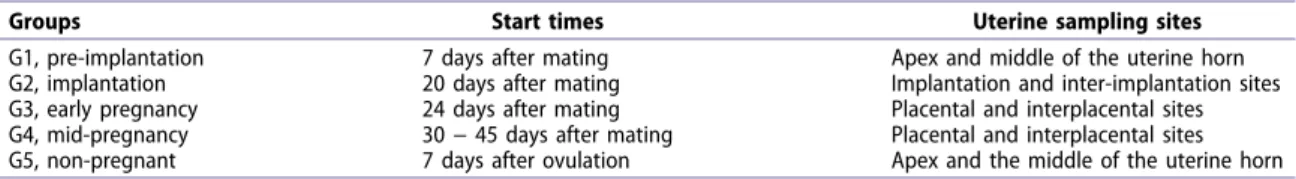
Our study was approved by the Local Ethics Committee on Animal Experiments at Burdur Mehmet Akif Ersoy University (Approval no: 2014–66). We used healthy cats brought to our clinics by their owners for neutering. The cats were assigned to groups of seven according to mating or estrus days: group 1 (G1), pre-implantation group, 7 days after mating; group 2 (G2), implantation group, 20 days after mating; group 3 (G3), early pregnancy, 24 − 25 days after mating; group 4 (G4), mid-pregnancy, 30 − 45 days after mating; group 5 (G5), non-pregnant control group, 7 days after ovulation without mating. For group G5, estrus was determined based on the reports from owners and ovulation induced by 25 mcg/cat GnRH analog (Buserelin acetate (Receptal: MSD Animal Health, İstanbul, Turkey) administration intramuscularly. Ovariohysterectomy was performed to neuter all cats and uterine samples were collected. In groups G1 and G5, after the operations the uterine lumina were flushed with Ringer’s lactate solution and pregnancy or ovulation was confirmed by embryo or oocyte retrieval. In the other groups, gestation days were determined by mating data provided by the owners and verified in groups G2, G3 and G4 by inspection of samples of pregnant uterus obtained by excision of 1 cm3 specimens from implantation and inter-implantation sites (Table 1) for RNA analysis and immunohistochemistry. Samples were not taken from conceptuses.
Total RNA isolation
Total RNA isolation was performed using the TRIzol method (TRIzol; Invitrogen, Carlsbad, CA). Approximately 50 mg of frozen tissue samples were placed in sterile tubes with 1 ml TRIzol reagent and homogenized using a homogenizer (HG-15D; Daihan Scientific Co., Ltd., Wonju, Korea). The homogenate was transferred to a clean tube and 200 μl chloroform was added. The mixture was vortexed vigorously for approximately 10 sec until thoroughly mixed, then incubated at room temperature for 3 min. The suspension was centrifuged at 12,000 x g for 15 min
at 4 °C. Following centrifugation, the upper aqueous phase containing RNA was placed in a clean tube, 500 μl isopropyl alcohol was added, the tube was inverted 20 times for mixing, then incubated 10 min at room temperature. The sample was centrifuged at 12,000 x g for 10 min at 4 °C. After centrifugation, the supernatant was removed. The RNA pellet was washed twice with 1 ml 75% and once with 1 ml 95% ethanol, then centrifuged at 7,500 x g for 5 min at 4 °C. The supernatant was removed and the RNA pellet was air dried, then dissolved in diethylpyrocarbonate (DEPC) treated water. The quality of total RNA was determined by electrophoresis using an agarose gel. Intact RNA is characterized by clear 28S and 18S bands after ethidium bromide staining in agarose gel (Kingston et al. 1996).
Spectrophotometric analysis was used to determine the purity and average concentration of nucleic acids. This analysis is based on measuring the degree of ultraviolet light absorption by nucleic acids. A ratio of absorbance at 260 and 280 nm of approximately 2 generally is accepted as indicating high purity of RNA. We used a NanoDrop ND-2000 (Thermo Fischer Scientific, Wilmington, DE) to both calculate sample concentration and purity based on the ratio of absorbance at 260/280 nm. DNAse-I (Thermo Fisher Scientific, Wilmington, DE) digestion was used to eliminate DNA contamination. A RevertAid First Strand cDNA Synthesis kit (Thermo Fisher Scientific) was used to synthesize cDNA. The reaction mixture was prepared using total RNA, 1 μl oligo (dT)18 primer and nuclease-free water up to 12 μl final volume. The following components were added: 4 μl 5 x reaction buffer, 1 μl RiboLock RNase inhibitor, 2 μl 10 mM dNTP mix and 1 μl RevertAid M-MuLV RT. The mixture was incubated at 42 °C for 60 min for cDNA synthesis, then incubated at 25 °C for 5 min for hexamer primer synthesis. The reaction finally was terminated by heating at 70 °C for 5 min.
Primer design and qPCR
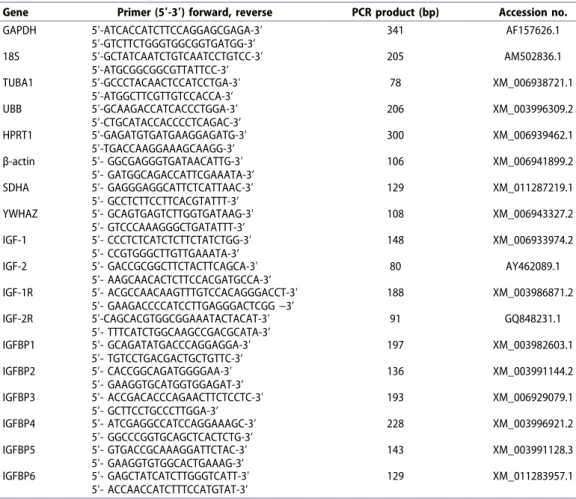
Primer sets for the housekeeping and IGF family genes amplified by PCR were used for qPCR (Table 2). Primers were designed using idt/PrimerQuest (Integrated DNA
Table 1. Tissue samples from experimental groups.
Groups Start times Uterine sampling sites
G1, pre-implantation 7 days after mating Apex and middle of the uterine horn G2, implantation 20 days after mating Implantation and inter-implantation sites G3, early pregnancy 24 days after mating Placental and interplacental sites G4, mid-pregnancy 30 − 45 days after mating Placental and interplacental sites G5, non-pregnant 7 days after ovulation Apex and the middle of the uterine horn n = 7 for all groups.
Technologies, Coralville, IA), ncbi/tools/primer-blast (NCBI, Bethesda MD) online design tools and previously published sequences were used for GAPDH (Boerboom et al. 2004), 18S (Zhang et al. 2009), HPRT1 (Zhang et al. 2009), UBB (Bogaert et al. 2006) and TUBA1 (Bogaert et al. 2006) genes. Primer efficiencies were determined using two-fold serial dilutions of cDNA.
The expression profiles of all genes were determined by qPCR. The reaction mixture was prepared using 12.5 μl SYBR Green Master Mix (2 x), 5 pM of each primer, 1 μl cDNA and double distilled H2O up to 25 μl final volume. The thermal cyclic method employed a Nano Lightcycler instrument (Roche Diagnostics Corp., Indianapolis, IN) and used initial denaturation at 95 °C for 10 min, then 40 cycles of denaturation, annealing and amplification (95 °C, 30 sec; 60 °C, 30 sec; 72 ° C, 30 sec). The entire procedure was conducted twice from RNA isolation to qPCR. The melting curve analysis is used to check the qPCR product for artifacts and to ensure reaction specificity, because the melting temperature of nucleic acids is affected by chain length.
Histopathology and immunohistochemistry
Tissue samples were fixed in 10% neutral formalin. Samples were taken from two different sites in the uterus as described in Table 1. Samples were processed through graded alcohols from 70% to absolute and two baths of xylene using an ASP300S automatic tissue processor (Leica, Wetzlar, Germany) Samples then were embedded in paraffin wax. Sections were cut at 5 μm using a RM2155microtome (Leica). After mounting on slides, sections were deparaffinized and rehydrated, then stained with hematoxylin and eosin (H & E) (Luna 1968) and examined microscopically. Sections were evaluated in a blinded manner by a pathologist for pathological alterations and a semiquantitative scoring system was used to evaluate findings. The histopathological changes were scored as: 0, no damage; 1, minimal hemorrhage and degeneration; 2, moderate hemorrhage and slight necrosis; 3, severe hemorrhage and marked necrosis.
After histopathological examination, serial sections were mounted on poly-L-lysine coated glass slides and immunostained. All primary and secondary antibodies were purchased from Abcam (Cambridge, UK). Antigen retrieval was performed according to kit instructions. We
Table 2. Primers used for qPCR.
Gene Primer (5ʹ-3ʹ) forward, reverse PCR product (bp) Accession no.
GAPDH 5ʹ-ATCACCATCTTCCAGGAGCGAGA-3ʹ 5ʹ-GTCTTCTGGGTGGCGGTGATGG-3’ 341 AF157626.1 18S 5ʹ-GCTATCAATCTGTCAATCCTGTCC-3ʹ 5ʹ-ATGCGGCGGCGTTATTCC-3’ 205 AM502836.1 TUBA1 5ʹ-GCCCTACAACTCCATCCTGA-3ʹ 5ʹ-ATGGCTTCGTTGTCCACCA-3’ 78 XM_006938721.1 UBB 5ʹ-GCAAGACCATCACCCTGGA-3ʹ 5ʹ-CTGCATACCACCCCTCAGAC-3’ 206 XM_003996309.2 HPRT1 5ʹ-GAGATGTGATGAAGGAGATG-3ʹ 5ʹ-TGACCAAGGAAAGCAAGG-3’ 300 XM_006939462.1 β-actin 5ʹ- GGCGAGGGTGATAACATTG-3ʹ 5ʹ- GATGGCAGACCATTCGAAATA-3’ 106 XM_006941899.2 SDHA 5ʹ- GAGGGAGGCATTCTCATTAAC-3ʹ 5ʹ- GCCTCTTCCTTCACGTATTT-3’ 129 XM_011287219.1 YWHAZ 5ʹ- GCAGTGAGTCTTGGTGATAAG-3ʹ 5ʹ- GTCCCAAAGGGCTGATATTT-3’ 108 XM_006943327.2 IGF-1 5ʹ- CCCTCTCATCTCTTCTATCTGG-3ʹ 5ʹ- CCGTGGGCTTGTTGAAATA-3’ 148 XM_006933974.2 IGF-2 5ʹ- GACCGCGGCTTCTACTTCAGCA-3ʹ 5ʹ- AAGCAACACTCTTCCACGATGCCA-3’ 80 AY462089.1 IGF-1R 5ʹ- ACGCCAACAAGTTTGTCCACAGGGACCT-3ʹ 5ʹ- GAAGACCCCATCCTTGAGGGACTCGG −3’ 188 XM_003986871.2 IGF-2R 5ʹ-CAGCACGTGGCGGAAATACTACAT-3ʹ 5ʹ- TTTCATCTGGCAAGCCGACGCATA-3’ 91 GQ848231.1 IGFBP1 5ʹ- GCAGATATGACCCAGGAGGA-3ʹ 5ʹ- TGTCCTGACGACTGCTGTTC-3’ 197 XM_003982603.1 IGFBP2 5ʹ- CACCGGCAGATGGGGAA-3ʹ 5ʹ- GAAGGTGCATGGTGGAGAT-3’ 136 XM_003991144.2 IGFBP3 5ʹ- ACCGACACCCAGAACTTCTCCTC-3ʹ 5ʹ- GCTTCCTGCCCTTGGA-3’ 193 XM_006929079.1 IGFBP4 5ʹ- ATCGAGGCCATCCAGGAAAGC-3ʹ 5ʹ- GGCCCGGTGCAGCTCACTCTG-3’ 228 XM_003996921.2 IGFBP5 5ʹ- GTGACCGCAAAGGATTCTAC-3ʹ 5ʹ- GAAGGTGTGGCACTGAAAG-3’ 143 XM_003991128.3 IGFBP6 5ʹ- GAGCTATCATCTTGGGTCATT-3ʹ 5ʹ- ACCAACCATCTTTCCATGTAT-3’ 129 XM_011283957.1
used rabbit polyclonal anti-IGF1 antibody (ab9572) for IGF-1; rabbit polyclonal anti-IGF2 antibody (ab170304) for IGF-2; rabbit polyclonal anti-IGF1 receptor (phospho Y1161) antibody (ab39398) for IGF-1R; mouse monoclonal anti-M6PR (cation independent) antibody 2G1 (ab2733) for IGF-2R; rabbit polyclonal anti-IGFBP1 antibody (ab111203) for IGFBP1; rabbit polyclonal anti- IGFBP2 antibody (ab91404) for IGFBP2; rabbit polyclonal anti-IGFBP3 antibody-N-terminal (ab75988) for IGFBP3; rabbit polyclonal anti-IGFBP4 antibody ab83846) for IGFBP4; rabbit polyclonal anti-IGFBP5 antibody (ab4255) for IGFBP5; and goat polyclonal anti- IGFBP6 antibody (ab109765) for IGFBP6 using a routine streptavidin-biotin peroxidase technique (Topsakal et al.
2019). An EXPOSE Mouse and Rabbit Specific HRP/DAB Detection IHC kit (ab80436; Abcam, Cambridge, UK) was used as the secondary antibody. Goat anti-rabbit IgG HL (HRP) (ab6721) was used as converting protein for the IGFBP6 primary antibody; all antibodies were diluted 1:100.
The specificity and reactivity of the antibodies in cats were checked with feline tissues before using the reagents. Rabbit IgG was used instead of primary antibodies as negative controls. All examinations were performed by a pathologist who was unaware of the identity of the groups. All sections were graded using a semiquantitative grading system for intensity of staining in 10 fields in five sections at 40 x for each sample: 0, no staining; 1, slight staining; 2, medium staining; 3, intense staining. Morphometric evaluation was performed using the Database Manual Cell Sens Life Science Imaging Software (Olympus Corp., Tokyo, Japan).
Statistical analysis
The geNormTM software version 3.0 (Biogazelle, Zwijnaarde, Belgium) was used to determine the most stable and suitable reference gene selection. The data were normalized using glyceraldehyde 3-phosphate dehydrogenase (GAPDH) as the reference. Normalization was conducted according to the delta-delta Ct mathematical model (Livak and Schmittgen 2001). Minitab v. 16.0 (MINITAB 16.0 for windows; Minitab Ltd., Conventry, UK) was used for statistical analysis of the data after normalization.
The Kruskal-Wallis test was used to identify potential differences between the groups. The Mann Whitney U test was used for multiple comparisons. The Wilcoxon test was used to determine differences for placental and interplacental sites. Box plots were created for visual evaluation. Immunohistochemistry results were assessed by Bonferroni test, and ANOVA test was used to compare groups. Statistical analysis is summarized in Table 3. Values for p ≤ 0.05 were considered statistically significant.
Results
Gene expression profiles
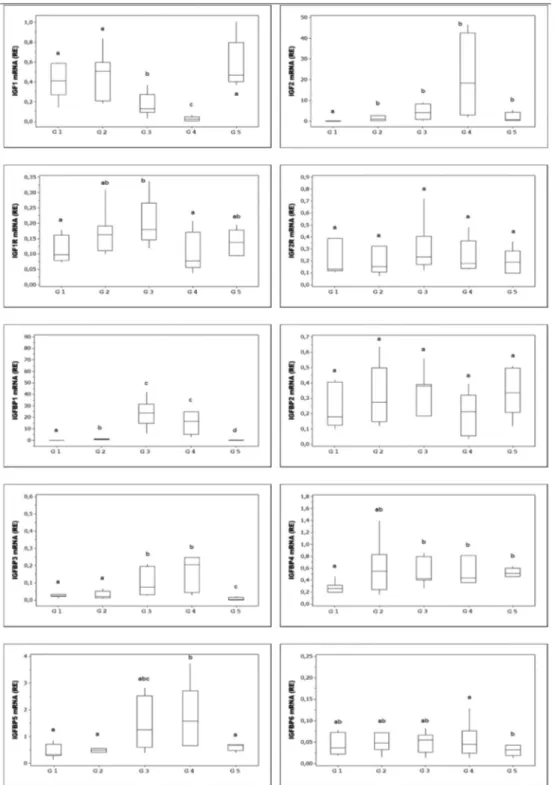
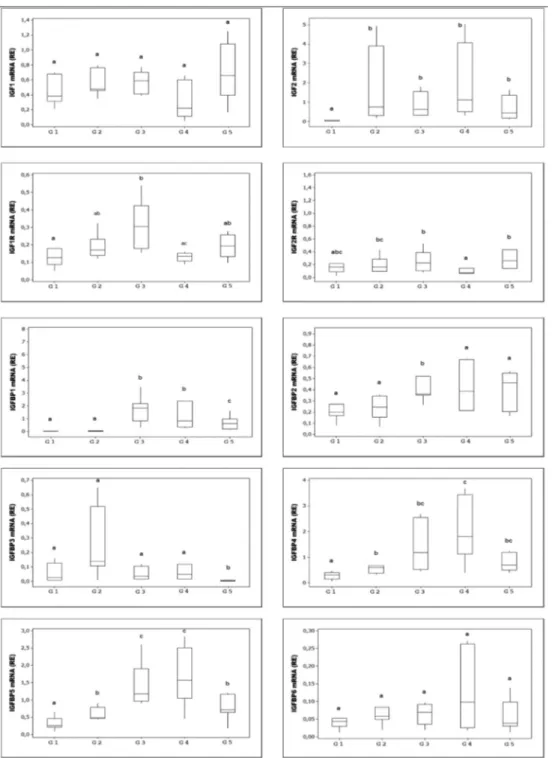
All genes were expressed in all uterine samples. The expression profiles of the IGF gene family are illustrated in Figures 1−3. IGF-1 gene expression was relatively high in the pre-implantation and implantation groups and decreased significantly between early and mid- pregnancy at placental sites. The IGF-1R and IGF-1
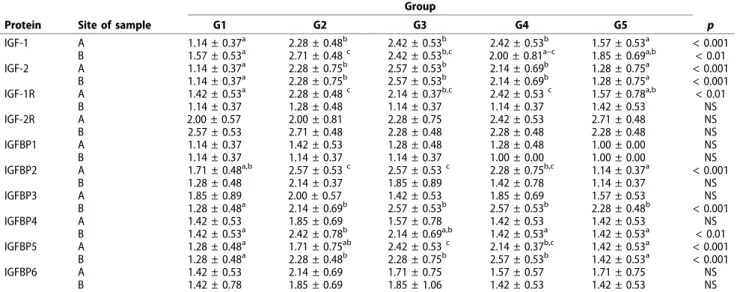
Table 3. Statistical analysis of immunohistochemical scores among groups. Protein Site of sample
Group p G1 G2 G3 G4 G5 IGF-1 A 1.14 ± 0.37a 2.28 ± 0.48b 2.42 ± 0.53b 2.42 ± 0.53b 1.57 ± 0.53a < 0.001 B 1.57 ± 0.53a 2.71 ± 0.48 c 2.42 ± 0.53b,c 2.00 ± 0.81a–c 1.85 ± 0.69a,b < 0.01 IGF-2 A 1.14 ± 0.37a 2.28 ± 0.75b 2.57 ± 0.53b 2.14 ± 0.69b 1.28 ± 0.75a < 0.001 B 1.14 ± 0.37a 2.28 ± 0.75b 2.57 ± 0.53b 2.14 ± 0.69b 1.28 ± 0.75a < 0.001 IGF-1R A 1.42 ± 0.53a 2.28 ± 0.48 c 2.14 ± 0.37b,c 2.42 ± 0.53 c 1.57 ± 0.78a,b < 0.01 B 1.14 ± 0.37 1.28 ± 0.48 1.14 ± 0.37 1.14 ± 0.37 1.42 ± 0.53 NS IGF-2R A 2.00 ± 0.57 2.00 ± 0.81 2.28 ± 0.75 2.42 ± 0.53 2.71 ± 0.48 NS B 2.57 ± 0.53 2.71 ± 0.48 2.28 ± 0.48 2.28 ± 0.48 2.28 ± 0.48 NS IGFBP1 A 1.14 ± 0.37 1.42 ± 0.53 1.28 ± 0.48 1.28 ± 0.48 1.00 ± 0.00 NS B 1.14 ± 0.37 1.14 ± 0.37 1.14 ± 0.37 1.00 ± 0.00 1.00 ± 0.00 NS IGFBP2 A 1.71 ± 0.48a,b 2.57 ± 0.53 c 2.57 ± 0.53 c 2.28 ± 0.75b,c 1.14 ± 0.37a < 0.001 B 1.28 ± 0.48 2.14 ± 0.37 1.85 ± 0.89 1.42 ± 0.78 1.14 ± 0.37 NS IGFBP3 A 1.85 ± 0.89 2.00 ± 0.57 1.42 ± 0.53 1.85 ± 0.69 1.57 ± 0.53 NS B 1.28 ± 0.48a 2.14 ± 0.69b 2.57 ± 0.53b 2.57 ± 0.53b 2.28 ± 0.48b < 0.001 IGFBP4 A 1.42 ± 0.53 1.85 ± 0.69 1.57 ± 0.78 1.42 ± 0.53 1.42 ± 0.53 NS B 1.42 ± 0.53a 2.42 ± 0.78b 2.14 ± 0.69a,b 1.42 ± 0.53a 1.42 ± 0.53a < 0.01 IGFBP5 A 1.28 ± 0.48a 1.71 ± 0.75ab 2.42 ± 0.53 c 2.14 ± 0.37b,c 1.42 ± 0.53a < 0.001 B 1.28 ± 0.48a 2.28 ± 0.48b 2.28 ± 0.75b 2.57 ± 0.53b 1.42 ± 0.53a < 0.001 IGFBP6 A 1.42 ± 0.53 2.14 ± 0.69 1.71 ± 0.75 1.57 ± 0.57 1.71 ± 0.75 NS B 1.42 ± 0.78 1.85 ± 0.69 1.85 ± 1.06 1.42 ± 0.53 1.42 ± 0.53 NS Differences between means of groups with different superscripts in the same column are statistically significant. NS, not significant; A, apex of uterine horn
(G1 and G5), implantation (G2), placentation sites (G3 and G4); B, middle of uterine horn (G1 and G5), inter-implantation (G2), interplacentation sites (G3 and G4). G: group.
gene expression profiles at placental sites were comparable; receptor gene expression increased until early pregnancy. During mid-pregnancy, expression of IGF-1R decreased to the pre-implantation level (Figure 1). IGF-1 and IGF-1R gene expression at interplacental sites paralleled the course of these genes at the placental
sites (Figure 2). The IGF-1 gene was expressed more strongly at the interplacental sites than at placental sites during early and mid-pregnancies (p < 0.05) (Figure 3). To the contrary, the IGF-2 gene expression at placental sites increased from pre-implantation to later gestation stages (p < 0.05) and the expression level at the pre-
Figure 1. Box plots showing differences among the groups for each gene at apex of the uterine horn (G1, G5), implantation (G2), placentation sites (G3, G4).
implantation stage was less than for the nonpregnant group (p < 0.05) (Figure 1).
IGF-2R gene expression at placental sites did not differ significantly among groups (Figure 1); however, expression increased toward early pregnancy and a significant decrease was observed at interplacental sites at mid-pregnancy (Figure 2) (p < 0.05).
Expression of IGFBP1, 3, 4 and 5 genes at the placental sites was similar during early and mid- pregnancy. IGFBP2 expression did not change
during pregnancy. IGFBP4 was lowest at the pre- implantation stage; however, the expression at later stages did not differ significantly from the nonpregnant group. Gene expression of IGFBP6 was lowest in the controls (p < 0.05) (Figure 1). At interplacental sites, IGFBP1-5 expression was similar to IGFBP1, 3, 4 and 5 at the implantation site with variable peaks between implantation and mid- pregnancy. IGFBP6 expression did not change during pregnancy (Figure 2).
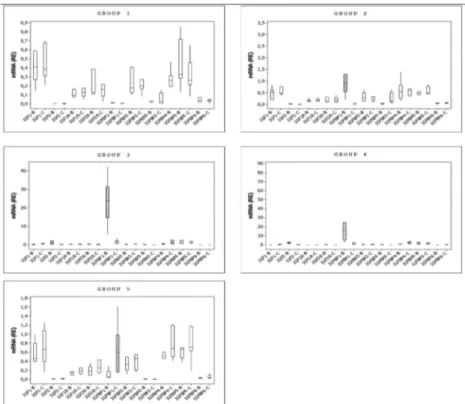
Figure 2. Box plots showing differences among the groups for each gene in middle of the uterine horn (G1, G5), inter-implantation (G2), interplacentation sites (G3, G4).
Histopathology
We found no pathology in the uterine samples (Figure 4).
Immunohistochemistry
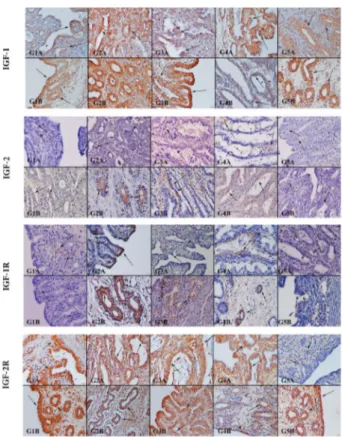
Immunohistochemical expression of the IGF gene family was observed in endometrial cells at different stages of pregnancy (Figure 5–7). During pre-implantation, IGF-1 was observed widely in the luminal epithelium, but rarely in the glandular epithelium and stroma. The glandular epithelium was stained weakly at implantation sites and strongly at inter-implantation sites. IGF-1R immunostaining was observed in the luminal and
glandular epithelium in the pre-implantation, implanta- tion and nonpregnant groups; it also was stained weakly in the stroma during early and mid-pregnancy. IGF-1 immunostaining was observed at a moderate level in the stroma at implantation sites and in luminal and glandular epithelium at interplacental sites during placentation. In the nonpregnant group, IGF-1 was localized in the glandular epithelium (Figure 5).
IGF-2 was immunostained weakly in the stroma of all samples. IGF-2R was localized in the luminal and glandular epithelium in the pre-implantation, early pregnancy and nonpregnant groups; it also was localized in the stroma and glandular epithelium in the implantation and mid-pregnancy groups (Figure 5).
IGFBPs were observed at different intensities in various endometrial cells at different stages of pregnancy. In the preimplantation group, IGFBP2 and 3 immunostaining was observed in both luminal and glandular epithelium; stroma also stained weakly for IGFBP-1, -4, -5 and -6. In the nonpregnant group, IGFBP-2, -3 and -5 were localized in the luminal and glandular epithelium. IGFBP-1, -4 and -6 were weakly immunostained in stroma cells. In the implantation group, IGFBP-1, -2, -3 and -6 were stained strongly in the glandular, luminal and stromal epithelium. To the contrary, IGFBP-4 and -5 exhibited weak immunostaining in stromal cells. The stromal cells
Figure 3. Box plots showing differences within each group between two samples for each gene. The letter “B” defines the apex of the uterine horn (G1, G5), implantation site (G2), placentation site (G3, G4). The letter “C” defines the middle of the uterine horn (G1 and G5), inter-implantation site (G2), interplacentation sites (G3, G4).
Figure 4. Histological appearance of the uterus. A) Apex of the uterine horn (G1, G5), implantation site (G2) placental site (G3, G4). B) Middle of uterine horn (G1, G5), inter-implantation site (G2), interplacental site (G3, G4), H & E.
stained weakly for IGFBP-1, -3, -4 and -6 in the uterine tissues of the early pregnancy group (G3). Also, IGFBP2 was localized in the glandular epithelium at the placental site and in the luminal epithelium at interplacental sites. IGFBP-5 was immunostained in glandular cells in the placental group. IGFBP-1, -2, -4 and -6 were immunostained strongly in the glandular epithelium and stroma in the mid-pregnancy group. IGFBP-3 and -5 exhibited weak reaction in the stroma in the mid- pregnancy group (Figure 6). Generally, expressions of all markers increased with advancing gestation. Statistical analysis of results of immunostaining are shown in Table 3. Discussion
We investigated the IGF gene family expression during pregnancy and its effects on endometrial development. We found that expression of IGF-1 and its receptor
increased during early pregnancy. It has been reported that for other species, IGF-1 expression in the endometrium was regulated by estradiol (Hana and Murphy 1994; Robinson et al. 2000) and progesterone (Kapur et al. 1992). In cats, serum estradiol levels remain high for the first days after mating, then decrease, after which progesterone levels increase rapidly (Verhage et al. 1976). Within the placenta, estradiol concentration increases until approximately day 40, then
Figure 5. IGF-1, IGF-2, IGF-1R and IGF-2R immunoreactions in the uterus. IGF-1was observed especially in luminal and glandular cells. Slight to moderate staining of IGF-2 was observed in endometrial cells. IGF-1R was observed in some endometrial cells. IGF-2R was observed in endometrial and glandular cells depending on pregnancy stages (cells indicated by arrows). The markers were expressed strongly at the implantation and preimplantation stages. IGF-1 the most commonly expressed marker in all uterine samples. A) Apex of uterine horn (G1, G5), implantation site (G2) placental site (G3, G4). B): Middle of uterine horn (G1, G5), inter-implantation site (G2) interplacental site (G3, G4).
Figure 6. IGFBPs immunoreactions in uterus. IGFBP1, -4 and -6 immunostaining was slight to moderately positive in endometrial cells. IGFBP2, -3 and -5 immunoreactions were observed in luminal and glandular cells from G1, G2, G3, G4 and G5 (cells indicated by arrows). A) Apex of the uterine horn (G1, G5), implantation site (G2), placental site (G3, G4). B) Middle of uterine horn (G1, G5), inter-implantation site (G2), interplacental site (G3, G4).
decreases continuously until parturition (Braun et al.
2012), which parallels the course of IGF-1 and its receptor. Both hormones could play a regulating role for IGF-1 and IGF-1R gene expression.
IGF-1 participates in growth and development of endometrium (Laron 2001); therefore, immuno- histochemical localization of IGF-1 in the endometrium is vital for explaining the role of IGF- 1 during pregnancy. IGF-1 is expressed in the glandular and the luminal epithelium during early pregnancy in pigs (Miese-Looy et al. 2012) and cattle (Robinson et al. 2000). Immunohistochemical detection of IGF-1 is associated with the ability of the luminal epithelial cells to undergo the differentiation required for implantation. This differentiation occurs due to the proliferative effects of IGF-1 on endometrial cells (Robinson et al. 2000). We detected weak IGF-1 expression in stroma at the implantation sites, which suggests that IGF-1 participates less in this gestational stage than in other stages. At later stages of pregnancy, glandular epithelium and stromal cells were stained strongly for IGF-1.
We found that IGF-1R gene expression decreased parallel to IGF-1 during mid-gestation, sometimes even to below the levels for the nonpregnant group. The high IGF-1R gene expression during early pregnancy may be due to the onset of placentation. We suggest that IGF-1 and IGF-1R may play a more active role prior to placentation than during later gestational stages in cats, which also has been reported for women (Hayati et al. 2007).
In women, an important function of IGF-2 during pregnancy is to stimulate the interdigitation of chorionic villi with the endometrium (Han et al.
1996). IGF-2 exhibits greater expression in the uterine tissue of pregnant dogs than nonpregnant dogs (Kautz et al. 2014). We found that both IGF-1 and IGF-2 expressions at the pre-implantation stage were similar to those reported earlier for the same stage of pregnancy in dogs (Kautz et al. 2014); this corroborated our findings for cats (Agaoglu et al.
2016). We found greater IGF-2 expression at placental sites than at interplacental sites in cats during early and mid-pregnancy, which might indicate that IGF-2 expression increases in trophoblasts as gestation progresses (Han et al. 1996). In dogs, endometrial IGF-2 expression was identified on days 10 − 12 of pregnancy and up-regulation was reported during implantation. Up-regulation of IGF-2 might be related to differentiation and development of the uterus for implantation (Beceriklisoy et al. 2009; Kautz et al.
2014).
IGF-2R participates in preparing the uterus for implantation, formation of the placenta and regulation of IGF-2 (Coan et al. 2006). We found that IGF-2 in all tissues generally stained weakly in the stroma and a wide variety of uterine cells of the feline endometrium at the implantation site in all groups. IGF-2R stained weakly in a wide variety of uterine cells in all groups. We conclude that IGF-2 and IGF- 2R participate in the development of endometrium during early pregnancy.
The functions of IGF-1 and IGF-2 are regulated by IGFBPs that bind IGF receptors (Lewitt and Boyd
2019). IGFBP-1 and IGFBP-3 also affect cell proliferation independent of IGFs (Oh et al. 1993). IGFBPs usually are expressed in the endometrial stroma from pre-implantation (Liu et al. 1995) to late pregnancy (Seppälä et al. 1994).
IGFBP1 participates in placentation and trophoblast proliferation in sheep (Simmons et al. 2009) and cats (Boomsma et al. 1994). We suggest that increasing expression of IGFBP-1 at implantation sites until early pregnancy may be required to control trophoblast invasion based on greater expression at placental sites than at interplacental sites. We found weakly immunostained cells in the stroma in the pre- implantation and nonpregnant groups, strongly stained cells in the glandular epithelium of the implantation group and slight to moderately stained cells in the stroma during early and mid-pregnancy. We conclude that IGFBP-1 remains functional until placentation is complete.
IGFBP-2 expression in the endometrial stroma is suppressed by the conceptus during the early pregnancy in cows (Robinson et al. 2000). Our investigation of IGFBP-2 revealed no difference in expression or localization of immunostained cells among all samples. This finding suggests a mechanism similar to cows, but the subject must be investigated in more detail.
The principal function of IGFBP-3 is induction of mitosis during proliferation and invasion of trophoblast; IGFBP-3 is localized in glandular epithelium and stroma in ruminants (Reynolds et al.
1997; Robinson et al. 2000). We found IGFBP-3 expression in all groups, but especially at early and mid-pregnancy stages, which corresponds to high trophoblast activity and likely indicates a promoting effect on trophoblast growth. This interpretation is supported by the fact that expression of IGFBP-3 was greatest in stromal and luminal epithelial cells at implantation and placentation sites in cats.
We found increased levels of IGFBP-4 gene expression in the endometrium during early and mid- pregnancy. Increased IGFBP-4 expression in the
placental regions after implantation is consistent with reports concerning mice (Markoff et al. 1995). Also, localization of IGFBP-4 in cats was similar to that in sheep (Gadd et al. 2000) and cows (Keller et al. 1998). We conclude that IGFBP-4 may play a regulating role in placenta formation and development.
IGFBP-5 is localized in glandular and luminal endometrium during trophoblast invasion in cows and sheep (Gadd et al. 2000; Robinson et al. 2000). We found increased IGFBP-5 expression toward mid- pregnancy similar to other species.
IGFBP-6 is expressed in the endometrial epithelium and stroma, and exhibits no changes during the first 50 days of pregnancy in pigs (Miese-Looy et al. 2012). We found no difference in expression level among or within groups. IGFBP-6 expression was observed in glandular epithelium and stroma during implantation, however, which suggests that it may participate in endometrial preparation for implantation.
We found some differences between gene and protein expressions of IGFBPs. These differences might be due to proteolytic degradation of IGFBPs; IGFBPs are fragmented by proteolytic enzymes. Owing to degradation, the binding affinity of IGFBPs varies for IGFs and differences may occur in IGF and IGFBP expression (Akkiprik et al.
2008). Some genes were highly expressed in the nonpregnant group. This may be due to the Buserelin acetate that was administered to stimulate ovulation; Buserelin is a synthetic GnRH analog (Shah et al. 2013). Buserelin not only stimulates ovulation, but also produces a larger and more biologically active corpora lutea (Lashari and Tasawar 2010), which could increase levels of progesterone. Therefore, progesterone or estradiol might have increased the expression of IGF-1, IGF-2, IGF-2R, IGFBP4 and IGFBP5 in the nonpregnant control group, although pregnancy did not occur.
Acknowledgments
Our study was supported by the Scientific and Technological Research Council of Turkey, project no.112O878, 114O729. A preliminary account of this study was presented in the XXth Congress of the European Veterinary Society for Small Animal Reproduction, Austria.
Disclosure statement
The authors declare no conflict of interest.
Funding
This work was supported by the Scientific and Technological Research Council of Turkey (TUBITAK) [112O878,114O729].
References
Agaoglu OK, Agaoglu AR, Guzeloglu A, Aslan S, Kurar E, Kayis SA, Schäfer-Somi S. 2016. Gene expression profiles of some cytokines, growth factors, receptors and enzymes (GM-CSF, IFNγ, MMP-2, IGF-II, EGF, TGF-β, IGF-IIR) during pregnancy in the cat uterus. Theriogenology. 85:638–644. doi:10.1016/j.theriogenology.2015.10.001
Akkiprik M, Feng Y, Wang H, Chen K, Hu L, Sahin A, Krishamurthy S, Ozer A, Hao X, Zhang W. 2008. Multifunctional roles of insulin-like growth factor binding protein 5 in breast cancer. Breast Cancer Res. 10:1–14. doi:10.1186%2Fbcr2116
Allard JB, Duan C. 2018. IGF-binding proteins: why do they exist and why are there so many? Front Endocrinol. 9. doi:10.3389/fendo.2018.00117.
Ashworth MD, Ross JW, Stein DR, Allen DT, Spicer LJ, Geisert RD. 2005. Endocrine disruption of uterine insulin-like growth factor expression in the pregnant gilt. Reproduction. 130:545–551. doi:10.1530/rep.1.00821
Bazer FW, Spencer TE, Johnson GA, Burghardt RC. 2011. Uterine receptivity to implantation of blastocysts in mammals. Front Biosci. 3:745–767. doi:10.2741/s184
Beceriklisoy HB, Schäfer-Somi S, Kücükaslan I, Agaoglu R, Gültiken N, Ay SS, Kaya D, Aslan S. 2009. Cytokines, growth factors and prostaglandin synthesis in the uterus of pregnant and non-pregnant bitches: the features of placental sites. Reprod Dom Anim. 44:115–119. doi:10.1111/j.1439-0531.2009.01443.x
Boerboom D, Brown KA, Vaillancount D, Poitras P, Goff AK, Watanabe K, Dore M, Sirois J. 2004. Expression of key prostaglandin synthases in equine endometrium during late diestrus and early pregnancy. Biol Reprod. 70:391–399. doi:10.1095/biolreprod.103.020800
Bogaert L, Van Poucke M, De Baere C, Peelman L, Gasthuys F.
2006. Selection of a set of reliable reference genes for quantitative real-time PCR in normal equine skin and in equine sarcoids. BMC Biotechnol. 6:1–7. doi:10.1186/1472- 6750-6-24
Boomsma RA, Mavrogianis PA, Fazleabas AT, Jaffe RC, Verhage HG. 1994. Detection of insulin like growth factor binding protein-1 cat implantation sites. Biol Reprod. 51:392–399. doi:10.1095/biolreprod51.3.392
Braun BC, Zschockelt L, Dehnhard M, Jewgenow K. 2012. Progesterone and estradiol in cat placenta-biosynthesis and tissue concentration. J Ster Biochem Mol Biol. 132:295–302. doi:10.1016/j.jsbmb.2012.07.005
Coan PM, Conroy N, Burton GJ, Ferguson-Smith AC. 2006. Origin and characteristics of glycogen cells in the developing murine placenta. Dev Dynam. 235:3280–3294. doi:10.1002/dvdy.20981
Forbes K, Westwood M. 2008. The IGF axis and placental function. Horm Res. 69:129–137. doi:10.1159/000112585
Gadd TS, Osgerby JC, Wathes DC. 2000. Regulation and localization of insulin like growth factor binding protein-5 gene expression in the uterus and placenta of the cyclic and early pregnant ewe. Biol Reprod. 62:1415–1421. doi:10.1095/ biolreprod62.5.1415
Han VK, Basset K, Walton J, Challis JRG. 1996. The expression of insulin like growth factor (IGF) and IGF binding protein genes in the human placenta and membranes: evidence for IGF:IGFBP interactions at the
feto-maternal interface. J Clin Endocrinol Metab. 81:2680–2693. doi:10.1210/jcem.81.7.8675597
Han VK, Carter AM. 2000. Spatial and temporal patterns of expression of messenger RNA for insulin-like growth factors and their binding proteins in the placenta of man and laboratory animals. Placenta. 21:289–305. doi:10.1053/ plac.1999.0498
Hana V, Murphy LJ. 1994. Interdependence of epidermal growth factor and insulin like growth factor-1 expression in the mouse uterus. Endocrinology. 135:107–112. doi:10.1210/endo.135.1.8013342
Hayati AR, Cheah FC, Tan AE, Tan GC. 2007. Insulin like growth factor-1 receptor expression in the placentae of diabetic and normal pregnancies. Early Hum Dev. 83:41–46. doi:10.1016/j.earlhumdev.2006. 04.002
Kapur S, Tamada H, Gey SK, Andrews GK. 1992. Expression of insulin like growth factor-I (IGF-I) and its receptor in the peri-implantation mouse uterus, and cell specific regulation of IGF-II gene expression by estradiol and progesterone. Biol Reprod. 46:208–219. doi:10.1095/biolreprod46.2.208
Kautz E, Gram A, Aslan S, Ay SS, Selçuk M, Kanca H, Koldaş E, Akal E, Karakaş K, Findik M, Boos A, Kowalewski MP. 2014. Expression of genes involved in the embryo maternal interaction in the early pregnant canine uterus. Reproduction. 147:703–717. doi:10.1530/ REP-13-0648
Keller ML, Roberts AJ, Seidel GE. 1998. Characterization of insulin like growth factor binding proteins in the uterus and conceptus during early conceptus elongation in cattle. Biol Reprod. 59:632–642. doi:10.1095/biolreprod59.3.632
Kingston RE, Chomczynski P, Sacchi N. 1996. Guanidine methods for total RNA preparation. In: Ausubel FM, Brent R, Kingston RE, Moore DD, Seidman JG, Smith JA, Struhl K, editors. Current protocols in molecular biology. John Wiley & Sons Inc.: New York; p. 4.16.1–4.16.16.
Laron Z. 2001. Insulin-like growth factor-1 (IGF-1): a growth hormone. Mol Pathol. 54:311–316. doi:10.1136/ mp.54.5.311
Lashari MH, Tasawar Z. 2010. The effect of GnRH given on day of mating on ovarian function and reproductive performance in Lohi sheep. Pak Vet J. 30:29–33.
Le Roith D. 2003. The insulin-like growth factor system. Exp Diabetes Res. 4:205–212. doi:10.1155/EDR.2003.205
Lewitt MS, Boyd GW. 2019. The role of insulin-like growth factors and insulin-like growth factor binding proteins in the nervous system. Biochem Insights. 12:1–18. doi:10.1177/1178626419842176
Liu HC, Mele C, Catz D, Noyes N, Rosenwak Z. 1995. Production of insulin like growth factor binding proteins (IGFBPs) by human endometrial stromal cells is stimulated by the presence of embryos. J Assist Reprod Gen. 12:78–87. doi:10.1007/bf02211374
Livak KJ, Schmittgen TD. 2001. Analysis of relative gene expression data using real-time quantitative PCR and the method. Methods. 25:402–408. doi:10.1006/ meth.2001.1262
Luna GL. 1968. Manual of histologic staining methods of the Armed Forces Institute of Pathology. 3rd ed. ed. McGraw Hill Book Co.: New York; p. 32–34.
Markoff E, Henemeyre C, Fellows J, Pennington E, Zeitler PS, Cedars MI. 1995. Localization of insulin like growth factor binding protein-4 expression in the mouse uterus during the peri-implantation period. Biol Reprod. 53:1103–1109. doi:10.1095/biolreprod53. 5.1103
Mendelson CR. 2009. Minireview: fetal-maternal hormonal signaling in pregnancy and labor. Mol Endocrinol. 23:947–954. doi:10.1210/me.2009-0016
Miese-Looy G, Van den Heuvel MJ, Edwards AK, Lamarre J, Tayade C. 2012. Expression of insulin like growth factor (IGF) family members in porcine pregnancy. J Reprod Dev. 58:51–60. doi:10.1262/jrd.09-191k
Oh Y, Muller HL, Pham H, Rosenfeld RG. 1993. Demonstration of receptors for insulin like growth factor binding protein 3 on Hs578T human breast cancer cells. J Biol Chem. 268:26045–26048.
Ott TL, Kamat MM, Vasudevan S, Townson DH, Pate JL.
2014. Maternal immune responses to conceptus signals during early pregnancy in ruminants. Anim Reprod. 11:237–245.
Petraglia F, Florio P, Torricelli M. 2006. Placental endocrine function. In: Plant TM, Zeleznik AJ, editors. Knobil and Neill’s physiology of reproduction. 3rd ed ed. Elsevier Inc.: San Diego (CA); p. 2847–2899.
Reynolds TS, Stevenson KR, Wathes DC. 1997. Pregnancy- specific alterations in the expression of the insulin-like growth factor system during early placental development in the ewe. Endocrinology. 138:886–897. doi:10.1210/ endo.138.3.4983
Robinson RS, Mann GE, Gadd TS, Lamming GE, Wathes DC. 2000. The expression of the IGF system in the bovine uterus throughout the oestrous cycle and early pregnancy. J Endocrinol. 165:231–243. doi:10.1677/ joe.0.1650231
Seppälä M, Koistinen R, Rutanen EM. 1994. Uterine endocrinology and paracrinology: insulin like growth factor binding protein-1 and placental protein 14 revisited. Hum Reprod. 9:917–925. doi:10.1093/ oxfordjournals.humrep.a138617
Shah S, Arvind G, Konda N, Prashanth P. 2013. Preparation and characterization of buserelin acetate loaded microspheres. Int J Pharm Sci. 5:548–554.
Simmons RM, Erikson DW, Kim J, Burghardt RC, Bazer FW, Johnson GA, Spencer TE. 2009. Insulin-like growth factor binding protein-1 in the ruminant uterus: potential endometrial marker and regulator of conceptus elongation. Endocrinology. 150:4295–4305. doi:10.1210/en.2009-0060
Topsakal S, Ozmen O, Ozgocmen M. 2019. Effects of alpha-lipoic acid on high fructose induced hepatic pathology. Biotech Histochem. 94:271–276. doi:10.1080/ 10520295.2018.1552019
Verhage HG, Beamer NB, Brenner RM. 1976. Plasma levels of estradiol and progesterone in the cat during polyestrous, pregnancy and pseudopregnancy. Biol Reprod. 14:579–585. doi:10.1095/biolreprod14.5.579
Zhang YW, Davis EG, Bai J. 2009. Determination of internal control for gene expression studies in equine tissues and cell culture using quantitative RT-PCR. Vet Immunol Immunopathol. 130:114–119. doi:10.1016/j. vetimm.2009.01.012.