Biomed. Phys. Eng. Express 6(2020) 045018 https://doi.org/10.1088/2057-1976/ab98e7
PAPER
New approach for designing cVEP BCI stimuli based on
superposition of edge responses
Muhammad Nabi Yasinzai and Yusuf Ziya Ider1
Department of Electrical and Electronics Engineering, Bilkent University, Ankara, Turkey
1 Author to whom any correspondence should be addressed.
E-mail:muhammad.nabi.yasinzai@gmail.comandider@ee.bilkent.edu.tr
Keywords: brain computer interface, coded visually evoked response, EEG, stimulus design, BCI speller Supplementary material for this article is availableonline
Abstract
The purpose of this study is to develop a new methodology for designing stimulus sequences for Brain
Computer Interfaces that utilize code modulated Visually Evoked Potentials
(cVEP BCIs), based on
experimental results regarding the behavior and the properties of the actual EEG responses of the
visual system to binary-coded visual stimuli, such that training time is reduced and possible number of
targets is increased. EEG from 8 occipital sites is recorded with 2000 sps, in response to visual stimuli
presented on a computer monitor with 60 Hz refresh rate. EEG responses of the visual system to
black-to-white and white-to-black transitions of a target area on the monitor are recorded for 500 ms, for
160 trials, and signal-averaged to obtain the onset
(positive edge) and offset (negative edge) responses,
respectively. It is found that both edge responses are delayed by 50 ms and wane completely within
350 ms. These edge responses are then used to generate
(predict) the EEG responses to arbitrary binary
stimulus sequences using the superposition principle. It is found that the generated and the measured
EEG responses to certain
(16) simple short sequences (16.67–350 ms) are highly correlated. These
‘optimal short patterns’ are then randomly combined to design the long (120 bit, 2 sec) ‘Superposition
Optimized Pulse
(SOP)’ sequences, and their EEG response templates are obtained by superposition
of the edge responses. A SOP sequence-based Visual Speller BCI application yielded higher accuracy
(95.9%) and Information Transfer Rate (ITR) (57.2 bpm), compared to when superposition principle
is applied to conventional m-sequences and randomly generated sequences. Training for the BCI
application involves only the acquisition of the edge responses and takes less than 4 min. This is the
first study in which the EEG templates for cVEP BCI sequences are obtained by the superposition of
edge responses.
1. Introduction
Brain Computer Interfaces (BCIs) based on visual evoked potentials(VEPs), which were first proposed in 1984 as a new communication channel[1,2], are the
most common type of EEG based BCIs. In 1992, code modulated VEP (cVEP) was introduced and 64-bit long binary stimulus patterns(known as m-sequences) are employed for the task of target classification [3]. A
base m-sequence is assigned to one target(base target), and the sequences for the remaining targets are circularly shifted versions of the base sequence. A signal-averaged EEG response‘template’ is recorded for the base target, and the templates for the rest of the
targets are generated by circular shifting of the recorded EEG template. In BCI application EEG is recorded while the subject gazes at a certain target. The recorded EEG is correlated with the templates of all targets, and the target that yields maximum correla-tion is accepted. In m-sequence based cVEP, only a limited number of shifts is possible based on the length of the stimulus pattern. For instance, a 63-bit long m-sequence is widely used for cVEP based BCI spellers (Visual Keyboard). In these spellers, the m-sequence is circularly shifted by 2-bits for each target and there-fore, they can support a maximum of 32 targets. To increase the number of targets, it is necessary to either increase the length of the sequence or decrease the RECEIVED
18 February 2020
REVISED
24 May 2020
ACCEPTED FOR PUBLICATION
2 June 2020
PUBLISHED
11 June 2020
circumvent this problem, one may consider different codes for each target which are not shifted versions of each other. This choice however increases the training time. Therefore, it is necessary to be able to obtain templates for different targets from a small set of train-ing data. One notable study in these lines is the work done by Nagel et al[1], who have investigated the use
of arbitrary code sequences for cVEP BCI. A moving average(MA) model is proposed in their study to pre-dict brain responses to arbitrary stimuli patterns. Some training data are used to estimate the coefficients of the MA model and using this model all target tem-plates are predicted. The accuracy and Information Transfer Rate(ITR) values of the BCI system which uses these templates are reported to be high.
The work of Nagel et al is based to a large extent on the linearity of the system. However, it is known from modeling studies [6] that the visual system is
non-linear. The 13-parameter Robinsonʼs model has 4 sig-moid shaped nonlinear blocks in addition to gain and linear filter blocks [6]. Therefore the use of linear
models has to be handled with caution. The fact that the linear approach employed by Nagel et al has never-theless some significant success calls for investigating the nature of the visual system with respect to the lin-ear vs nonlinlin-ear perspective. In particular, it is impor-tant to investigate under what circumstances the system obeys the superposition and shift-invariance properties. If such properties are indeed satisfied, at least to some degree, then one may predict templates for many stimuli patterns using superposition of responses to simple inputs, which has the advantage of shorter training time.
BCI research is mostly application-specific, where the aim is to come up with a faster and more reliable means of communication interface. The majority of the BCI systems are designed without considering the actual nature of the brain responses. Even some of the new studies which have focused on modeling the brain responses use random stimuli patterns along with some generic models to approximate EEG responses to them[1,7]. Therefore, the concept of designing a
BCI system based on the nature and properties of the brain responses to visual stimuli is still untouched.
structure of the short stimuli sequences are met. Finally using these simple short sequences, long BCI stimulus sequences are designed and their super-position-generated and measured responses are com-pared. Later in this paper, a BCI system, utilizing the superposition property, is proposed, implemented, and tested. The training phase of the proposed BCI system is not long and it only comprises obtaining the edge responses correctly using averaging.
2. Materials and methods
2.1. Participants
Seven participants(7 male, mean age of 29.7 years, and standard deviation of 5.5 years) participated in the experiment after providing a written consent form approved by the ethical committee of Bilkent Uni-versity. They had normal or corrected-to-normal vision, had no previous history of epilepsy, and they were informed about the objective of this study.
2.2. Visual speller design methods
The visual speller screen is designed in Matlab environ-ment using Psychtoolbox [8] and is presented on a
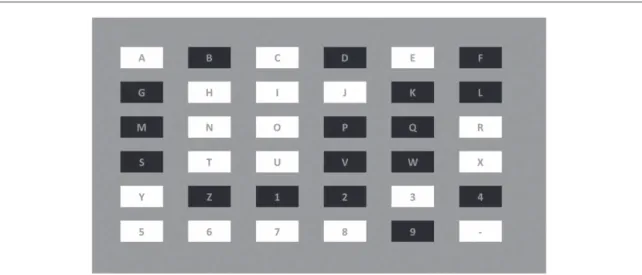
25-inch LED Monitor(Dell Alienware AW2518HF) at 60 Hz refresh rate with a resolution of 1920×1080 pixels. Subjects were seated in front of the monitor screen at a distance of about 80 cm. The visual speller consists of 36 targets, arranged as a 6×6 matrix on the screen (figure1). Each target has a rectangular shape of 180×90
pixels (5.18 cm× 2.6 cm) with the respective letter/ number written at its center. The targets include letters from A to Z, numbers from 1 to 9 and the‘-’ symbol. In a Visual Speller BCI application the targets are assigned the stimulus sequences explained in the‘Visual Speller BCI training and Testing’ section. The targets are toggled to black or white when the corresponding stimulus code is 0 or 1, respectively. Each bit of the stimulus sequence is presented for 16.667ms(display time of a single frame).
Ubuntu 18.04 with low latency kernel was used in the‘stimulus computer’ for having accurate stimulus timings. Close attention was given to the Psychtoolboxʼs
missed-frames counter to make sure that no frames were dropped during an experiment. A PIN photodiode circuit, explained in detail in our previous study[9], was
used for measurement of the actual refresh rate of the monitor, and it was found to be 59.94Hz. For the pur-pose of synchronization, a marker pulse is transmitted from the stimulus computer to the EEG amplifier after the update of each monitor frame to keep track of the flashing time for each bit. We also measured the exact delay between the frame update and the marker pulse. A negligible delay of 280μ s was found [10].
2.3. Data acquisition
Brain Products, V-Amp-16 EEG amplifier is used for recording EEG, with the standard 10–20 EEG cap which has 32 electrode locations (Brain Products, Gilching, Germany). V-Amp-16 contains a total of 16 EEG amplifier channels, however, in our experiments EEG is recorded from 8 channels of the amplifier with electrodes placed at positions‘O1, Oz, O2, Pz, P3, P4, P7 and P8’. The reference electrode is placed on FCz position, and the ground electrode is located on the forehead above nasion. Active/wet electrodes are used and the electrode impedances are measured using ImpBox(Brain Products, Gilching, Germany) and are kept below 10kΩ. The sampling rate of the EEG amplifier is set to 2000 sps per channel. BCI2000 [11]
with FieldTrip [12] are used for recording EEG
responses along with the synchronization markers, to
another computer (the ‘recording computer’) using MATLAB session in real time.
2.4. Data preprocessing
A 4–40 Hz bandpass filter is applied to all of the EEG signals along with a 50 Hz notchfilter to remove any of the remaining 50 Hz interference. EEG responses of the stimuli sequences are averaged over the trials with the help of the synchronization markers. Furthermore, the signals are then spatially averaged using the coefficients determined by canonical correlation ana-lysis(CCA) [13]. CCA helps to increase the signal to
noise ratio and reduces the 8-channel data into a single signal.
2.5. Stimulus sequences
The experiments are divided into three types. In the first type, EEG responses to wide stimulus pulses are acquired. This is also the training stage of our BCI experiment, when edge responses are obtained. In the second type of experiments, EEG responses to 9 different stimulus sequences with simple (short) patterns are obtained and studied. In thefinal experi-ment type, various long BCI sequences are studied, and a BCI speller is realized and tested. The stimulus pattern for thefirst experiment type is given in figure2. Each time this stimulus pattern is repeated, the lengths of the high and low regions are randomly chosen between 500 ms and 750 ms to remove any artifacts Figure 1. Thirty Six target Visual Speller Screen for the BCI experiments. The 36 targets include letters from A to Z, numbers from 1 to 9 and the‘-’ symbol. The background of each target is flashed black or white when the corresponding bit of the stimulus sequence is ‘0’ or‘1’.
Figure 2. Wide pulse stimulus with randomized duration(500–750 ms) for the high (white) and low (black) regions. This stimulus sequence is used for obtaining the onset(positive edge) and offset (negative edge) EEG responses.
that may arise due to the otherwise periodic nature of the EEG. The stimulus pattern infigure2is assigned to target A (i.e. letter A) and repeated 160 times for averaging. The other 35 targets are assigned randomly generated sequences and the subject is asked to gaze at target A.
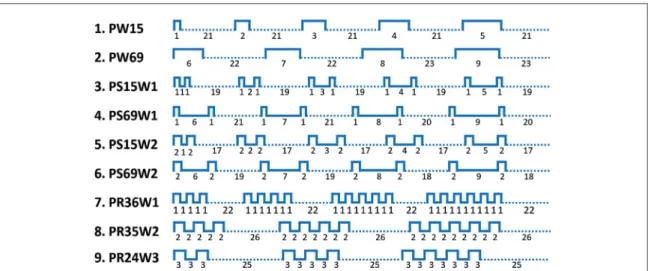
For the second type of experiments, the stimulus sequences shown infigure3are used to carry out the following studies; Pulse Width (PW) study, Pulse Separation (PS) study, and Pulse Repetition (PR) study. In the PW study, stimulus sequences PW15 and PW69 are used, which cover pulse widths of 1–5 and 6–9 bits, respectively. In figure3, the widths of each part of the stimulus sequences are written below in units of bits, and they add up to 120 bits(2 s). The PS study is divided into 2 parts. In the first part, the separation between two 1-bit pulses is changed between 1 to 5 bits(sequence PS15W1) and between 6 to 9 bits(sequence PS69W1). In the second part, the separation between two 2-bit pulses is changed between 1 to 5 bits(sequence PS15W2) and between 6 to 9 bits(sequence PS69W2). Finally, in the PR study, different repetitions of 1-bit, 2-bit, and 3-bit wide pul-ses are studied. In this study, the distance between the pulses is equal to the width of the pulses(pulses are periodically repeated with 50% duty cycle). The stimu-lus sequences PR36W1, PR35W2 and PR24W3 cover 3–6 repetitions of 1-bit wide pulses, 3–5 repetitions of 2-bit wide pulses, and 2–4 repetitions of 3-bit wide pulses, respectively. It should be noted that PR36W1 and PR35W2 sequences do not include the case of 2 repetitions of 1-bit and 2-bit pulses because they are already covered in the PS study.
The solid lines infigure3are the patterns under consideration, whereas the dotted lines are the separa-tions between these patterns. Separasepara-tions of 17–26 bits (283 ms–433 ms) are introduced, so that the EEG responses to the individual patterns do not overlap. For each of the 9 stimulus sequences, EEG is recorded
for 30 trials for signal averaging. These 9 stimuli sequences are assigned to target A(letter A), and the subject is asked to gaze at target A while the remaining 35 targets are assigned randomly generated sequences.
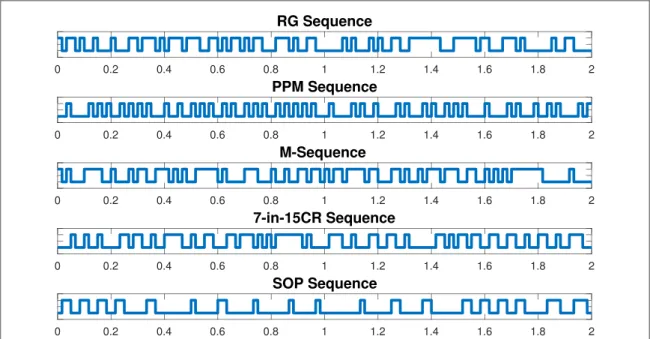
In the last type of experiments, we studied 5 differ-ent 120-bit long(2 s) sequences which are potentially to be used in BCI experiments (figure 4). These
sequences are Randomly Generated(RG) Sequence, Pulse Position Modulated (PPM) Sequence, m-sequence, 7-in-15 Change Random (7-in-15CR) Sequence, and Superposition Optimized Pulse(SOP) Sequence. RG Sequence is obtained by assigning 1 or 0 to every next bit position with 50% probability. The PPM sequence contains 1-bit pulses which are sepa-rated randomly by a distance of 1 to 4 bits. The 120-bit m-sequence is actually a truncated version of a 127-bit m-sequence, discussed in our previous paper[5]. The
7-in-15CR sequence contains 7 changes for every 15 bits of the sequence. This code was proposed by Nagel et al[1] and was reported to have a better performance
than randomly generated codes. Finally, the SOP sequence is proposed by us in the result section. To generate such a code wefirst selected 16 different short sequence patterns. They include 1-bit pulse followed by 5–10 zero bits, 2-bit pulse followed by 5–10 zero bits, 3 and 4 repetitions of 2-bit pulses followed by 5 zero bits andfinally, 3 and 4 repetitions of 3-bit pulses followed by 5 zero bits. Hence, there are 16 different patterns to choose from, and an SOP sequence is gen-erated by randomly picking up these patterns, con-catenating them, and truncating thefinal pattern to 120 bits.
To observe and study the EEG responses to each of the aforementioned 120-bit long potential BCI sequences, they are repeated 60 times for the purpose of signal averaging. However when used for the BCI application explained below they are repeated only twice.
Figure 3. Nine different stimulus sequences of 120-bit length(2 s) comprising simple short stimulus patterns designed to investigate the nature of EEG responses to simple visual stimulus patterns. The solid lines are the patterns under consideration, whereas the dotted lines are the separations between these patterns.
2.6. Visual speller BCI training and testing
The training phase of our BCI speller only involves extracting the onset(positive edge) and offset (negative edge) responses from the EEG response to the wide stimulus pattern shown infigure 2(This is the first
experiment type discussed in section2.5). For the test
phase each target is assigned a different stimulus sequence of one of the 120-bit PPM, 7-in-15CR, or SOP sequence types defined in section2.5. The edge responses are then used to generate (predict) the template EEG responses for all targets using the superposition based procedure, as explained in the results section3.3. During the test phase, an individual subject is asked to spell 35 targets in the order‘A-Z, 1–9’. To spell a target of intent, the subject focuses his/ her gaze on that particular target for 2 consecutive trials (2 consecutive repetitions of the 120-bit sequence, which takes 4 s) which is then followed by a 1-sec gaze shifting period. The 2-trial averaged EEG is then correlated with the generated (predicted) EEG templates of all targets, and the target which has the maximum correlation is selected.
BCI accuracy is defined as the percentage of the number of targets correctly classified. ITR is another standard performance metric and is defined as in equation(1), where, P is the classifier accuracy, N is the
total number of targets(in our Visual Speller BCI experi-ments N=36) and T is the time required to classify a single target. Two trials of the 120-bit stimulus(4 s) plus the gaze shifting time(1 second) make T equal to 5 s.
⎜ ⎟ ⎛ ⎝ ⎞ ⎠ ( ) ( ) = ´ + + - -ITR T log N Plog P P log P N 60 1 1 1 1 2 2 2
3. Results
3.1. EEG responses to wide pulses(acquisition of the edge responses)
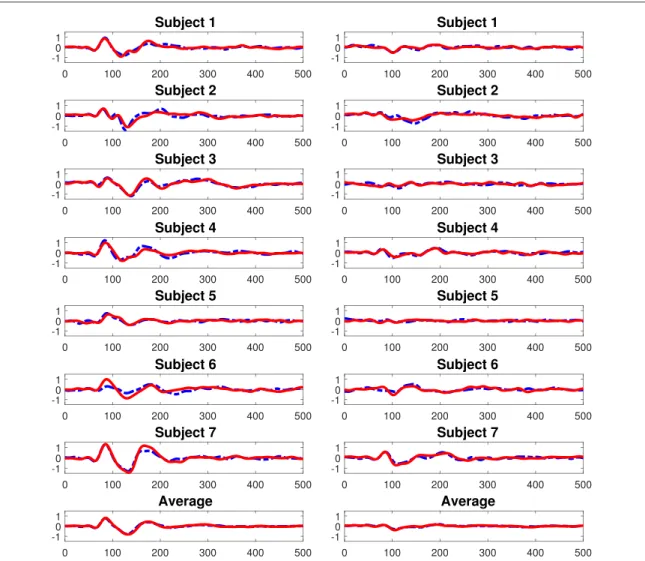
Figure5shows that the 160-repetition averaged EEG responses of each of the 7 subjects start 50 ms after either the positive edge(onset) or the negative edge (offset) of the stimulus and wane within 350 ms. It can be observed that each subject has his own distinct onset and offset responses, but they do not deviate significantly from the averaged responses of all 7 subjects. Figure 5 also shows the edge responses acquired 2 weeks later, indicating that onset and offset responses are repeatable. The onset responses acquired from the two acquisitions have correlations of 0.90, 0.82, 0.93, 0.86, 0.81, 0.61, and 0.96 for subjects 1–7, respectively. For the offset responses, the corresp-onding correlations are 0.79, 0.80, 0.44, 0.82, 0.04, 0.67 and 0.87. The relatively lower correlation values for the offset responses are due to lower signal to noise ratio because of the low amplitudes of the offset responses. The average RMS value of the onset responses for acquisitions 1 and 2 are 0.303 and 0.289, respectively, whereas the corresponding average RMS values of offset responses are 0.149 and 0.160.
3.2. Using superposition for predicting cVEP responses
If the system is linear and if the system responds to the edges only, then it should be possible to predict the EEG response to a general stimulus pattern by super-position, that is, by shifting the onset and offset response to the positions of the corresponding edges of the stimulus sequence and adding them. In the following, we investigate to what extent the Figure 4. 120-bit stimulus sequences for BCI use: randomly Generated(RG) sequence, Pulse Position Modulated (PPM) sequence, M-sequence, 7-in-15 Change Random(7-in-15CR) sequence, and Superposition Optimized (SOP) sequence.
superposition principle is valid. Correlations between the predicted and the actual responses are then used to evaluate the performance of the superposition-based procedurefirst for the different simple pulse patterns provided in figure 4, and then also for long BCI sequences.
3.2.1. Prediction performance for different short pulse widths:
In this PW study, the EEG responses for different pulse widths(1 to 9 bits) are acquired using the stimulus patterns PW15 and PW69. The observed and gener-ated(predicted) EEG responses are given in figure6
for Subject 1, and it is observed that the correlation between the generated and the measured response ranges from 0.63(for 1-bit pulse width) to 0.18 (for 8-bit pulse width). The average correlations, over all 7 subjects, between the generated and the observed EEGs for different stimulus pulse widths are illustrated infigure10(a). For PWs of 1 and 2 bits the correlations
are around 0.7 and are lower for the other PWs. A repeated measures ANOVA test shows that there is significant difference among the correlations obtained for different PWs(p < 0.001). When a paired t-test
was applied to pairwise compare different PWs (p < 0.05), we observed that the correlations for 1-bit and 2-bit wide pulses are similar, but they are significantly different from most of the other PWs. Therefore, we arrive at the understanding that using 1-bit and 2-bit wide pulses in a stimulus sequence will give better accuracy between the predicted and the acquired EEG responses.(The individual correlations of all 7 subjects and the detailed results of the statistical test are provided in the Supplementary Information available online at stacks.iop.org/BPEX/6/045018/
mmedia. The same holds for the other prediction
performance studies reported in the following). 3.2.2. Prediction performance for different pulse separations:
In this PS study, the effect of time separation between adjacent pulses is studied. The pulses of interest are either 1-bit wide or 2-bit wide pulses. First, the separation distance between two adjacent 1-bit pulses is changed from 1 to 9 bits. PS15W1 and PS69W1 are the Stimulus sequences(shown in figure3) used for
this experiment and the resulting observed signals for subject 1 are given in figure 7. It is found that the Figure 5. Onset and Offset responses are on the Left and Right, respectively. Dotted-blue lines are the edge responses obtained 2 week after thefirst set of responses shown in red. Each of these responses are the 160-averaged EEG responses truncated to 500 ms after the corresponding edges.
correlation between the measured and the predicted (generated) EEG response ranges from a minimum of 0.36(for 1-bit separation) to a maximum of 0.72 (for 6-bit separation). The average correlations, over all 7 subjects, between the generated and the observed EEGs for different separations of 1-bit wide pulses are illustrated infigure10(b). On the average, correlation
is around 0.4 for separations of 1–3 bits and for higher separations the correlations are around 0.6. Therefore, in general for 1-bit wide pulses if the separation between neighboring pulses is 4 bits or more, then the EEG can be predicted with high accuracy, which is logical because then the overlap between the responses of the individual pulses becomes less. A repeated measures ANOVA test shows that there is a significant difference among the correlations obtained for
different pulse separations(p = 0.013). Furthermore, pairwise comparisons using paired t-test show that the correlations for 4–9 bit separations are statistically not different, whereas correlations for 1–3 bit separations are significantly different from column 6. Therefore, in general, the choice of 4 to 9 bit separations between 1-bit wide pulses seems reasonable.
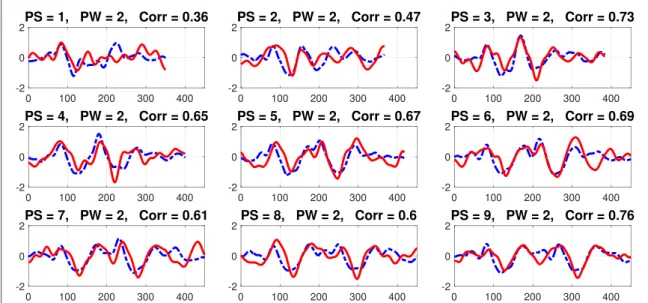
Similarly for 2-bit wide pulses, using the PS15W2 and PS69W2 stimulus sequences(shown in figure3),
the same pattern is observed. The generated and observed EEG plots for different pulse separations for Subject 1 are provided infigure8. The average correla-tions, over all 7 subjects, between the generated and the observed EEGs for different separations of 2-bit wide pulses are illustrated infigure10(c). The average
correlation increases from 0.32 to 0.65 as separation is Figure 6. Subject 1, Acquired(Red-Solid) and Generated (Dotted-Blue) EEG responses for 1–9 bit wide pulses. The values of the pulse widths(PW) and correlations (Corr) are shown above each plot.
Figure 7. Subject 1, Acquired(Red-Solid) and Generated (Dotted-Blue) EEG responses for stimulus patterns of 1–9 bit separation between 1-bit wide pulses. The values of the pulse widths(PW), pulse separations (PS), and correlations (Corr) are shown above each plot.
increased from 1 to 3 bits. From 3-bit up to 9-bit separations small variation in the correlations are observed. Hence, it can be inferred that if the separa-tion between the 2-bit wide pulses is greater than or equal to 3 bits, the responses of the individual pulses will have less overlap and the generated sequence response will have a high correlation with the observed EEG response. A repeated measures ANOVA test shows that the null hypothesis of having equal means for different separations is to be rejected(p = 0.001). Furthermore, pairwise comparisons using paired t-test show that the mean correlations for 3–9 bit separations are similar to each other and the mean correlations for 1-bit and 2-bit separations are sig-nificantly different from 3, 4 and 9 bit separations. Therefore in general a choice of 3-bit to 9-bit separa-tion between 2-bit pulses seems reasonable.
3.2.3. Prediction performance for different pulse repetitions:
In this PR study, the generated and measured EEG are compared for different number of repetitions of 1-bit, 2-bit, and 3-bit wide pulses. The stimulus sequences used for this study are PR36W1, PR35W2 and PR24W3 for 1, 2 and 3-bit pulses, respectively, as shown infigure3. The results of this study for subject 1 are shown infigure9. For 1-bit pulse, the correlation for 3 repetitions is 0.34, which then drops to 0.15 as the number of repetitions is increased to 6. This is because of the destructive interaction of the individual edge responses, which can also be observed infigure9by the low amplitude of the acquired EEG. Therefore, it appears that repetitions of 1-bit pulses are not to be preferred. For 2 repetitions of 2-bit pulses the correla-tion is less than 0.5(as seen From figure8). However
for 3, 4 and 5 repetitions, the correlations are between 0.67 and 0.77. For 3-bit wide pulses, the correlation for
2, 3 and 4 repetitions is between 0.56 and 0.66. Therefore, 3–5 and 2–4 repetitions of 2-bit and 3-bit wide pulses give better accuracy results, respectively.
The average correlations over all 7 subjects and their confidence intervals for different repetitions of 1-bit, 2-bit and 3-bit wide pulses are illustrated in figures 10(d), (e) and (f), respectively. Overall,
the results for all subjects are in parallel to the results we have explained for subject 1. Repeated measures ANOVA indicates that significant differ-ence exists between different repetitions of 1-bit pul-ses(p=0.03) but pairwise paired t-tests do not show any significant difference between different repeti-tions(at 5% significance level) and also the average correlation values for all repetitions are very low(less than 0.411). Therefore, repetition of 1-bit pulses is not preferred. On the other hand, the correlation for 2-bit wide pulses shows much higher values and this phenomenon is observed in almost all of the subjects. A repeated measures ANOVA test indicates that cor-relations for different repetitions are significantly dif-ferent (p < 0.01). Pairwise paired t-test results indicate that although for all repetition cases the average correlations are higher than 0.507, the corre-lation for 4 and 5 repetitions are significantly higher than for 2 and 3 repetition cases. Hence for 2-bit wide pulses, 4 and 5 repetitions are to be preferred. For the repetition of 3-bit pulses, it is found from repeated measures ANOVA that all repetition cases are statisti-cally the same(p = 0.16) and the average correlations are higher than 0.58. Pairwise comparisons also do not show any significant difference between the cor-relations of different repetition cases of 3-bit pulses. Hence, 3-bit wide pulses will give good correlation between the predicted and the measured EEGs, for 2–4 repetitions.
Figure 8. Subject 1, Acquired(Red-Solid) and Generated (Dotted-Blue) EEG responses for stimulus patterns of 1–9 bit separation between 2-bit wide pulses. The values of the pulse widths(PW), pulse separations (PS), and correlations (Corr) are shown above each plot.
3.2.4. Prediction performance for long stimulus sequences:
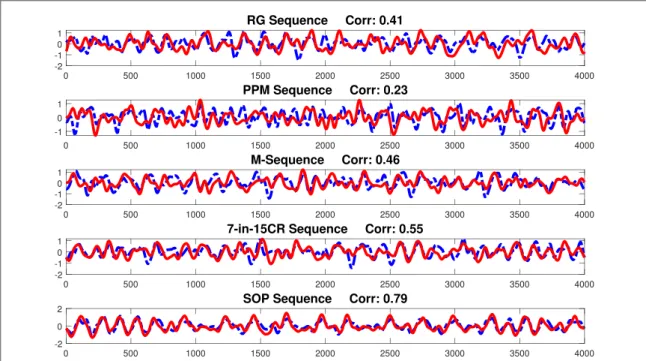
In this study we tested, for subject 1, the 5 different stimulus sequences which are provided infigure4of section2.5. All of these sequences are 120 bits long, they are repeated for 60 trials to get a good averaged
signal, and the results are shown in figure 11. The correlations between the generated and actual EEG responses for the RG sequence, PPM sequence, m-sequence, 7-in-15CR sequence, and the SOP sequence are 0.41, 0.23, 0.46, 0.55, and 0.79, respec-tively. The EEG response to the PPM sequence is Figure 9. Subject 1, Acquired(Red-Solid) and Generated (Dotted-Blue) EEG for pulse repetitions of 1, 2 and 3 bit wide pulses. The values of the pulse repetitions(PS), and correlations (Corr) are shown above each plot.
Figure 10. Average Correlation values with 95% confidence interval. (a) For 1–9 Pulse Widths, (b) For 1–9 Separations between 1-bit wide pulses,(c) For 1–9 Separations between 2-bit wide pulses, (d) For 2–6 Repetitions of 1-bit wide pulse, (e) For 2–5 Repetitions of 2-bit wide pulse,(f) For 2–5 Repetitions of 3-bit wide pulse,
difficult to predict because the separations between 1-bit pulses are very small. The correlation values for the m-sequence and the RG sequence are also low, probably because of the same reason. The 7-in-15CR sequence performed better than the RG, PPM and m-sequences. Finally, our proposed SOP sequence performed the best, and a high correlation was recorded between the generated and observed EEGs.
In the following, a BCI application is proposed, which uses target code sequences which are designed by taking the above results into consideration. In fact, the‘atomic pulse waveforms’ which are used to design the proposed SOP stimulus sequences, which are explained in section 2.5 (Stimulus Sequences) are
decided upon as a result of the aforementioned observations.
3.3. Results of the visual speller BCI experiments The details of the Visual Speller BCI experiments are explained in the Methods subsection ‘2.6 Visual Speller BCI Training and Testing’. Acquiring BCI results for all of the 5 sequence types shown infigure4
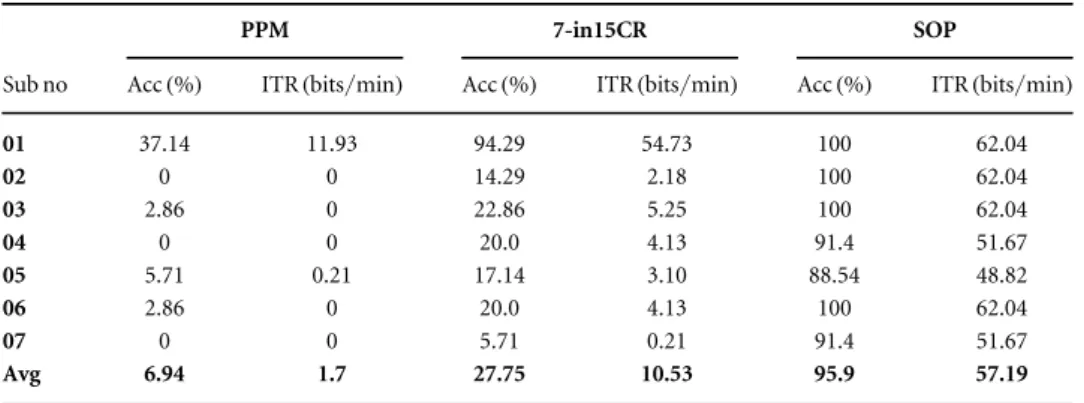
would be very demanding for the subjects, and there-fore we decided to compare the least performing PPM sequence, the moderately performing 7-in-15CR sequence, and the best performing SOP sequence. Table1provides the accuracy and ITR values of the BCI application using the three stimulus types for each subject. For all of the subjects, the PPM sequences performed the worst with an overall accuracy and ITR of 6.94% and 1.7 bits/min, respectively. The perfor-mance of the 7-in-15CR sequences is comparatively better than the PPM sequence with an average accuracy and ITR of 27.75% and 10.53 bits/min, respectively. Finally, as expected, the SOP sequences
performed the best with an accuracy of 95.9% and ITR of 57.19 bits/min, respectively. It is worth repeating that the PPM sequences performed the worst because in these sequence only 1-bit wide pulses are used and the separation between the pulses is randomly chosen between 1 and 4 bits. As we have shown in section ‘Prediction Performance for different Pulse Separa-tions’, the pulse separation should be greater than 3 bits for better prediction accuracy. Also in the 7-in-15CR sequences there are many instances when pulse separations are short, and this may explain why these sequences also do not perform well. In general we may conclude, although from the comparison results of just 3 sequence types, that sequences which do not obey the rules that we have identified in the previous sections, perform poorly. As of now, therefore, we propose the use of the SOP sequences for a Visual Speller BCI application.
4. Discussion
The human brain is a highly nonlinear and complex system, and yet, most of the cVEP based applications are designed without considering the characteristics of the brain responses. In m-sequence based cVEP BCI applications, the assumption of shift-invariance seems to hold. Similarly, the BCI application based on an MA model[1] also performed quite well. Therefore, it can
be inferred from these studies that even simple modeling or just making some assumptions on the characteristics of the system may be useful in designing BCI applications. In our study, we have gone one step further to understand the system better and have investigated how well the brain complies with the superposition property. This is the first study to Figure 11. Generated(Red-Solid) and Observed (60-averaged, Dotted-Blue) EEG responses for the (a) RG Sequence, (b) PPM
investigate the nature of brain responses to different visual stimulus patterns to verify that the brain responses follow superposition under certain con-straints on the stimulus patterns. The observations are then used for designing optimum sequences for BCI.
The constraints which we are suggesting for BCI stimulus sequences decrease the number of possible targets. However, it is still a huge set, and a large num-ber of targets can be introduced. Furthermore, we have performed experiments on only a few simple sti-mulus patterns, and the patterns that performed well among them are used in designing the long stimulus sequences for our BCI application. Further studies can be carried out in order to identify additional pre-dictable simple patterns, and they can be added to the set of acceptable simple patterns to increase the num-ber of targets.
The positive and negative edges of the stimulus sequence are the main factors influencing the EEG response. These positive and negative responses have an initial delay of 50 ms and diminish 350 ms after the edge. These responses appear to be similar to the step response of a low order, such as 2nd or 3rd order, lin-ear system, albeit with an absolute delay. Hence, fur-ther studies can be carried out to obtain a model of the system by estimating the parameters of such a system from the edge responses.
The edge responses of the seven subjects in our study have a common pattern, it is worth investigating if a universal edge response can be used for predicting responses to BCI target sequences. Using a universal edge response would have the advantage of eliminat-ing the traineliminat-ing stage for acquireliminat-ing the edge responses of an individual subject. However, at this stage, until further studies are undertaken, we suggest that a train-ing session should be carried out for each individual to acquire his/her edge responses.
We have implemented a synchronized BCI appli-cation where theflashing start and stop timings are predetermined. During testing, after the targets are fla-shed for 2 consecutive trials, which takes 4 s, a 1-second pause is allowed for the subject tofind and focus his/her gaze on the next target. Therefore, there is the risk that the subject may fall behind infinding the next intended target. This is a common problem
with all of the synchronous BCI applications. In this and many other research studies(e.g. in [1],) the
tar-gets are visited in a predetermined straightforward order(A-H,1–9), but a more realistic assessment of the speller performance would be achieved by a ‘free-spel-ler mode’ where the subject is asked to spell given words. In such a mode, one may allow more time for gaze shifting in order not to compromise accuracy, but this would impact the ITR of the speller. In future work we shall focus on implementing a more robust cVEP BCI implementation where the subject will be asked to spell freely.
The results that we have obtained not only serve for better design of BCI experiments but also shine light on the workings of the visual system regarding its linearity and shift-invariance properties. We hope that our results will give insight to researchers who deal with the fundamental aspects of the visual system in addition to investigators who undertake application-oriented research such as BCIs.
5. Conclusion
In this study, responses of the visual system to several code patterns are first studied in order to come up with rules (constraints) for constructing beneficial sequences for BCI applications. It isfirst found that the onset and offset responses of the brain to visual stimulus pulses are delayed by about 50 ms and wane within 350 ms. These edge responses are then used to predict EEG responses to any stimulus sequences by using superposition. It is found that 1-bit and 2-bit wide pulses with 4–9 bit and 3–9 bit separations respectively, and 2-bit and 3-bit pulses with 3–4 and 2–4 repetitions respectively, can be predicted with good accuracy. These simple patterns were randomly combined in 120-bit stimulus sequences to be used in a BCI speller application. It is confirmed that with such target stimulus sequences, the BCI application will give better classification results with 95.9% accuracy. Furthermore, the BCI application proposed in our study has short training time because the training is carried out only to acquire the edge responses, and the proposed methodology allows for a large number of Table 1. BCI application results.
PPM 7-in15CR SOP
Sub no Acc(%) ITR(bits/min) Acc(%) ITR(bits/min) Acc(%) ITR(bits/min)
01 37.14 11.93 94.29 54.73 100 62.04 02 0 0 14.29 2.18 100 62.04 03 2.86 0 22.86 5.25 100 62.04 04 0 0 20.0 4.13 91.4 51.67 05 5.71 0.21 17.14 3.10 88.54 48.82 06 2.86 0 20.0 4.13 100 62.04 07 0 0 5.71 0.21 91.4 51.67 Avg 6.94 1.7 27.75 10.53 95.9 57.19
References
[1] Nagel S and Spüler M 2018 Modelling the brain response to arbitrary visual stimulation patterns for aflexible high-speed brain-computer interface PLoS One13 e0206107
[2] Sutter E E 1984 The visual evoked response as a communication channel Proc. of the IEEE Symposium on Biosensors 95–100
[3] Sutter E E 1992 The brain response interface: communication through visually-induced electrical brain responses J. Microcomput. Appl.15 31–45
[4] Wei Q, Liu Y, Gao X, Wang Y, Yang C, Lu Z and Gong H 2018 A novel c-vep bci paradigm for increasing the number of
Biomed. Phys. Eng. Express4 025024
[10] Memon S A 2019 Hybrid and model based approaches for new BCI spellers MSc Thesis Bilkent University
[11] Schalk G, McFarland D J, Hinterberger T, Birbaumer N and Wolpaw J R 2004 Bci2000: a general-purpose brain-computer interface(bci) system IEEE Trans. Biomed. Eng.51 1034–43
[12] Oostenveld R, Fries P, Maris E and Schoffelen J-M 2011 Fieldtrip: open source software for advanced analysis of meg, eeg, and invasive electrophysiological data Computational Intelligence and Neuroscience2011 1
[13] Spüler M, Walter A, Rosenstiel W and Bogdan M 2013 Spatial filtering based on canonical correlation analysis for classification of evoked or event-related potentials in eeg data IEEE Trans. Neural Syst. Rehabil. Eng.22 1097–103
