138
THE INTERNATIONAL COMPETITIVENESS OF
TURKISH LEATHER EXPORTS
11. INTRODUCTION
The increase in international economic interdependence, characterized by the growth in the volume of world trade over the years, has been matched by the increased internationalization of environmental problems. Although there are systems in place to manage international economic relations, there is a lack of international governance for many environmental issues. Furthermore, national environmental policies may conflict with existing international regulations and agreements on international trade, investment and economic integration. National and international regulations and policies thus need to be amended in such way that environmental and economic objectives are not only made compatible, but also mutually supportive.
In the trade and environment debate, it is important to realize that the implementation of environmental policy may increase the cost of production of economic goods in the short run, while it may reduce costs in the long run thanks to efficiency gains. Compliance with environmental regulations, however, often does impose immediate operational and investment costs. The internalization of environmental costs may thus cause price effects that alter international trade competitiveness. It can therefore be easily understood that differences in the stringency of national environmental regulations are one reason why differences in competitiveness and cost advantages exist in the international arena.
The harmonization of environmental standards is frequently proposed as a solution by developed countries that experience cost disadvantages cause by their adoption of more stringent environmental standards.2 However, the effect of adopting new stricter environmental standards could have a major impact on the economies of countries that are accustomed to operating under lax environmental frameworks or at least a lack of enforcement of domestic environmental regulations. This is particularly important since these regulations usually manifest themselves in cost increases, which have adverse effects on total production costs and export revenues.
This issue is of particularly concern to Turkey in view of its Customs Union agreement with the European Union. This agreement states that the parties should seek to cooperate in the fields of standardization, metrology and calibration, quality, accreditation, testing and certification. It also calls on Turkey to remove all technical barriers to trade in accordance with EU procedures (Article 8). However, while Turkish water effluent standards adopted in 1988 are based on German effluent standards, existing data suggests that the level of compliance with effluent regulations in the leather sector is low due to inoperative infrastructure and lax enforcement. The objective of this case study on the Turkish leather industry is thus to estimate the impact of adopting international environmental standards, by coming into compliance with domestic effluent standards, on the production and export of Turkish leather products.
2. THE LEATHER SECTOR IN TURKEY
2.1 Background
1 The MedPolicies Initiative thanks Jale Aktas, the METAP National Focal Point for Turkey, for her support for the case study and Katalin Zaim, Fatma Taskin, Osman Zaim who served as the case study Lead Analysts and authors.
139
The leather industry is one of Turkey’s more important economic sectors. It generates a high value added product as well as significant employment opportunities with its labor intensive production process. The leather industry accounts for approximately 1.8% of the Turkish manufacturing industry’s output. The sector employs 5% of workers covered under the umbrella of the national social security system.
Increasingly strict environmental standards have led to a decrease in the number of tanneries in most industrialized countries. This has increased their need for leather imports. For many developing countries, leather processing has thus become an important source of foreign exchange. Approximately 50% of leather production is now carried out in developing countries. The most important leather processing countries are Italy, Turkey, and Korea, followed by the former Soviet Union, India, Brazil, and Mexico. While low wages and lax environmental standards in most of these countries have contributed to their comparative advantage in leather production, less stringent environmental standards have also led to faster environmental degradation.
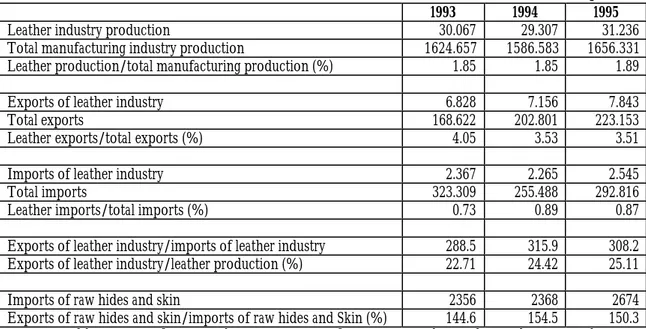
According to information provided by the General Directorate of International Trade, Turkey is the second largest leather processor in the world after Italy and is responsible for 22% of world leather processing (tanning and production). Turkey currently has 1,200 leather processing establishments and a leather processing capacity of 80 million units of raw hides and skin). However, since Turkey only produces 25 million units, the sector is dependent on imported raw hides and skins. Table 1 below shows the relative importance of leather production and trade in the Turkish economy.
Table 1: Information on the Turkish Leather Sector (Billion TL in 1993 constant prices)
1993 1994 1995
Leather industry production 30.067 29.307 31.236
Total manufacturing industry production 1624.657 1586.583 1656.331
Leather production/total manufacturing production (%) 1.85 1.85 1.89
Exports of leather industry 6.828 7.156 7.843
Total exports 168.622 202.801 223.153
Leather exports/total exports (%) 4.05 3.53 3.51
Imports of leather industry 2.367 2.265 2.545
Total imports 323.309 255.488 292.816
Leather imports/total imports (%) 0.73 0.89 0.87
Exports of leather industry/imports of leather industry 288.5 315.9 308.2
Exports of leather industry/leather production (%) 22.71 24.42 25.11
Imports of raw hides and skin 2356 2368 2674
Exports of raw hides and skin/imports of raw hides and Skin (%) 144.6 154.5 150.3
Source: Publications of General Directorate of International Trade and State Planning Organizations.
The European Union (EU) is the largest importer of Turkish leather purchasing 74.6% of Turkish exports. Within the EU, Germany is the largest purchaser, importing 44% of total Turkish leather exports.
A report by the Treasury Department indicates that 80% of Turkish leather producers are located in organized industrial zones. These centers are found in Istanbul, Izmir, Bursa, Bolu, Gaziantepe, and Usak. Smaller scale operations are located in the towns such as Canakkale, Sakarya, Manisa, Aydin, and Isparta. The major differences among the producers located in organized industrial
140
zones versus those operating outside of such zones are noted in Table 2. Generally, producers in industrial zones benefit from the availability of appropriate infrastructure, such as a centralized wastewater treatment facility and a sufficient water supply. The remaining 20% of unorganized production is carried out in an environment where there is likely no access to wastewater treatment facilities and no regulatory control enforced on their activities.
Table 2: Conditions in the organized industrial zones vs. small producers
Organized Industrial Zones Others
Waste Water Treatment Plant Yes No
Common Area with Infrastructure Yes No
Water Production Capacity Secured Yes Not sure
Employment Syndicate Yes No
Environmental Control Yes No
Source: Sanayi ve Ticaret Bakanligi, 1994; official communication to Directorate of the Leather Producers, Page no. 94/3608.
Enforcement of environmental regulations thus should be an important factor for the producers in industrial zones. However, in spite of the fact that producers in these centers are equipped with wastewater treatment plants, there is no statistical evidence that shows to what extent they comply with the environmental standards. For instance, the pollution discharge values reported by the State Statistic Institute notes the total discharge by the industry, but does not differentiate between the location and the size of the firms. Nevertheless, it is generally believed by producers located in these centers that they suffer from “environmental dumping” by producers based outside the zones who use outdated and highly polluting technologies. Producers outside the industrial zones would thus have cost advantages over producers within the centers.
2.2 Production process and environmental problems of the leather industry
The production processes used in Turkish leather production are the conventional ones. Raw hide and skin preservation is accomplished by applying salt. Such activity generates significant salt and organic pollution. Soaking is done in pits by using paddles, which is one of the most water demanding processes. Unhairing and liming take place before the tanning and dying operations. The residual floats from the unhairing and liming process contains high concentrations of total suspended solids (TSS), Chemical Oxygen Demand (COD), Biological Oxygen Demand-5 (BOD5), fat and greases, and nitrogen compounds (NH4-N). Tanning and dying operations rely on the application of different forms of chromium (Cr-total and Cr+6), lead, and cadmium salts. The percentage distribution of different compounds consumed in the Turkish leather production is given below in Table 3.
Table 3: Compounds consumed in the Turkish leather production
Compounds Percentage in terms of volume used in production (%)
Lime 10 Sodium Sulfate 5 Antibacterial mat. 0.5 Enzymes 2 Solvents 4 Sulfuric Acid 9
Chrome sulfate salts 14
Salt 15
Others 40.5
141
Hence, the most relevant types of pollution associated with leather production are: Total Suspended Solids (TSS), Biological Oxygen Demand-5 (BOD5), Chemical Oxygen Demand (COD), pH, Phosphorus (PO4-P), Cr-total, Cr+6, Nitrogen (NH4-N), Oil and Grease, and Phenol.
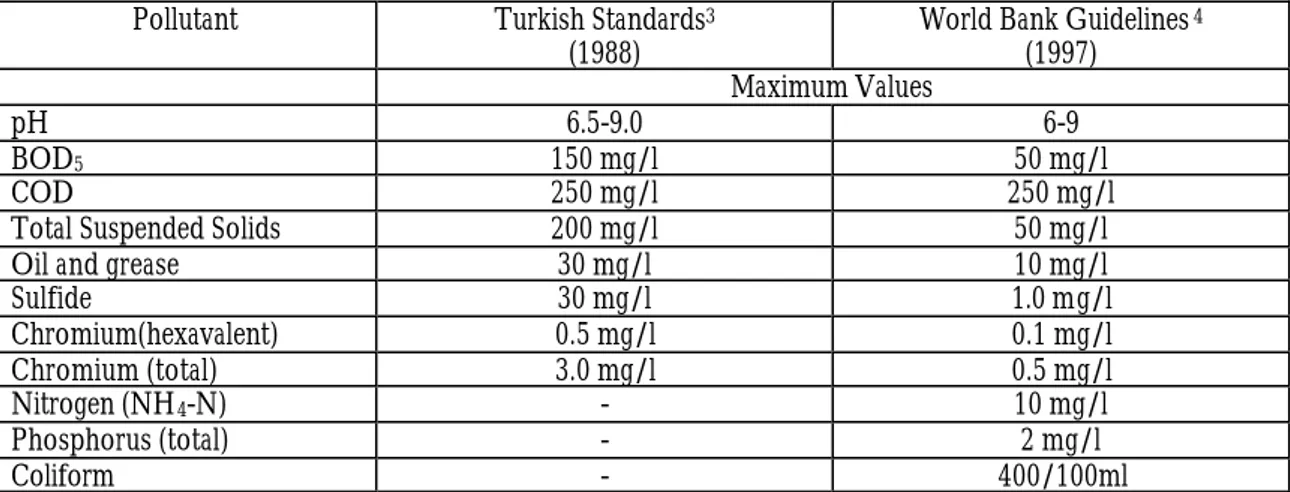
The Ministry of Environment of Turkey issued water effluent concentration standard values (mg/l) for the leather industry in 1988 using German standards as guidelines. The values are given in Table 4. Since 1988, no adjustment has been made to the guidelines. When compared to the values proposed in the 1997 World Bank report on leather industries, it can be seen that the World Bank recommended standards for effluents from tanning and leather finishing processes are much lower, and thus more stringent, than those adopted by Turkey for most pollutants (see Table 4).
Table 4: Standards for tanning and leather finishing processes
Pollutant Turkish Standards3
(1988)
World Bank Guidelines4
(1997) Maximum Values
pH 6.5-9.0 6-9
BOD5 150 mg/l 50 mg/l
COD 250 mg/l 250 mg/l
Total Suspended Solids 200 mg/l 50 mg/l
Oil and grease 30 mg/l 10 mg/l
Sulfide 30 mg/l 1.0 mg/l Chromium(hexavalent) 0.5 mg/l 0.1 mg/l Chromium (total) 3.0 mg/l 0.5 mg/l Nitrogen (NH4-N) - 10 mg/l Phosphorus (total) - 2 mg/l Coliform - 400/100ml
To overcome the pollution problems of this sector, the Ministry of Environment established the Environmental Leather Commission and the Technical Commission. These two organizations are responsible for the assessment and control of the production processes. The commissions prepared an environmental declaration for this sector with the following recommendations:
1. Reduce environmentally unfriendly inputs and outputs; 2. Minimize water and energy consumption;
3. Improve recycling;
4. Introduce more environmentally friendly technology in the production;
5. Sludge containing toxic pollutants has to be recycled or separately collected and properly disposed.
6. Toxic chemical discharged during production should be placed in specific containers and labeled according to hazardous waste regulations;
7. Solvents used in production should be either recycled or separated from wastewater and treated as toxic pollutants; and
8. Legal actions should be taken in case a producer discharges pollution above the legal standards.
Information on the level of activity and effectiveness of these agencies is not documented.
2.3 Pollution Data and Abatement Cost Estimation
3 Issued by Ministry of Environment, Water Pollution Control Guidelines, 4 September 1988, Official Gazette No: 19919. 4 World Bank, 1997. Pollution Prevention and Abatement Handbook-Part III. Tanning and Leather Finishing.
142
The State Statistic Institute’s Manufacturing Industry Waste Survey was completed in 1993, with sectoral pollution discharges assessed for that year. According to the survey results, the commissions measure pollution discharges hourly or daily depending on the specific pollutant being examined. The pollutants monitored are: BOD, Phenol, COD, TSS, pH, Oil, Grease, Cr-total, Cr+6, and Nitrogen. The sectors monitored are the manufacture of fur and leather products (ISIC 3221), manufacture of wearing apparel (except for fur and leather (ISIC 3222)), tanneries and leather finishing (ISIC 3231), and manufacture of footwear (except vulcanize or molded rubber of plastic footwear (ISIC 3240)). Of the above mentioned sectors, this study focuses on ISIC 3231. To shed light on the impact of strict environmental regulation on the export, import, and output of leather industry products, one needs to determine abatement costs as a percentage of total output cost. The assessment of abatement costs is relevant since these values may have an effect on the cost of production and on comparative advantages in the export market. The methodology used for the computation is explained below.
Based on 1993 data, one can estimate the level of pollution reduction required to comply with a standard by comparing effluent concentrations from average levels (ca in mg/l) to the standard being examined (cs in mg/l). This percentage reduction in effluents ((ca-cs)/ca), can be used to compute the necessary yearly discharge reduction in effluents defined in tons/year for each pollutant (A).5 Since there is no information on unit abatement costs for the Turkish leather sector, the Industrial Pollution Projection System (IPPS) indexes are used to compute the abatement cost of each pollutant. The IPPS method was developed by the Environment and Infrastructure Division of the Policy Research Department (PRDEI) of the World Bank.6
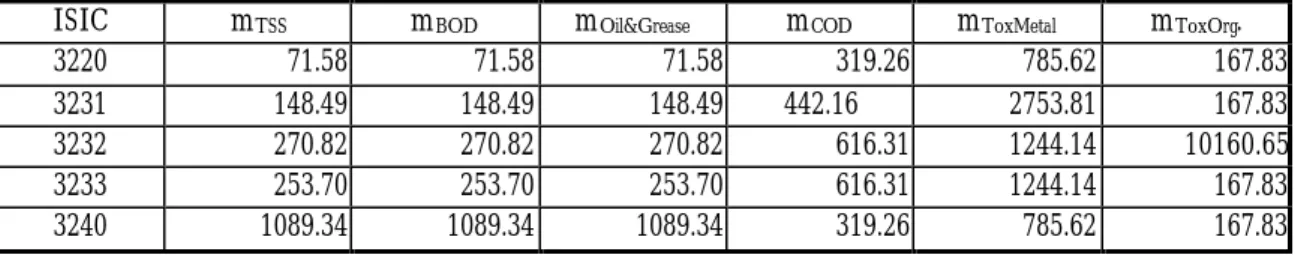
IPPS is a system for estimating abatement costs using industry data. Abatement cost estimates of IPPS were obtained by merging data from the United States Census Bureau and the U.S. Environmental Protection Agency’s (USEPA) data on 200,000 U.S. plants. IPPS data consists of abatement cost coefficients given in US$1994 per ton abated, as illustrated in Table 5. All the costs are average costs. IPPS sources provide abatement cost coefficients for pollutants such Biological Oxygen Demand (BOD), Chemical Oxygen Demand (COD), Total Suspended Solids (TSS), Oils and Greases, Toxic Metals (WTXMT), and Toxic Organics (WTXORG).
Table 5: Abatement Cost Coefficients (m) (1994 US$/ton abated)
ISIC mTSS mBOD mOil&Grease mCOD mToxMetal mToxOrg.
3220 71.58 71.58 71.58 319.26 785.62 167.83
3231 148.49 148.49 148.49 442.16 2753.81 167.83
3232 270.82 270.82 270.82 616.31 1244.14 10160.65
3233 253.70 253.70 253.70 616.31 1244.14 167.83
3240 1089.34 1089.34 1089.34 319.26 785.62 167.83
Source: World Bank/PRDEI, Industrial Pollution Projections Project, 1995.
Based on the IPPS indexes, the annualized average costs (AAC) to meet existing Turkish or World Bank standards are computed as: AACi = Ai*mi, where i = specific pollutant.
The AAC is computed in US$1994. To be able to express these values in percentage of 1993 sectoral output, the total abatement costs are first converted to 1993 TL,7 and then deflated with
5 A = YD(kg/year)*[(ca-cs)(mg/l)/ca(mg/l)].
6 For more information, see Hettige, M.P. et. al.. “The Industrial Pollution Projection System,” Policy Research Working Paper No: 1431. Policy Research Department, Environment, Infrastructure, and Agriculture Division, Washington, D.C.: World Bank, 1995.
143
the Turkish CPI.8 The sum of the abatement costs is then divided with the total output value of the sector. The results are given in Table 6.
Table 6: Abatement cost estimation Average Discharge (mg/l) World Bank Standards (mg/l) Average Amount to Abate (mg/1) Yearly discharge (kg/year) Reduction in discharge (tons/year) Average Abatement Cost (US$1994) Average Annual Abatement Cost Total Sectoral Output Abatement Cost % Share
ISIC (ca) (cs) (ca-cs) (YD) (A) (AAC) (TL1993) (TL1993)
1.88 6.94
3231 BOD 1258.75 50 1208.75 1.76 16901.7 4.20 5.60E+10
3231 COD 3630 250 3380 7.90 7375.5 4.50 5.90E+10
3231 Total Cr 57.125 0.5 56.625 0
3231 Oil&Grease 311.25 10 301.25 4.30 4216.8 1 1.40E+10
Total (Based on World Bank Standards) 1.31
Average Discharge (mg/l) Turkish Standards (mg/l) Average Amount to Abate (mg/1) Yearly discharge (kg/year) Reduction in discharge (tons/year) Average Abatement Cost (US$1994) Average Annual Abatement Cost Total Sectoral Output Abatement Cost % Share
ISIC (ca) (cs) (ca-cs) (YD) (A) (AAC) (TL1993) (TL1993)
1.88 6.64
3231 BOD 1258.75 150 1108.75 1.76 15503.4 3.90E+06 5.10
3231 COD 3630 250 3380 7.90 7375.5 4.50E+06 5.90
3231 Total Cr 57.125 3 54.125 0
3231 Oil&Grease 311.25 30 281.25 4.30 3936.9 9.00E+05 1.30
Total (Based on Turkish Standards) 1.25
The results show that for sector 3231 it would cost 6.64% and 6.94% of the 1993 total output to comply with the Turkish and World Bank environmental regulations, respectively. These values can be considered as low estimates since no abatement cost is included into the computations for pollution such as Cr-total, Phenol, Sulfide, Chromium (hexavalent), TSS, and Coliform, since no IPPS index is available for these pollutants.
Furthermore, the computation assumes that the technology used in Turkey is the same as the ones used in the United States. Hence, the results are purely indicatory for the analysis. Nevertheless, these abatement cost estimates are supported by the results of an environmental assessment survey organized by the State Planning Organization of Turkey. The survey was based on the activities of leather producers in the area of Istanbul in 1998. The report notes that efforts to achieve Turkish/German or World Bank concentration standards would imply a 90-95% reduction for the pollutants included. The next section discusses the main findings of this unpublished survey
2.4 Summary Results of the Environmental Survey on the Leather Sector in Istanbul
In 1998, an environmental survey was designed and completed by the State Planning Organization in collaboration with the State Statistic Department (unpublished material). The environmental survey focused on the leather industry in Istanbul. The survey addressed three major groups of questions.
The objective of the first group of questions was to assess the level of awareness regarding environmental standards and the environmental labeling of products. The second group of questions focused on the effects of joining the Custom Union and the effect of the unification of European countries on production costs and the adoption of environmentally friendly technologies. Finally, the third group of questions collected information on the type and level of environmental technology investment conducted by firms regardless of Custom Union and EU influences. The
8 CPI = 2.255
144
financial effects (realized and expected) of an environmentally friendly technology investment on production costs was also examined.
2.4.1 Level of awareness regarding environmental standards and labeling
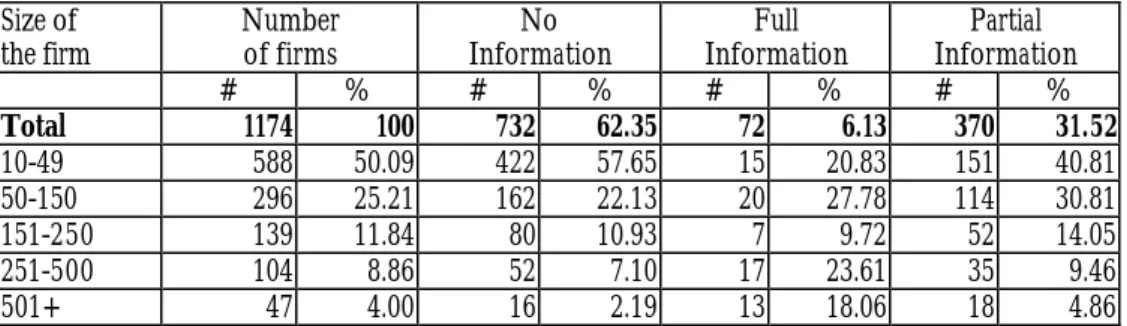
In the region of Istanbul, 1,174 leather producers are registered. About 50% of these employ 10 to 49 workers, while only 4% operate at the scale of 500 or more workers. Firms thus fall more into the category of small firms than large-scale firms. While assessing firm awareness of ISO 14000 environmental standards, 62% claimed that they have no information on such standards, 6% revealed that they have full information, and 32% had partial information on the subject. Among the firms who declared of having no information, 58% were small firms (see Table 7, compiled from Q50 in the survey).
Table 7: Level of awareness on ISO 14000 Environmental Standard (Q50) Size of the firm Number of firms No Information Full Information Partial Information # % # % # % # % Total 1174 100 732 62.35 72 6.13 370 31.52 10-49 588 50.09 422 57.65 15 20.83 151 40.81 50-150 296 25.21 162 22.13 20 27.78 114 30.81 151-250 139 11.84 80 10.93 7 9.72 52 14.05 251-500 104 8.86 52 7.10 17 23.61 35 9.46 501+ 47 4.00 16 2.19 13 18.06 18 4.86
ISO 14000 certification was assessed among 442 firms. About 3.85% had obtained the certificate, while 96.15% operated without it (Table 8, Q51). Small (10-49 employees) and large (501+ employees) size firms had the most ISO 14000 certificates.
Table 8: ISO 14000 Environmental Certificate Obtained (Q51)
Size of No the firm Number Of firms Yes # % # % # % Total 442 100 425 96.15 17 3.85 10-49 166 37.6 161 37.88 5 29.41 50-150 134 30.3 131 30.82 3 17.65 151-250 59 13.3 58 13.65 1 5.88 251-500 52 11.8 49 11.53 3 17.65 501+ 31 7.0 26 6.12 5 29.41
Eco-labeling of products is a common practice in several nations. Labeling systems can assure not only the environmental quality of the product, but also of the quality of the production technology used. Nevertheless, eco-labeling is not common among Turkish leather producers. Among the firms polled, 65% claimed of having no information on eco-labeling, 6% had full information, and 29% revealed having partial information (Table 9, Q52).
145 Table 9: Level of Awareness on Eco-labeling (Q52)
Size of Number No
the firm Of firms Information
Full Information Partial Information # % # % # % # % Total 1174 100 767 65.33 71 6.05 336 28.62 10-49 588 50.09 444 60.66 15 20.83 129 34.86 50-150 296 25.21 169 23.09 26 36.11 101 27.30 151-250 139 11.84 80 10.93 8 11.11 51 13.78 251-500 104 8.86 51 6.97 15 20.83 38 10.27 501+ 47 4.00 23 3.14 7 9.72 17 4.59
While assessing the number of firms applying eco-labeling systems, 88% noted that they do not use it on their products and about 12% apply it on a total of 76 products. Eco-labeling is mostly practiced in small sized firms, i.e. firms with 10-49 and 50-150 employees (Table 10, Q53 & 54).
Table 10: Firms Applying Eco-labeling (Q53 & Q54)
Size of Number Number
the firm of firms
No Yes of Products # % # % # % Total 407 100 359 88.21 48 11.79 76 10-49 144 12.27 132 36.77 12 25.00 17 50-150 127 10.82 108 30.08 19 39.58 32 151-250 59 5.03 52 14.48 7 14.58 14 251-500 53 4.51 46 12.81 7 14.58 10 501+ 24 2.04 21 5.85 3 6.25 3
2.4.2 United European Market and Custom Union effect on the Turkish leather sector
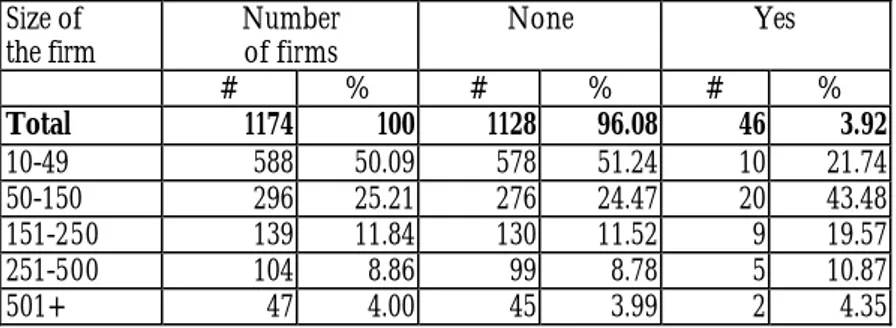
The European Union has adopted several environmental regulations to assure unified environmental standards for products and production technologies. Similar regulations might be required from nations interested in exporting to the region. Hence, the objective of the first series of questions was to assess producers’ opinion on the possible effect of international environmental regulations on their export activities. The majority of the producers (96%) claimed that there would be no effect and 4% of the producers said that there would be an effect on their export activities (Table 11, Q55). Furthermore, small and medium scale producers felt that such regulations would have some impact on their production costs.
Table 11: Perceived Effect of EU Environmental Regulation on Turkish Leather Exports (Q55)
Size of Number None
the firm of firms
Yes # % # % # % Total 1174 100 1128 96.08 46 3.92 10-49 588 50.09 578 51.24 10 21.74 50-150 296 25.21 276 24.47 20 43.48 151-250 139 11.84 130 11.52 9 19.57 251-500 104 8.86 99 8.78 5 10.87 501+ 47 4.00 45 3.99 2 4.35
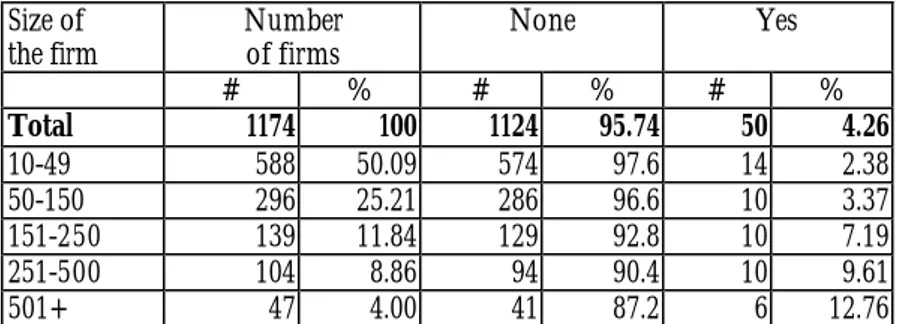
The next issue raised by the survey was the effect of the Custom Union on the adoption of environmental technologies. After Turkey joined the Custom Union, 4% of the producers invested in environmental technology, while 96% did not. Nearly 13% of the largest firms surveyed invested in environmental technology (Table 12, Q57).
146
Table 12: Level of Investment in Environmental Technology as a result of the Custom Union (Q57)
Size of
the firm Number of firms None Yes
# % # % # % Total 1174 100 1124 95.74 50 4.26 10-49 588 50.09 574 97.6 14 2.38 50-150 296 25.21 286 96.6 10 3.37 151-250 139 11.84 129 92.8 10 7.19 251-500 104 8.86 94 90.4 10 9.61 501+ 47 4.00 41 87.2 6 12.76
Firms initiated several types of investment as a result of Turkey joining the Custom Union. Wastewater treatment, air pollution reduction, noise abatement, and dust reduction were the most common. Solid waste and hazardous waste treatment management was also addressed by some production facilities. For these facilities, 80% of these investments are completed, 8% are in construction, and 12% are at the planning stage (Table 13, Q58).
Table 13: Investment in Environmental Technology (completed and planned) as a result of the Custom Union (Q58)
Stage of
Investment Number of Waste Water Pollution Air Waste Solid Hazardous Waste Reduction Noise Level Dust Gas Level Other Activity Total Firms Treatment Treatment Treatment Treatment Decrease Decrease
Total 50 35 17 8 7 17 25 14 5 128
Planning stage 6 (12%) 5 3 2 1 2 4 2 0 19
Construction stage 4 (8%) 4 2 4 1 2 3 1 2 19
Completed 40 (80%) 26 12 2 5 13 18 11 3 90
2.4.3 Investment in Environmental Technology
Independently of joining the Custom Union or taking into consideration the possible effect of new international regulation required by the EU, some leather producers were already at the stage of completing the adoption of environmental friendly production processes. The types of investment involved methods of saving energy, reducing water consumption, and the use of hazardous chemicals with 33%, 30%, and 48% respectively. The adoption of renewable energy and noise reduction technologies was pursued at 11% and 18.5% respectively (Table 14, Q64).
Table 14: Type of Environmental Technology (completed and planned) in the Leather Industry (Q64)
Number of
Firms Energy Savings Renewable Energy Savings Water Decreased Chemical Application
Quality
Quantity Reduction Noise Other Activity Total
Completed 27 9 3 8 13 13 5 0 51
% 33.3 11.1 29.6 48.1 48.1 18.5 0.0
Planned 27 5 2 4 5 9 5 1 30
% 18.5 7.4 14.8 18.5 33.3 18.5 3.7
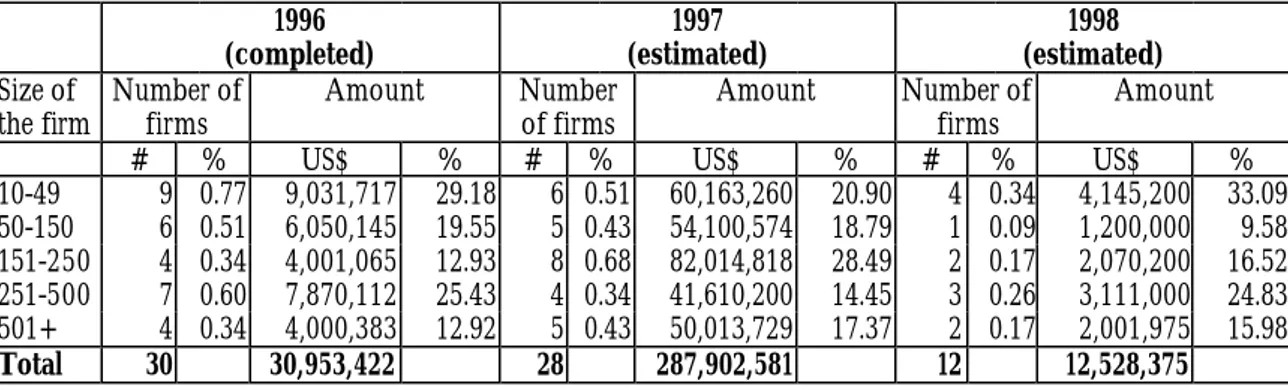
While assessing the costs of such investments, it turned out that in 1996 about US$30 million was invested in environmental technologies in the leather sector around Istanbul. The percentage distribution of this investment was largest in small and medium sized industries with 29% and 25% respectively. For 1997, the amount was estimated to be about US$287 million. The level of investment in 1998 was expected to be much less than previous years, with an estimated total of US$12 million. This decreased level was due to the smaller number of firms perceived benefiting of such an investment. There were twelve firms planning to adopt new environmental technologies
147
in 1998, versus 28 and 30 firms in 1997 and 1996 respectively. This corresponds to an average investment of US$1 million firm per year (Table 15, Q59).
Table 15: Investment in Environmental Technology (Q59)
1996 (completed) 1997 (estimated) 1998 (estimated) Size of
the firm Number of firms Amount Number of firms Amount Number of firms Amount
# % US$ % # % US$ % # % US$ %
10-49 9 0.77 9,031,717 29.18 6 0.51 60,163,260 20.90 4 0.34 4,145,200 33.09 50-150 6 0.51 6,050,145 19.55 5 0.43 54,100,574 18.79 1 0.09 1,200,000 9.58 151-250 4 0.34 4,001,065 12.93 8 0.68 82,014,818 28.49 2 0.17 2,070,200 16.52 251-500 7 0.60 7,870,112 25.43 4 0.34 41,610,200 14.45 3 0.26 3,111,000 24.83 501+ 4 0.34 4,000,383 12.92 5 0.43 50,013,729 17.37 2 0.17 2,001,975 15.98 Total 30 30,953,422 28 287,902,581 12 12,528,375 Investing in environmental technology might place some burden on producers. For instance, it may result in a decreased level of production in the short run. Fifty firms responded to survey Question 56, which asked firms to assess the realized and expected effects of environmental technology investment on their production cost. In total terms, 66% of the producers realized a 0-5% effect on production costs, 28% observed a 6-10% effect, and about 6% experienced an effect above 11% on their production costs. The low range (0-5%) effect was realized among the small scale producers (37%) and the higher range effect (6-10%) was observed among the larger scale producers (28.5%).
In total, 61% of firms expected a 0-5% effect on production costs, while 22% predict a 6-10% increase in the production costs. About 17% estimate an increase greater than 10% in their production costs due to investment in environmental technology (Table 16, Q56).
Table 16: Environmental Technology investment costs effect on production costs (Q56) Size of
the firm of #
firms Realized Expected Realized Expected Realized Expected Realized Expected # 0-5 % 0-5 % 6-10 % 6-10 % 11-16 % 11-16 % 17-20 % 17-20 % 10-49 14 12 36.36 12 38.71 1 7.14 0 0.00 0 0.00 1 20.00 0 0.00 1 20.00 50-150 10 5 15.15 4 12.90 4 28.57 2 18.18 1 7.14 2 18.18 0 0.00 2 18.18 151-250 10 5 15.15 3 9.68 4 28.57 5 45.45 0 0.00 2 18.18 0 0.00 2 18.18 251-500 10 6 18.18 7 22.58 4 28.57 3 27.27 0 0.00 0 0.00 0 0.00 0 0.00 501+ 6 5 15.15 5 16.13 1 7.14 1 9.09 0 0.00 0 0.00 0 0.00 0 0.00 Total 50 33 66 31 61 14 28 11 61 1 2 5 10 0 2 5 10
3. THE ECONOMIC MODEL
To examine the impact of environmental influences on production and trade in the leather industry we adopt a modified version of Cline’s model (1987).9 The model in essence is a demand determined partial equilibrium model that puts special emphasis on the exports and imports of the sector. The model explains six endogenous variables, each of which are expressed a function of exogenous and lagged endogenous variables. The equations that explain the endogenous variables are: an import price equation, a domestic price equation, a consumption equation, import demand, export demand by other countries, and output equations for the leather industry.10 The dynamic
9 William A. Cline. The Future of World Trade in Textiles and Apparel. Institute for International Economics. Washington, D.C. 1987.
148
and recursive structure of the model enables simulating production and trade experience under actual conditions and under alternative environmental scenarios.
The equations for endogenous variables and the intuition behind them are as follows:
The ratio of the price of imports in year t to the price of imports in year t-1 (i.e., m t m t P P / −1) is assumed to be determined by the lagged percentage change in tariff rates, the percentage change in real exchange rates, and the lagged percentage change in the international prices of the product. More formally the equation for the import price is:
(1)
[
]
[
( )
]
+
+
=
− − − − 2 1 1 11
ˆ
1
ˆ
t t t t m t m tI
I
e
T
P
P
where the overhat notation refers to proportional change; the subscript t refers to the year; Tt equals
unity plus the tariff rate in year t; and et is the real exchange rate in year t. It is the real price of the product in export markets. The variables with t-1 subscripts refer to the real value of that variable in the previous year. A more detailed derivation of this equation is provided in the Annex B
Domestic consumers have the option of consuming either domestically produced products or imported goods. Hence, the domestic consumption price of a product is assumed to be the weighted average of the domestic production price and the import price.
W
tdandW
tm are used as the share of domestic output and imports from other countries in total consumption, respectively. In definingW
td andW
tm, the following equations are used:1 1 1 1 1 − − − − −
=
−
=
t t m t t t t d tC
M
W
C
X
Q
W
where Q is the output; X is the exports; M is the imports; and C is the consumption, all defined in real values.
Changes in the domestic price facing consumer ( c t c t P
P / −1), is assumed to be the weighted average of the changes in the price of domestically produced goods ( d
t d t P
P / −1) and lagged changes in the
price of imported goods ( m
t m t P
P−1/ −2). With this notation at hand, the equation for domestic price is: (2) + = − − − − m t m t m t d t d t d t c t c t P P W P P W P P 2 1 1 1
demand that consists of domestic and international demand for the product.
149
Changes in the real values of consumption from year t-1 to year t is assumed to be a function of the rate of population growth (
g
tpop), the lagged rate of growth of per capita income ( yt
g −1); and the lagged proportionate change in the domestic price of the output( −1 / −c2 −1)
t c t P
P . With this
notation, the consumption function can be written as:
(3)
[
][
]
− + + + = − − − − 1 1 1 1 2 1 1 1 c t c t cp y t cy pop t t t P P e g e g C Cwhere ecyis the elasticity of per capita consumption with respect per capita income and ecp is the price elasticity of consumption.
The imports demand equation is a traditional one, where changes in imports depends upon a proportionate change in lagged imports prices
{
(
−1/ −2)
−1}
m t m t P
P and a lagged proportionate change
in income
{
(
Y
t−1/
Y
t−2)
−
1
}
. Expressed in terms of real values, this equation can be specified as:(4)
−
+
−
+
=
− − − − −1
1
1
1
2 1 2 1 1 t t my m t m t mp t tY
Y
e
P
P
e
M
M
where emp is the price elasticity of import demand; emyis the income elasticity of import demand; and Y is the real GNP.
Change in real export demand from year t-1 to year t is explained by the proportionate
change in real values of the rest of the world income
( / −RO1 −1)t RO t Y
Y
, and the lagged
proportionate change in the relative price. The relative prices are defined as the ratio of
the real domestic production price to the real TL values of international prices.(5)
−
+
−
+
=
− − − − − − − −1
.
.
1
1
1
2 2 2 1 1 1 1 1 t t d t t t d t xp RO t RO t xyRO t te
I
P
e
I
P
e
Y
Y
e
X
X
where exyRO is the income elasticity of export demand;
Y
t ROis the real GNP in the rest of the world; expis the price elasticity of exports; and all other variables are defined as before.
Domestic output is defined as the residual between domestic consumption and exports on one hand and imports on the other hand. Its expression is given below:
(6)
Q
t=
C
t+
X
t−
M
tThe matrix below summarizes the variables of the model by distinguishing between endogenous, exogenous, and lagged endogenous variables and parameters.
150 The Model Endogenous Variables Exogenous Variables Lagged Endogenous Variables Parameters Equation m t P 1 2 1
ˆ
ˆ
,
− − − t t t tT
e
I
I
m t P−1 Equation 1 c t P d t d tP
P
,
−1 1 1 1 1 1 2 1 , , , , , , − − − − − − − t t m t t t t d t m t m t C M W C X Q W P P Equation 2 tC
y t pop tg
g
1 − c t c t tP
P
C
2 1 1 − − − (recursively) cp cy e e , Equation 3 tM
2 1 − − t tY
Y
m t m t tP
P
M
2 1 1,
− − − emp,emy Equation 4 tX
2 1 2 1 2 1 1 , , , , − − − − − − − t t t t d t d t RO t RO t e e I I P P Y YX
t−1 exyRO,exp Equation 5 tQ
C
t,
X
t,
M
t (recursively) Equation 6 3.1 ObjectiveThe primary objective of this study is to understand the impact of activities to improve environmental quality on exports, output, and consumption. It is not meant to be a statistical estimation of the parameter values in the above model. Therefore the approach used will be to draw upon existing econometric literature to establish the boundaries of the parameter values and to choose the parameter values that will be used in the historical simulations by employing either econometric estimation or calibration techniques.
Once the reliable historical simulations are obtained, one can then incorporate the cost increasing effect of environmental improving activities into the model. If we denote t as being the percentage change of average cost in domestic production due to environmental improving activities, one can safely assume that a fraction s of the cost increase t will increase domestic production prices. More explicitly, s is a function of relevant demand and supply elasticities that finds its expression as:
1
1
+
=
sp cpe
e
s
151
The workings of the model suggests that an increase in the production price by an amount st will influence the output of the sector through two channels. One is through reduced consumption due to an increased consumption price, and the other is through declining exports due to an increase in the ratio of domestic prices to international prices. As can be seen from the construction of the model, no changes will occur either in the price of imports or the import values due to aforementioned increase in the production cost due to environmental measures taken.
More explicitly, the equations Eq. 2 and Eq. 5 now should be modified as:
(2′) + + = − − − − m t m t m t d t d t d t c t c t P P W P st P W P P 2 1 1 1 (5′)
−
+
+
−
+
=
− − − − − − − −1
.
.
1
1
1
2 2 2 1 1 1 1 1 t t d t t t d t xp RO t RO t xyRO t te
I
P
e
I
st
P
e
Y
Y
e
X
X
so as to incorporate the cost increasing effects of environmental measures. The comparison of the forecasted values of the two different versions of the model, one with equations Eq. 2 and Eq. 5 and the other with equations Eq. 2’ and Eq. 5’ replacing equations Eq. 2 and Eq. 5, will provide the effect of the abatement cost on price of domestic consumption, consumption, exports, and output.
4. SIMULATION RESULTS AND DISCUSSIONS
4.1 Historical Simulations
This study constrains the definition of the leather industry to sub-categories of the ISIC 3231, which are: ISIC 3231 Tanneries and Leather Finishing, and ISIC 3233 Manufacture of product of leather and leather substitutes, except footwear and wearing apparel. Annex A provides a detailed explanation for the choice of the industry and data generation. Before the dynamic simulations, we first determined the relevant price and income elasticities. A survey of the literature on the Turkish leather industry did not bring about any estimates of these elasticities. Therefore for some we resorted to estimating elasticities with the limited time series data available; for others we computed elasticities using calibration techniques to improve historical simulations (see Annex A, Table 4 for the elasticity values).
The estimation results show that leather consumption, imports, and exports are highly income elastic. For domestic consumption, income elasticity of leather demand is 1.00 for ISIC 3231 and 2.33 for ISIC 3233. For imports, the income elasticity is 15.12 and 6.66 for sectors ISIC 3231 and ISIC 3233, respectively. The fact that they are higher than the reported elasticities for apparel or textiles is as expected since leather products are considered to be more luxury goods than apparel or textiles. A higher income elasticity of import demand than income elasticity of demand is also consistent with what has been reported in the literature.11
Similarly exports are also quite elastic with respect to the income growth in the rest of the world. An estimated elasticity of the rest of the world income of approximately 24.00 for ISIC 3231 and 5.09 for ISIC 3233 are considerably higher than the elasticity values reported in the studies on apparel and textiles. While interpreting these figures, one also should keep in mind that the period
152
under study coincides with years during which Turkey experienced rapid expansion in overall exports as a results of export promoting growth strategy pursued during the 1980s.
Estimated price elasticities show quite a variation between equations. While price elasticities of import demand are rather low (-0.05 for ISIC 3231 and -0.17 for ISIC 3233), exports are rather price elastic (-2.19 for ISIC 3231 and -1.96 for ISIC 3233). That is, when domestic leather prices decline, the demand for Turkish exports by foreigners substantially increases. For the consumption equations, estimated price elasticities of -1.12 for ISIC 3231 and -0.98 for ISIC 3233 seem quite consistent with what is observed for textiles and apparel industry in general.
In solving the models, dynamic simulations of the simultaneous equations are conducted. This method uses historical data for lagged endogenous variables that are dated prior to the first period of the simulations. Thereafter it uses the values forecasted by the model itself for these endogenous variables. This estimation procedure allows for true multi-period forecasts.12
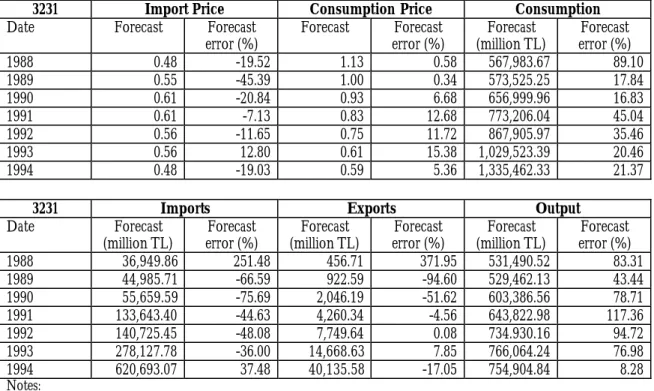
The following are the results of the historical simulations where the effect of the increase in the domestic prices due to activities that increase environmental quality is omitted (i.e., where t=0 in the models). The tables below (Table 17 and Table 18) show the simulated (forecasted) and the forecast errors as a percentage of the actual values obtained from the model solutions using the elasticity values discussed above. While we analyze the error terms for ISIC 3231, one can observe that for import prices and imports the errors are underestimated, while for consumer price, exports, and output they are overestimated. The error terms for consumption are both over and underestimated for different years.
Table 17: The Results of the Historical Model Simulations for ISIC 3231
3231 Import Price Consumption Price Consumption
Date Forecast Forecast
error (%) Forecast Forecast error (%) Forecast (million TL) Forecast error (%) 1988 0.48 -19.52 1.13 0.58 567,983.67 89.10 1989 0.55 -45.39 1.00 0.34 573,525.25 17.84 1990 0.61 -20.84 0.93 6.68 656,999.96 16.83 1991 0.61 -7.13 0.83 12.68 773,206.04 45.04 1992 0.56 -11.65 0.75 11.72 867,905.97 35.46 1993 0.56 12.80 0.61 15.38 1,029,523.39 20.46 1994 0.48 -19.03 0.59 5.36 1,335,462.33 21.37
3231 Imports Exports Output
Date Forecast (million TL) Forecast error (%) Forecast (million TL) Forecast error (%) Forecast (million TL) Forecast error (%) 1988 36,949.86 251.48 456.71 371.95 531,490.52 83.31 1989 44,985.71 -66.59 922.59 -94.60 529,462.13 43.44 1990 55,659.59 -75.69 2,046.19 -51.62 603,386.56 78.71 1991 133,643.40 -44.63 4,260.34 -4.56 643,822.98 117.36 1992 140,725.45 -48.08 7,749.64 0.08 734.930.16 94.72 1993 278,127.78 -36.00 14,668.63 7.85 766,064.24 76.98 1994 620,693.07 37.48 40,135.58 -17.05 754,904.84 8.28 Notes:
Import prices: Real price index, 1989=1.00; Domestic Consumption Price: Real price Index, 1989=1.00 Consumption: Real TL values in 1989 prices; Imports: Real TL values in 1989 prices;
Exports: Real TL values in 1989 prices; Output: Real TL values in 1989 prices.
153
Table 18: The Results of the Historical Model Simulations for ISIC 323313
3233 Import Price Consumption Price Consumption
Date Forecast Forecast
error (%) Forecast Forecast error (%) Forecast (million TL) Forecast error (%) 1987 0.22 41.97 0.79 -4.56 2,826.43 -19.39 1988 0.22 -0.31 0.68 -2.64 4,350.12 -31.34 1989 0.23 6.89 0.71 -20.32 4,887.71 -14.37 1990 0.20 85.48 0.78 -17.17 4,606.02 25.00 1991 0.24 100.62 0.69 20.17 5,789.37 33.47 1992 0.23 30.15 0.67 59.36 6,002.02 -37.97 1993 0.20 41.21 0.66 2.46 7,837.92 -23.13 1994 0.20 6.01 0.63 3.04 10,722.85 1.51
3233 Imports Exports Output
Date Forecast
(million TL) error (%) Forecast (million TL) Forecast error (%) Forecast (million TL) Forecast error (%) Forecast
1987 971.16 -13.63 897.00 -62.16 2,752.28 -42.09 1988 1,093.69 39.55 1,039.95 185.26 4,296.39 -27.39 1989 1,214.98 39.91 1,709.64 -46.70 5,382.37 -33.11 1990 1,948.37 11.43 1,900.63 -53.16 4,558.28 -23.95 1991 2,040.29 -24.58 2,395.28 -31.11 6,144.36 20.26 1992 2,812.38 0.51 2,929.36 -20.92 6,119.00 -42.18 1993 4,381.16 2.62 4,064.79 7.48 7,521.54 -22.53 1994 2,666.10 6.84 4,779.27 40.58 12,836.03 11.93 Notes:
Import prices: Real price index, 1982=1.00; Domestic Consumption Price: Real price index, 1982=1.00 Consumption: Real TL values in 1982 prices; Imports: Real TL values in 1982 prices.
Exports: Real TL values in 1982 prices; Output: Real TL values in 1982 prices. 4.2 Simulations with Abatement Costs
4.2.1 The Effect of Additional Abatement Costs on Consumption, Exports and Output
For the four digit ISIC industry classification in ISIC 3231 and ISIC 3233, the estimated abatement costs required for compliance with the Turkish standards (t) have been computed to be 6.64% and 2.22% of the domestic value of production, respectively.14
The following analysis for ISIC 3231 presents the impact of the increase in domestic production prices (which stems from activities to enhance environmental quality of Turkish standards) on the endogenous variables of the model. In this exercise we compute a possible 6.64% increase in production cost due to abatement enhancements, given an output supply elasticity (esp) equal to 2.00 and price elasticity of demand (ecp) equal to –1.12. Hence, the increase in the domestic production price (Ptd) is equal to 4.25% in sector ISIC 3231 starting from the year 1989 and continuing onwards. The change in the key endogenous variables due to this increase in production cost is reported in Table 19.
13 The lag structure of the model has been modified to obtain a better fit for the sector ISIC 3233. The model equations with the new lag structure is provided in Annex IV.
14 See Table 6 for a detailed computation of the abatement cost for ISIC 3231. Since the reported data for discharge of pollutants is not available for sector ISIC 3233 in Turkey, similar computations could not be performed for this sector. The recomputation of the abatement costs using the IPPS methodology for both the sectors indicates that the abatement cost in ISIC 3233 is approximately one third of the abatement cost in ISIC 3231. Hence, a value of 2.22% is chosen as the representative figure for the abatement cost in this industry.
154
Table 19: Changes in the key endogenous variables due to a 6.64% increase in cost15
Date Consumption Price Consumption Exports Output
% change % change % change % change
1988 0.00 0.00 0.00 0.00 1989 3.93 0.00 0.00 0.00 1990 3.93 -3.47 -5.68 -3.80 1991 4.01 -3.47 -5.68 -4.21 1992 4.01 -3.55 -5.68 -4.25 1993 4.09 -3.62 -5.68 -4.97 1994 4.23 -3.68 -5.68 -6.81
Note that the domestic consumption price (Ptc) increases by 3.93% in 1989, which causes a decline
in consumption by 3.47% in 1990. When coupled by a reduction of exports by 5.67%, this causes a decline in output by 3.80% in 1990. While the effect of an equal increase in abatement cost each year is to create a steady decline in exports each year, the effect on domestic consumption price, consumption, and output are expanding over time.
In addition to the above baseline simulations, further policy simulations were performed to determine the sensitivity of the model’s results to the changes in to key parameters, namely export price elasticity and percentage change in production cost due to abatement. For export price elasticity we considered two additional values representative of the cases where exports are either price inelastic 0.5) or exports are more price elastic 4.19) compared to the baseline (exp=-2.19). Simulations were also extended to include two alternative abatement cost values, one that is higher (t=8%) than the baseline and another which is lower (t=5%).
Table 20: Comparison of Export and Output Changes with Different Export Price Elasticities in Sector ISIC 3231
Date Baseline Exports Output Low Exports Output High Exports Output
% change % change % change % change % change % change
1988 0.00 0.00 0.00 0.00 0.00 0.00
1989 0.00 0.00 0.00 0.00 0.00 0.00
1990 -5.68 -3.80 -1.63 -3.79 -8.73 -3.82
1991 -5.68 -4.21 -1.63 -4.19 -8.73 -4.25
155
1992 -5.68 -4.25 -1.63 -4.22 -8.73 -4.32
1993 -5.68 -4.97 -1.63 -4.93 -8.73 -5.11
1994 -5.68 -6.81 -1.63 -6.78 -8.73 -7.13
As expected from the structure of the model, a higher export price elasticity increases the impact of a given abatement cost on the percentage decline in exports. It does so without having any effect on the percentage change in the domestic consumption price or the percentage change in consumption, although it does have a minor impact on the growth rate of output.
The tables below (Table 21) show percentage changes in the key endogenous variables for the alternative values of t. The results indicate that the decline in exports will be in between the ranges of 4.28% and 6.84% for low and high percentage changes in production cost due to measures taken to improve the environment. Note here that in addition to the percentage change in exports, the percentage changes in the price of consumption, consumption, and output proved to be quite sensitive to the variation in changes in production costs.
Table 21: Comparison of Percentage Changes in the Key Variables with Different Abatement Costs Scenarios in Sector ISIC 3231
Low t values
Date Consumption Price Consumption Exports Output
% change % change % change % change
1988 0.00 0.00 0.00 0.00 1989 2.96 0.00 0.00 0.00 1990 2.96 -2.62 -4.27 -2.86 1991 3.02 -2.62 -4.27 -3.17 1992 3.09 -2.67 -4.27 -3.20 1993 3.15 -2.73 -4.27 -3.75 1994 3.18 -2.77 -4.27 -5.13 High t values
Date Consumption Price Consumption Exports Output
% change % change % change % change
1988 0.00 0.00 0.00 0.00 1989 4.73 0.00 0.00 0.00 1990 4.73 -4.19 -6.84 -4.58 1991 4.84 -4.19 -6.84 -5.07 1992 4.95 -4.28 -6.84 -5.12 1993 5.05 -4.36 -6.84 -5.99 1994 5.11 -4.44 -6.84 -8.21
A similar analysis was also carried out for ISIC 3233 to evaluate the impact of environment enhancing policies on the export, output, and consumption of the sector. As one can follow from the table below, an increase in production costs by 2.22% from 1989 and onwards increases consumption prices by 1.1%, and hence reduces consumption by 1.2% in 1990. The effect of this cost increase is to decrease exports by 3.05%. The impact of an equal increase in the cost of production each year is to create a fluctuating percentage increase in price of consumption, and hence a fluctuating percentage decrease in consumption and output. Note that this effect is different from that of sector ISIC 3231 where equal increases in the cost of production creates an expanding effect on domestic consumption price, consumption, and output.
156
Table 22: Changes in the Key Endogenous Variables due to a 2.22 % increase in cost
Date Consumption Price Consumption Exports Output
% change % change % change % change
1987 0.00 0.00 0.00 0.00 1988 0.00 0.00 0.00 0.00 1989 1.12 0.00 0.00 0.00 1990 1.12 -1.22 -3.04 -2.50 1991 1.09 -1.22 -3.04 -2.33 1992 1.26 -1.20 -3.04 -2.63 1993 1.21 -1.35 -3.04 -3.05 1994 1.03 -1.30 -3.04 -2.22 1994 5.11 -4.44 -6.84 -8.21
To determine the sensitivity of the results to changes in the key parameters, the model is simulated with alternative values assumed for the export price elasticity (exp) and changes in the production costs (t) due to abatement policies. As was the case for sector ISIC 3231, we tried a more elastic (exp=-3.00) and an inelastic (exp=-0.5) value for the export price elasticity compared to the baseline model. The table below shows the comparison of the changes in exports and output for alternative values of export price elasticity.
Table 23: Comparison of Export and Output Changes with Different Export Price Elasticities in Sector ISIC 3233
Date Baseline Exports Output Low Exports Output High Exports Output
% change % change % change % change % change % change
1987 0.00 0.00 0.00 0.00 0.00 0.00 1988 0.00 0.00 0.00 0.00 0.00 0.00 1989 0.00 0.00 0.00 0.00 0.00 0.00 1990 -3.04 -2.50 -0.75 -1.38 -4.76 -2.71 1991 -3.04 -2.33 -0.75 -1.34 -4.76 -2.51 1992 -3.04 -2.63 -0.75 -1.41 -4.76 -2.99 1993 -3.04 -3.05 -0.75 -1.71 -4.76 -3.68 1994 -3.04 -2.22 -0.75 -1.31 -4.76 -2.41
For this sector, simulations were also conducted for two alternative abatement cost values, one that is higher (t=4.44%), and another that is lower (t=1.0%) than the baseline. The outcomes of these simulations are reported below. The results show that 6.09% decrease in exports is associated with a 4.44% increase in production cost, while 1.37% drop in export values are the results of a 1.00% increase in cost of production due to environment enhancing measures.
Table 24: Comparison of Percentage Changes in the Key Variables with Different Abatement Costs Scenarios in Sector ISIC 3233
Low t values
Date Consumption Price Consumption Exports Output
% change % change % change % change
1987 0.00 0.00 0.00 0.00 1988 0.00 0.00 0.00 0.00 1989 0.50 0.00 0.00 0.00 1990 0.50 -0.55 -1.37 -1.13 1991 0.49 -0.55 -1.37 -1.05 1992 0.57 -0.54 -1.37 -1.19 1993 0.54 -0.61 -1.37 -1.37 1994 0.46 -0.59 -1.37 -1.00 High t values
157
Date Consumption Price Consumption Exports Output
% change % change % change % change
1987 0.00 0.00 0.00 0.00 1988 0.00 0.00 0.00 0.00 1989 2.24 0.00 0.00 0.00 1990 2.24 -2.44 -6.09 -5.00 1991 2.19 -2.44 -6.09 -4.67 1992 2.53 -2.40 -6.09 -5.27 1993 2.42 -2.70 -6.09 -6.10 1994 2.05 -2.60 -6.09 -4.44 5. CONCLUSION
Given the limited investment in environmentally friendly technologies in the sector, leather production is considered to be one of the most polluting industries in Turkey. Strict environmental standards, and the enforcement of those standards, thus need to be established to control effluents and possible environmental health threats caused by the sector.
According to data provided by the Turkish State Statistics Institute, leather producers generally discharge above permissible levels. This high level discharge is due to the low percentage of firms using environmental friendly technologies. This is confirmed by a 1998 survey of leather producer in the region of Istanbul. As the survey indicates, only 4% of producers have invested in environmentally friendly technologies. These investments went primarily for wastewater treatment plants, air pollution reduction facilities, noise pollution, and hazardous waste treatment. Of those who invested in environmental technologies, 66% claimed that such an investment increased their production costs by 0-5%, 28% claimed that they faced a 6-10% increase in costs, while only 10% realized an increase in production costs of above 10%. The survey also reported that only 4% of producers had obtained ISO 14000 certification, while about 62% were unaware of the certification system and 32% has just partial information.
Thus, one can conclude that the short-term effect of investing in environmental technology would not significantly increase operating costs. Nevertheless, such investments have not been realized since there is no system of effective national or international environmental enforcement that provides the incentive for making environmental investments, nor is there sufficient awareness and understanding of the environmental certification systems available to producers.
The empirical portion of this study estimated that the effect of enforcing Turkish effluent standards on the cost of production to be approximately 6.64%. This is in accordance with the realized cost increases reported by leather sector manufacturers in the Istanbul survey. The effect of this cost increase on output, export, and consumption was analyzed in a partial equilibrium framework. The results show that a possible 6.64% increase in the production cost due to abatement would increase domestic prices by 4.25% in sector ISIC 3231, based on data starting in year 1989 and continuing onwards. This would have increased the domestic consumption price by 3.93% in 1989, which would have resulted in a decline in consumption by 3.47% in 1990. Coupled by a reduction of exports of 5.67%, this would have caused a decline in output by 3.80% in 1990.
A similar analysis was also conducted for sector ISIC 3233. In this case, an increase in production costs by 2.22% in 1989 and onwards would increase consumption prices by 1.1%. This would have reduced consumption by 1.2% in the year 1990. The effect of this cost increase is a decrease in exports by 3.05%. For both sectors, the sensitivity of the model to the key estimated parameters is evaluated by simulating the model using alternative values for export price elasticities and the percentage change in production cost due to abatement policies.
158
Turkish producers currently are relatively unregulated and discharge pollutants at concentration levels that are many times higher than Turkish and other effluent concentration standards. If investments were required to meet existing standards (over 90% abatement for pollutants included in this analysis), a best guess is that average production costs would increase about 6%. Since current pollution control costs are probably close to zero for many enterprises, this actually implies a several hundred percent increase in environmental control expenditures. However, even with such a huge increase in environmental expenditures, exports would only be effected by 1-7% depending on the various parameter assumptions used.
Several types of financial strategies might be developed to cope with the problem. For instance, there might be sequenced investments facilitated by an effluent trading system or staggered compliance. The combination of such strategies would allow firms to more easily incorporate environmental compliance costs. Other incentives might alternatively seek to increase efficiency at various stages of the production, which would ideally reduce end-of-pipe control costs before environmental damage occurs.