1680-1747 Ottoman Budgets and Deficits
Sustainability in a Period of Fiscal Transition:
Wars and Administrative Changes
Hakan Berument
* Department of EconomicsNuray Ocaklı
Department of Ottoman History Bilkent University
________________________________
* Corresponding Author: Department of Economics, Bilkent University 06800, Bilkent Ankara, Turkey. E-mail: [email protected]; tel:+90 312 266 2529; fax:+90 312 266 5140.
1680-1747 Ottoman Budgets and Deficits
Sustainability in a Period of Fiscal Transition:
Wars and Administrational Changes
Abstract
This paper studies the sustainability of the Ottoman budget for the period from 1680 to 1747, during different sultanates and war eras. Moreover, we investigate whether the relationship between government revenues and expenditures changes in the period of culus. The empirical evidence gathered in this paper suggests that during the sample period, except for the sultanate era of Mahmut I, the Ottoman budget was not sustainable. The other interesting result of the study is that culus payments had a significant tax increasing effect. Moreover, the distribution of culus deteriorated the sustainability of budget.
JEL Classification Number: N43, N45 and E62.
I. Introduction
1680-1750 period was a transition period in Ottoman history. In the period of the Köprülüs’ grant vizierates, there were attempts to reinstate the system of traditional autocracy. However, these efforts were total failures in the war period of 1683-1699. In the 18th century, local powers and provincial families increased, so the 18th century was a decentralisation interval for the Empire. After the siege of Vienna (1683), the period of stagnation closed and a period of decline started. The chief problems of the period were the budget deficit and its sustainability.
This paper examines the Empire’s central budget deficit sustainability in the period from 1680 to 1747. The data set obtained from Tabakoğlu (1985)i contains cash revenues and cash expenditures. The sources translated from Ottoman language were Ottoman budget documents ruznamçeii and budget yearbooks. According to the
ruznamçes, income and expenditure accounts were expressed in local currency, the Akçe. The aim of this study is to determine the deficit sustainability of the sultanate
intervals and the continuous war periods during this transition era. Our estimates suggest that the budget deficit was not sustainable in either the sultanate eras of the sultans or the war eras. The only exception is seen in the reign of Mahmut I, when the deficit was sustainable. When we sought the reasons for these estimation results, we found that there is a correlation between deficit sustainability and each of the following conditions: increased expenditures in war periods, payments made to
Janissaries and policies applied by the sultans reigning during that period. This paper
aims to enrich the academic literature on the Ottoman economy with the findings about budget sustainability for the 1680-1747 period as well as for various sub-periods. The next section elaborates on government expenditures and revenue figures in the light of historical developments. Section 3 explains the econometric method used in this paper. The empirical evidence is presented in section 4 and section 5 concludes the study.
II. War Period and Financial Problems
After the siege of Vienna in 1683, bureaucratic and military expenditures, in particular, increased. Following the defeat in Vienna, the war continued between
Austria and the Ottomans. While the Ottoman army was retreating towards Edirne, permanent and temporary land losses occurred in the Balkan region as a result of the battles. In addition, after the 16th Century, the share of central revenues in total revenues began to decrease. One of the main reasons for this was an increase in the defence expenditures of the state because castles on the borders required expenditures to fulfil their functions. In the mid-16th Century, the central government had been able to control 58% of total revenues but in the 17th century, this amount retrogressed to 25%. As a result of these developments, approximately all of the revenues belonged to the sultan and in war times, a large share of the sultans’ revenues from Musul, Diyarbakir, Baghdad and Crete were spent in these provinces. Thus, the revenues of provinces not in the tımar and vakıf systems started to be discluded from the central budget accounts. The spending of revenues locally, the transfer of Egypt’s waybill into the internal treasury and the assignment of some revenues to the personal treasury of the wives of sultans limited the financial area controlled by the budget of the central government. It can be seen that the Ottoman financial and budgetary system in the period between 1680 and 1747 exhibited a limited central and extended local characteristic as a result of the reasons given above.
Especially as a result of late mevacip and culus payments to the Janissaries and the discontent due to defeats, there were a threat of a military revolt in the capital, Istanbul. The uneasiness caused by army based financial problems came to light with breaking out of three military revolts during the period from 1680 to 1747. These events shook the roots of the Empire and resulted in the dethroning of Mehmet IV in 1687, Mustafa II in 1703, and Ahmet III in 1730.iii The jumps in expenditures for these dates and the deterioration of the central budget can be seen in Figure 1. In the 17th century, the Celâli revolts and wars with Iran led to a reduction in the population of Anatolia and accelerated migration to the cities. Parallel to these developments, agricultural production decreased and local governors, Âyans, gained power against the central government ivv
III. Econometric Method
In order to assess the sustainability of the Ottoman budget, we estimate the following equations.
where Revenuet is the logarithm of government tax revenues, Expenditurest is the
logarithm of government expenditures and et is the residual term at time t. α0 and α1
are the parameters of interest. In this paper, we also examined how the relationship between Revenuet and Expenditurest is affected by various factors such as different
sultanates, different war periods and culus payment periods. In order to account for these factors, we also included dummy variables (Dt) into the analysis specified in
Equation 2.
Revenue t = β 0+ β 1 D t+ β 2 Expenditures t + β 3 Expenditures t * D t + e t (2)
The dummy variables used in this study are for each sultanate, war and culus period. When the particular condition is present, the dummy variable (Dt) takes the value of 1
and zero otherwise. When the parameters of estimates are interpreted, the autonomous revenue will be β0+ β1 if the condition is met (Dt = 1) and β0 if the condition is not
met (Dt= 0). Similarly, the induced revenue will be β2+ β3, if the condition is met and
β2 if the condition is not met.vi It is also important to note that government
expenditures is not an exogenous variable but is affected by various factors, including government’s revenues. Hence, performing least squares estimation will give us biased estimates. In this paper, the Two Stage Leased Squares (2SLS) Method is used to address this problem. When the 2SLS estimates are gathered, we used two-lag values of Expenditurest, Revenuet, Dt, Expenditurest*Dt sets as instruments.
IV. Empirical Evidence
In order to analyse the budget sustainability, we used monthly data from 1090 to 1159 in the Hicri calender, which is a calender based on the moon and a year lasts 354 days. The data, including cash revenue and expenditures of the Ottoman central budget, is gathered from Tabakoglu (1985). The sources are translated from the Ottoman language. The basic sources of the data were Ottoman budget documents,
ruznamçe, and various budget yearbooks recorded in the local currency, the Akçe.
When we examine the sustainability of the budget deficit for the sample period, we need to consider three different factors as sources of possible changes in the deterioration of budget sustainability.. These are differences in sultans, war periods, and culus payments. Regression results examining these factors are summarised in Tables 1 to 6. Table 1 reports the deficit sustainability analysis for the
full sample as well as for the reign of each sultan. Tables 2 and 3 represent the results of the analysis in the specific historical eras of this period and Table 4 reports the estimates for the Iranian war era but it also considers Mahmut I’s sultanate during this war era. Table 5 gives the estimate of the testable model for the times of culus payments. The last table, Table 6, reports all these estimates with a Revenue-Expenditures ratio rather than with a Revenue-Expenditurest and Revenuet used in Tables1-5. In
these Tables, parameter estimates are reported in the first row and t-values are written in italics and in parentheses.
If the estimated coefficient of Expenditurest is less than 1, this suggests that a
government continues to spend more than it collects, we took this indication as a risk of default in the long run. For this reason, the interest rate that the government has to offer to service its debt would be higher. Hakkio and Rush (1991) note the necessity that the coefficient of expenditures be equal to one for the sovereignty of the debt, which also implies a balanced budget. While evaluating results of the analysis, our criterion is that if the coefficient is less than one, then the deficit is unsustainable; if it is greater than or equal to one, then the deficit is sustainable. In economic literature, it is prescribed that when the growth rate of a budget deficit is less than or equal to the growth rate of the economy, then the deficit is sustainable. However, we cannot consider the criterion in this study because we lack growth rate data for this period of the Ottoman economy. For this reason, the criterion mentioned above is used in the study as the indicator of deficit sustainability. One may also argue that observing just the slope coefficient while ignoring the constant term may not show the sustainability of the deficit properly. Autonomous revenue (which is captured by a constant term) shows the revenue not depending on expenditures. If the Keynesian theory is right, then expenditures stimulates the output, so the tax revenues will increase under a flat or progressive tax system. Thus, autonomous taxation depends on various factors, such as per head taxation, but it does not depend on economic performance. In the long run, the role of autonomous taxation will decrease and the budget will not be sustainable if the slope coefficient is less than one.
The results of the analysis are summarised in Tables 1-5. In Table 1, the deficit sustainability conditions in 1680-1747 period of the full sample and each sultan are reported. In the sample period, there were six reigning sultans in the Empire: Mehmet IV (1648-1687), Süleyman II (1687-1691), Ahmet II.(1691-1695), Mustafa II (1695-1703), Ahmet III (1703-1730), Mahmut I (1730-1754). For the full
sample, the coefficient of expenditures is less than 1 (0.921), which means that the budget deficit was unsustainable. Constant term accounts are taken for autonomous taxation, which usually accounts not for efficient allocation but for fixed and per head taxes. In Table 1, constant represents the autonomous taxation and this coefficient is 1.712 for the full sample, which is a small coefficient compared to the sub-sample periods. To understand the use of taxes to finance the accelerated expenditures, the information below will be helpful.
When the full sample is considered, the considerable changes and administrative difficulties either in the provinces or in the central government are seen. The expenditures of local revenues locally significantly limited the financial sources of the central budget, and sultans’ moving to Edirne because of the fear of revolt created an administrative dominance struggle in the capital. Sharply increased expenditures led governors to find new sources of finance. In different periods of the sample, new taxes were levied. However, finding new sources was not enough to cover the speed of the increase in expenditures (see Figure 1). The increasing cash need led the central government in the time of Mehmet IV to levy a new tax named “imdadiyye”. Initially, this tax was collected to finance military expenditures in urgent times and in long lasting war periods, but within a few decades it had become a regular tax collected in different amounts in either war or peace time. The grand vizier of Süleyman II, Köprülüzade Fazıl Mustafa Pasha (1689), tried to reform the tax system during his short administration. The other type of taxes levied in extraordinary cases was “avarız akcesi”. After 1683, these taxes became regular items in the central budget as well. Thus, it can be seen that sultans had a strong tendency to increase autonomous taxes to finance the increasing cash needs, but from time-to-time some governors tried reforms to decrease the tax burden on taxpayers. For instance, in 1689-1691, Köprülü Fazıl Ahmet Pasha’s period, the revenues exceeded expenditures (see Figure I). In the sultanate of Ahmet III, especially the Tulip Period of 1706-1729, sometimes there were excess revenues because of the peace policies and different applications of the sultan.
We elaborated on the idea that budget sustainability could be different for each sultan and each war era. The deficit sustainability indicator of the equation, the coefficient of Expenditurest, is less than 1 for all of the six sultans in Table 1, except
Mahmut I (1730-1754) and for all of the three intervals in Table 2 except the Ottoman-Iran War (1723-1746). Hence, we perform the regression analysis for each
sultan and each war era. The results reported in Table 1 indicate that in the sultanates of five sultans, the budget deficit was unsustainable. The lowest coefficient is -0.093 for the time of Mehmet IV. His reign was the beginning at the big land losses after the defeat of Vienna. There was also administrative uncertainity during this interval. He was six years old when he became the sultan. His reign was full of political and military problems. For instance, the first years of the Sultan passed under the strong domination of his mother Kösem Sultan. The power of the central government both in the capital and in the provinces weakened. The Janissaries’ were in control in Istanbul and Celâli pashas’ control led the provinces. The other times when the coefficients of Expenditurest were less than 1are: Süleyman II, 0.479; Ahmet II,
0.433; Mustafa II, 0.521; and Ahmet III, 0.594. During these periods, war expenditures were a big item in the central budget. During these reigns of five sultans of the sample period, these costly wars continued. In the sultanate of Süleyman II, the fight against Austrians continued in the Balkan region and the Russia attacked to the Crimea. In the time of Mustafa II, there was a big defeat in Zenta. In the time of Ahmet III, wars with Austria on land and with Venice at sea continued, and there were also occupations of Iran in Azerbaijan and Hemedan. Besides the great financial burdens of the wars, there were Janissary revolts either in the capital or in Rumelia for culus and other payments. As seen in Table 1, the highest coefficient among the coefficients of expenditures less than one, 0.594, is in the sultanate of Ahmet III. The peace policy of Ahmet III in his relations with the other states can be mentioned as an important reason for the higher coefficient. The only coefficient of expenditures greater than 1 is the coefficient of Mahmut I’s reign. In his time, wars with Iran in the east, with Austria in the west, and with Russia in the north were generally successful: the Belgrade Treaty with Russia and Austria (1739), the Hemedan Treaty and treaty after the Musul War (1746) with Iran. All of these treaties seemed advantageous for Ottomans. There was no military revolt in his sultanate. The Constant in Table 1 represents the autonomous taxes. For the full sample autonomous taxation has a positive coefficient. The 1680-1747 sample was a continuous war period and to finance these wars, the central administration levied extraordinary taxes (Avârız,
Nüzul and Sursat), which became regular in a short time. Three important sources of
revenue were mukataa, cizye and avarız. The highest revenues collected from
mukataa were at the beginning and end of the period because in between war periods
tax reforms of Köprülüzade Fazıl Mustafa Pasha in the 1690s. In the 1683-1700 interval, cizye was collected in advance (generally one year). In the last years of the sample period, cizye revenue retrogressed. The extraordinary tax avârız was increased in war times and decreased in peace times. These movements in taxes can be followed in Figure 1. When we consider all the sultans, the highest autonomous tax was in the sultanate of Mehmet IV, 18.653. After the Vienna siege, temporary or permanent loss of land led to a decrease in mukataa revenues. In the time of Süleymen II, copper coin usage changed the exchange rate of foreign currencies. Then, expectations of instability in the market, Hasses of the Sultan and mukataas were removed from the
iltizam system but in this period the tendency for autonomous taxation was not as high
as for Mehmet IV, only 8.988. In the sultanate of Ahmet II, we saw the tax reform of the Köprülüzade Fazıl Ahmet Pasha. To be able to increase tax revenues, cizye (collected from each household) started to be collected per head, as in the past. In this new system, the criterion was the ability to pay.vii After these sultanates, autonomous taxation started to decrease (Table 1) because from time to time treaties like the Karlowitz Treaty (1699) and the treaty with Russia (1700) were made. In the peace periods, disorders in the mukataa system were dealt with and revenues from mukataas increased, which meant a decrease in the amount of extraordinary taxes. The people living in Tamışvar, Belgrad, and Bosnia were exempted from cizye taxes in 1699-1700.viii All these seem to be effective autonomous taxes in the sultanate of Ahmet III. test results for the analysis are 6.44 for the full sample period. This value of the F-statistics reject the null hypothesis that all the sultanate periods were the same. It can be interpreted that sultans applied different policies in their reigns and each sultan had different characteristics in his time interval.
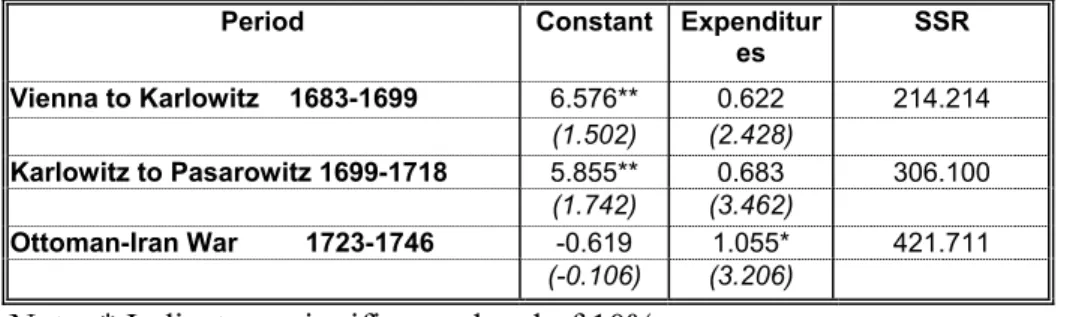
As the discussions above make clear, not the different sultanates but the different war periods were the reason for the fiscal policy action that was taken for the sustainability of budgets. The sample period is divided into three intervals: the Vienna Siege to Karlowitz (1683-1699), Karlowitz to Passarowitz (1699-1718), and the Ottoman-Iran War (1723-1746). This division is based on main characteristics of the war periods. The first interval, Vienna Siege to Karlowitz (1683-1699), was a period of defeat and land losses. The second period, Karlowitz to Passarowitz (1699-1718), was a period of attempts to regain the lost lands, and the third interval was a successful war period in which new lands were gained in the east. After the Vienna siege, the central government levied a new tax, imdadiyye. Initially, this tax was
collected to finance military expenditures in times of emergency and in long lasting war periods. However, in a few decades it became a regular tax collected in various amounts, even in peace periods like from the 1700 peace with Russia to the Ottoman victory in Prut. As in the Tulip period (1706-1729), sometimes there were even excess revenues (see the Figure 1). When the war periods are considered in Table 2, in the first two war periods, the coefficients of expenditures were less than 1: 0.622 and 0.683. The period in which the coefficient of autonomous taxation was below zero is the war period with Iran. There were some fiscal advantages of wars in the east, which can be mentioned as important reasons for the lower autonomous taxes. These advantages can be explained as follow. After defeats in the west, Janissary revolts stared in Rumelia, was easily extended to the capital, Istanbul. These revolts ended with either culus payment or other extraordinary payments made to the Janissaries, which affected the budget deficit sustainability negatively. On the other hand, for any war in the east, such a revolt extending to the capital was not possible. In addition to these, during the Iranian war period in the east, there were sizeable land gains, despite temporary and small land losses, which did not influence either mukataa revenues from the eastern provinces or any other revenues like cizye and avârız. There were not any tax revenue problems in war times in the east. During these wars, in contrast to contrary to the western provinces, there were not any tax-exemptions or delays made by the central government. These are advantageous factors for budget deficit sustainability. The highest coefficient estimated for expenditures is the coefficient of the third war period, the Ottoman-Iran War (1723-1746) in the east, which is 1.055. When we examine the autonomous taxes in the three war periods, we see these coefficients for the three war periods: The estimated coefficients are for Vienna-Karlowitz (1683-1699), 6.576; for Vienna-Karlowitz-Pasarowitz (1699-1718), 5.855; and for the Ottoman-Iran War (1723-1746), -0.619. Among these, the lowest coefficient for the autonomous taxes is -0.619 for the Ottoman-Iranian War period. This interval was a successful time for the Empire because besides victories, many peace treaties were made. In this time, wars with Iran, Austria, and Russia were generally successfull. The Belgrade Treaty with Russia and Austria (1739), the Hemedan Treaty and the treaty after the Musul War (1746) with Iran seemed advantageous for the Empire. The impression gained from the analysis of the war periods is an unsustainable budget deficit that cannot be recovered or mitigated by the short-term deficit sustainability. Moreove, war periods exhibit different characteristics either from both other periods
or each other. The F-test values are 228.993 for the war periods in Table 2 and 294.6077 in Table 3, which are statistically significant.
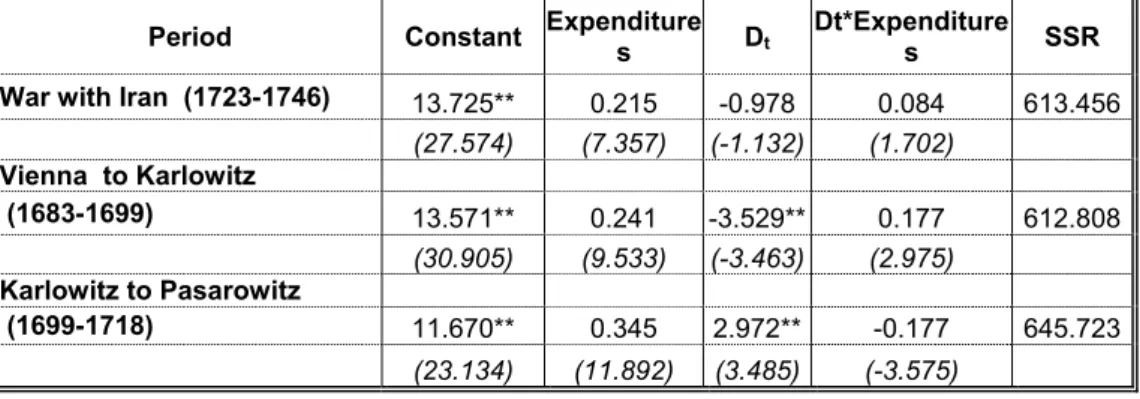
Table 3 summarises the direct comparisons of deficit sustainability and autonomous taxation during war periods. In this regression Dt represents the war
periods and Dt* Expenditurest represents the expenditures made in these war periods.
It is understood from the estimated coefficients of Expenditurest that expenditures
decreased in all of the three war periods. Especially in the Karlowitz-Pasarowitz (1699-1718) period, the estimated coefficient for Expenditurest retrogressed to a
negative value, -0.177. During the Siege process, taxes were collected by the army from the provinces along the road to Vienna. In the next war period, Karlowitz-Pasarowitz (1699-1718), cizye taxes were not collected from some provinces in Rumelia especially Tamışvar, Belgrad, and Bosnia for several years.ix In this period, as mentioned above, revenues from some provinces did not reach the central budget because of the needs of the army during the military expedition. As a result of these, there was a decrease in the coefficient of autonomous taxes from 13.571 in the Vienna-Karlowitz period to 11.670 in the Karlowitz- Pasarowitz period. The lower coefficient of the interval of the war with Iran can be related to the accelerated decentralisation of provinces and local revenues during the war times of the transformation period. Although the autonomous tax for the first two periods were the same, it is lower in the Karlowitz-Pasarowitz period. This was a period in which many lands in Rumelia mutually changed hands with Austria. During these temporary gains and losses, the collection of the revenues was disorderly and autonomous taxes decreased. All these indicated that in war periods, there was a tax income loss while the war expenditures were continuously growing, which is one of the factors that makes the deficit sustainability problem of the Empire more serious in that period.
The empirical evidence elaborated on above suggests that both the Mahmut I era and the Iranian war period had favourable budget management. In order to assess which of these two was the main reason for the favourable environment we estimate the Equation 2 for Iranian war period (1723-1746) by adding a dummy variable for the Mahmut I era. The estimates are reported in Table 4. Note that the induce revenue is 0.697 for the non- Mahmut I era and 1.490 (0.697+ 0.793) for the Mahmut I era. This clearly suggests that Mahmut I, not the Iranian war era provided the sustainable budget. Furthermore, it is interesting to note that autonomous revenue decreased in
Mahmut I era but this might be considered as favourable in the view of the taxpayers relative to for the Ottoman economy as a whole.
Table 5 analyses the connection between culus, the payment made to
Janissaries when a new sultan is crowned, and deficit sustainability. The coefficient
of the constant term for the culus payment period is lower, so there is a decrease in autonomous revenues. These payments seem to worsen the deficit sustainability. However, induced expenditures increase with culus. F-test value of the culus payment dates reported in Table 5 is 9.58, which is statistically significant. It indicates that
culus payments led to changes in the fiscal dynamics of the Empire.
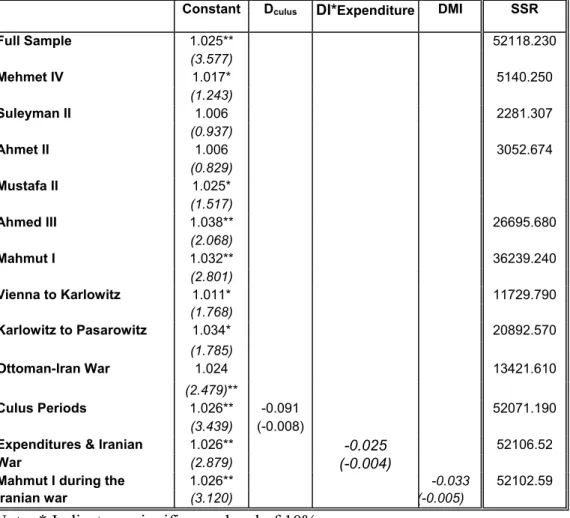
As it was elaborated on earlier in this section, one might argue that budget sustainability cannot be interpreted through the estimated coefficient of Expenditurest,
but that the autonomous taxation should also be taken into account. In order to address this issue, we regress expenditures-revenue ratio on the constant for the full sample as well as the sub-samples used in Tables 1-2, and the dummy variables used in Tables 3-5. Interestingly, all constant terms for these periods are greater than one (Table 6) and none of the estimated coefficients of the dummy variables are statistically significant at the 10% level. This might suggest the sustainability of the budget. However, autonomous taxation is not proportionate to expenditures, so deficit sustainability in the long-run, is in question.
If one considers that the budget was sustainable we consider this with the expenditures-revenue ratio, then the best terms of the periods are associated with the lowest constant and the highest slope terms. Similarly, the worse terms are associated with the highest constant and lowest slope terms.
To sum up, as a result of the evaluation of the regression results, we can argue that a general unsustainable budget deficit dominates in the sample period. The only fiscal recovery in real terms is in the sultanate of Mahmut I.
V. Conclusions
In this paper budget deficit sustainability has been examined during one of the transition periods (1680-1750) of the Ottoman Empire. 1680 was chosen as the starting point because it coincides with the beginning of the decline period of the Empire. Examining this period provided an opportunity to observe the effects of wars, as well as political and fiscal system changes upon the central budget and deficit sustainability.
The empirical evidence gathered in this paper suggests that during the sample period, except for the sultanate era of Mahmut I, the Ottoman budget was not sustainable. The other interesting result of the study is that culus payments have a significant tax increasing effect and the distribution of culus deteriorated the sustainability of the budget.
When we consider the other sultanate eras and war periods, we see the coefficients of expenditures are less than one in Table 1 and Table 2, which underlines the view that serious unsustainable budget deficit problems cannot be eliminated, even with small recoveries and a few sustainable deficit periods. At the end of the sample in 1747, fiscal problems became even more serious. The first foreign debt was undertaken in 1854 and the creditors established a foreign debt management system (Duyun-u Umumiyye) in 1881. Furthermore, the heavy fiscal problems of the Empire remained unsolved, affecting the economy of the new Turkish Republic from the dissolution of the empire to the second half of 1950s. The actual end of the fiscal problems of the empire was 1954, the year in which the young Turkish Republic paid the last instalment of the Empire’s foreign debt.
Figure 1: Revenue and Expenditures of the Ottoman Budget (1680-1747)x 7 7,2 7,4 7,6 7,8 8 8,2 8,4 8,6 8,8 1679 1683 1688 1693 1698 1703 1708 1713 1718 1723 1728 1733 1738 1743 Ye a rs Revenues-Expenditures Revenues Expenditures
TABLE 1: Revenues-Expenditures Relationship for Each Sultan
Sultanate Constant Expenditures SSR Full Sample 1680-1747 1.712* 0.921 1203.5 (0.773) (7.182) Mehmet IV 1648-1687 18.653** -0.093 89.417 (2.12) (-0.179) Süleyman II 1687-1691 8.988** 0.479 50.383 (1.814) (1.656) Ahmet II 1691-1695 9.63** 0.433 51.533 (1.658) (1.262) Mustafa II 1695-1703 8.57** 0.521 77.804 (1.675) (1.739) Ahmet III 1703-1730 7.475** 0.594 344.503 (2.194) (2.984) Mahmut I 1730-1754 -10.887** 1.628* 693.057 (-0.643) (1.717)
Note: * Indicates a significance level of 10%. ** Indicates a significance level of 5%.
t-statistics are reported in parentheses under the corresponding estimated coefficients.
TABLE 2: Revenues-Expenditures Relationship Across Different War Periods
Period Constant Expenditur es SSR Vienna to Karlowitz 1683-1699 6.576** 0.622 214.214 (1.502) (2.428) Karlowitz to Pasarowitz 1699-1718 5.855** 0.683 306.100 (1.742) (3.462) Ottoman-Iran War 1723-1746 -0.619 1.055* 421.711 (-0.106) (3.206)
Note: * Indicates a significance level of 10%. ** Indicates a significance level of 5%.
t-statistics are reported in parentheses under the corresponding estimated coefficients.
TABLE 3: Revenues- Expenditures Relationship for Each Different War Period
Period Constant Expenditures Dt Dt*Expenditures SSR
War with Iran (1723-1746) 13.725** 0.215 -0.978 0.084 613.456
(27.574) (7.357) (-1.132) (1.702) Vienna to Karlowitz (1683-1699) 13.571** 0.241 -3.529** 0.177 612.808 (30.905) (9.533) (-3.463) (2.975) Karlowitz to Pasarowitz (1699-1718) 11.670** 0.345 2.972** -0.177 645.723 (23.134) (11.892) (3.485) (-3.575)
Note: * Indicates a significance level of 10%. ** Indicates a significance level of 5%.
t-statistics are reported in parentheses under the corresponding estimated coefficients.
Table 4: Mahmut I in the Iranian war period
War with Iran
(1723-1746) Constant Expenditures DMahmut-Iran DExpenditures mahmut-Iran* SSR
4.922** 0.697 -13.892** 0.793 986.649
(1.668) (4.120) (-10.050) (9.745)
Note: * Indicates a significance level of 10%. ** Indicates a significance level of 5%.
t-statistics are reported in parentheses under the corresponding estimated coefficients.
Table 5: Revenues-Expenditures Relationship for Culus Period
Full Sample Period
1680-1747 Constant DCt Expenditures DCt* Expenditures SSR
12.844** -2.831** 0.276 0.163 654.369
(30.467) (-1.698) (11.314) (1.708)
Note: * Indicates a significance level of 10%. ** Indicates a significance level of 5%.
t-statistics are reported in parentheses under the corresponding estimated coefficients.
Table 6: Estimation of Budget Sustainability by Using (Revenues/ Expenditures) Ratio
Constant Dculus DI*Expenditure DMI SSR
Full Sample 1.025** 52118.230 (3.577) Mehmet IV 1.017* 5140.250 (1.243) Suleyman II 1.006 2281.307 (0.937) Ahmet II 1.006 3052.674 (0.829) Mustafa II 1.025* (1.517) Ahmed III 1.038** 26695.680 (2.068) Mahmut I 1.032** 36239.240 (2.801) Vienna to Karlowitz 1.011* 11729.790 (1.768) Karlowitz to Pasarowitz 1.034* 20892.570 (1.785) Ottoman-Iran War 1.024 13421.610 (2.479)** Culus Periods 1.026** -0.091 52071.190 (3.439) (-0.008)
Expenditures & Iranian 1.026** -0.025 52106.52
War (2.879) (-0.004)
Mahmut I during the 1.026** -0.033 52102.59
Iranian war (3.120) (-0.005)
Note: * Indicates a significance level of 10% ** Indicates a significance level of 5%
t-statistics are reported in parentheses under the corresponding estimated coefficients
DI: Dummy variable set in the Iranian war era
Referances:
Akgunduz, Ahmed, (1999) 700. Yilinda Bilinmeyen Osmanli, Osmanli Arastirmalari Vakfi, Istanbul.
Barkan, Ö.L., (1960) 1669-70 Ottoman Budget and Its Extensions, Istanbul. ” Mahmut I”, Büyük Larousse, Vol. XV.
Cezar Yavuz, (1986) Osmanli maliyesinde bunalim ve degisim donemi: XVIII.yy'dan
Tanzimat'a mali tarih, Istanbul.
Griffths E., Carter Hill, and George Judge, (1992)Learning and Practicing
Econometrics, Wiley INC.,NewYork, NY.
İnalcık Halil and Quataert Donald, (1994) An Economic and Social History of the
Ottoman Empire, Cambridge University Press.
Marsigli G., (1934) Osmanlı İmparatorluğu’nun Zuhûr ve Terakkisinden İhiatı
Zamanına Kadar Askeri Vaziyeti, Ankara.
Midhat Sertoğlu, (1986)Osmanlı Tarih Lugatı, Enderun Kitabevi İstanbul. Nuri M., (1909)Netâyicu’l-vukûat, Istanbul.
Osmanli Ansiklopedisi: Tarih/Medeniyet/Kultur, Istanbul: Agac, [t.y.].
Quintos, Carmela E., (1995) Sustainability of the Deficit Process with Structural
Shifts, Journal of Business, Economics and Statistics, Oct 95, v. 13, iss 4, pp. 409-17
Özmen Erdal and Koğar İ.Çiğdem, Suatainability of Budget Deficits in Turkey with a
Structural Shif (1998)t, METU Studies in Development, 25 (1), pp. 107-127, Ankara
Pamuk Şevket, 100 soruda Osmanli-Turkiye iktisadi tarihi 1550-1914 (1990), Gercek Yayınlar, Istanbul.
i The data set is reported in the Appendix A.
ii All the Ottoman names and terms written in italic are explained in the Appendix B.
iii Marsigli G., Osmanlı İmparatorluğu’nun Zuhûr ve Terakkisinden İhiatı Zamanına Kadar Askeri
Vaziyeti, pp. 294, Ankara (1934).
iv Nuri M., Netâyicu’l-vukûat, V. II, pp. 88, Istanbul (1909). v One may look at Pamuk (1990) for details
vi Griffths, Hill, and Judge, Learning and Practicing Econometrics, pp.411-424, U.S.A (1992). vii Tabakoğlu, pp 117-119, Istanbul (1985).
viii Tabakoglu, pp. 136-7, Istanbul (1985). ix Müd. 111, pp. 694, 1 113/30, VI,1701.
x Barkan Ö.L., 1669-70 Ottoman Budget and Its Extensions, İÜİF. M.C. XVII, No: 1-4, pp 225-303,
Istanbul (1960).
MM.22249, pp 121-130 1687-88 Budget
Kepeci, 2313; MM22249, pp. 131-136, 1690-91 Budgets
1691-92 Budget, MM the same notebook, pp. 137-149; MM. 12 603 (Budget) 1692-93 Budget MM the same notebook, pp.150-157.
1693-94 Budget MM the same notebook, pp. 158-164 1693-94 Budget MM the same notebook, pp. 38-43
1696-97 Budget MM the same notebook, pp. 44-53; Cevdet, Maliye, 1698-99 Budget MM the same notebook, pp. 54-56, pg 66-79
1700-01 Budget MM the same notebook, pp. 80-105
1701-2 Budget MM the same notebook, pp.106-120, Kepeci, 2324(Budget) 1703-4-5, 1710-11 Budget MM the same notebook, pp.1-37, MM.15 724.
Appendix A: Terms and Concepts∗
Akçe: Ottoman monetary unit based on silver.
Avârız: A tax levied in extraordinary situations, especially in war times. It could be in
cash (Avârız akçesi) or in agricultural products.
Ayan: Local governor. Celali: Tradesman
Cizye A tax collected from the non-Muslims living in the empire on per capita basis. Culus: Payment made to Janissaries when a sultan starts reigning.
Hass: Personal prosperity of the sultan.
Imdadiyye: A tax levied in extraordinary situations. When cash was needed, the tax
was collected from the wealthy people of the Istanbul.
Janissaries: Permanent and horseless army of the Ottoman Empire; the crucial part of
the Kapıkulu soldiers.
Mevacip: A payment made to the Kapikulu soldiers (the main part of the Ottoman
Army which consists of infantry soldiers, Janissaries and soldiers with horse) four times a year in hicri months Muharrem, Rebiulahir, Recep, and Sevval.
Mukataa: A production method that was operated by collecting revenues of the
central administration or taking operational rights of some monopolies (like a mine or minting coins) or being the only purchaser of some producs.
Nüzul: This is an extraordinary tax collected in war times from the cities and villages
along the road of the military expedition. Nüzul was a tax generally based on flour and barley collected per household. The tax could be converted into services needed by the army or cash.
Ruznamce: Notebooks containing daily entries of the imperial budget.
Sürsat: This was an application put into practice especially in war times. It was an
obligation for subjects of the Empire which made them responsible for supplying feed for horses, food and firewood for the army at a determined price. This tax could be collected as cash when needed.
Tımar: In this system, there was no fed army. Instead of agricultural lands are given
to janissaries in order to be cultivated during the times rest of the wars.
Vakıf: Judicial personalities performing for charity.
Appendix B: Budget Revenue
Hicri Years Revenue Expenditures
1090M1 N/A 7482570 1090M2 N/A 45502424 1090M3 N/A 2494295 1090M4 N/A 34720715 1090M5 N/A 72431737 1090M6 N/A 6327625 1090M7 N/A 11540555 1090M8 N/A 59217362 1090M9 N/A 68130606 1090M10 N/A 15796265 1090M11 N/A 40545460 1090M12 N/A 48441321 1091M1 37888570 6064746 1091M2 30962142 53887831 1091M3 15270107 17841748 1091M4 59592517 26313757 1091M5 36473117 49896326 1091M6 7299133 7521112 1091M7 37099649 18436380 1091M8 41388366 75446732 1091M9 87408019 62803789 1091M10 23744083 91517111 1091M11 21711708 44229022 1091M12 18754190 29381167 1092M1 47613856 26800646 1092M2 14676313 6235452 1092M3 20953821 9138308 1092M4 39802867 28500596 1092M5 12818812 42266935 1092M6 56887861 30707696
and Spending of the Empire
Hicri Years Revenue Expenditures
1092M7 9830029 15120899 1092M8 9830029 47393199 1092M9 82838420 31034158 1092M10 20825106 29921465 1092M11 30302883 67334677 1092M12 67022931 100293112 1093M1 40472252 9713435 1093M2 45307959 7442177 1093M3 14604116 49750978 1093M4 20921234 13171376 1093M5 49408388 5076789 1093M6 18566514 49840097 1093M7 41391374 19968668 1093M8 9116450 36909224 1093M9 128185614 71794127 1093M10 17878069 31749415 1093M11 9575474 36285011 1093M12 27998446 89246673 1094M1 17530588 3831131 1094M2 27436265 23478520 1094M3 64506962 59287576 1094M4 63170496 21805202 1094M5 110106470 46127313 1094M6 9694625 9697554 1094M7 2894800 31381120 1094M8 2931729 79255609 1094M9 34677480 30898783 1094M10 6634540 6286318 1094M11 29927094 2934731 1094M12 24747157 9584405
Hicri Years Revenue Expenditures
1095M1 3379077 3555648 1095M2 6081750 60637 1095M3 66636338 92354707 1095M4 55160428 65869404 1095M5 53219003 43790646 1095M6 54716882 33605990 1095M7 17140579 33364089 1095M8 76792035 62759074 1095M9 44422844 30943593 1095M10 56538076 37534385 1095M11 60808234 101821134 1095M12 23981486 19506343 1096M1 59559149 35624382 1096M2 108931705 55609353 1096M3 12258057 43440991 1096M4 11071982 28286134 1096M5 25115625 29734381 1096M6 22041405 57591466 1096M7 36108705 67926590 1096M8 35636055 26409358 1096M9 145150373 104346197 1096M10 5489739 1765640 1096M11 66647759 33960751 1096M12 10824912 18700426 1097M1 41961880 86107695 1097M2 55317557 23751559 1097M3 27987830 42740935 1097M4 73111655 40427701 1097M5 174281526 136696114 1097M6 24347096 13358335
Hicri Years Revenue Expenditures
1097M7 24166551 31513715 1097M8 7740476 12755516 1097M9 14484833 37023256 1097M10 N/A N/A 1097M11 8454614 4645460 1097M12 4697085 39794288 1098M1 21756890 17240139 1098M2 6263087 7636185 1098M3 35324532 14697788 1098M4 2723576 13620518 1098M5 21231978 2587753 1098M6 23955432 147968652 1098M7 51347540 28546689 1098M8 16640653 20973960 1098M9 2759106 8403777 1098M10 N/A N/A 1098M11 12390495 909537 1098M12 1073163 765736 1099M1 190197172 6783627 1099M2 20402771 4844898 1099M3 74114861 128788791 1099M4 38925227 35945150 1099M5 31237951 40182452 1099M6 29024762 15888712 1099M7 26696549 32964361 1099M8 69847800 28892568 1099M9 37444068 24078991 1099M10 124463944 28382095 1099M11 26540414 33192300 1099M12 12695195 152952280
Hicri Years Revenue Expenditures 1100M1 4863289 1925280 1100M2 10988698 17741742 1100M3 48101441 34232817 1100M4 65898141 33681171 1100M5 54852389 29626164 1100M6 49789739 29313589 1100M7 30745668 49167813 1100M8 36466731 48255150 1100M9 36283923 21168351 1100M10 28726957 40994777 1100M11 28726957 14134866 1100M12 15822706 13567456 1101M1 3916921 84237346 1101M2 118889806 8970564 1101M3 25823166 21773076 1101M4 76099616 82850781 1101M5 113684111 87434812 1101M6 52980516 94226779 1101M7 7573425 16350294 1101M8 15528473 16350294 1101M9 30547204 22604931 1101M10 26845447 24091346 1101M11 10153987 6026184 1101M12 1177043 14301323 1102M1 30566338 13079477 1102M2 701320 12516220 1102M3 127971290 23346891 1102M4 19459245 11378514 1102M5 79452219 65393157 1102M6 45067076 32946964 1102M7 50881270 116489164 1102M8 43967700 104590952 1102M9 48237185 52657408
Hicri Years Revenue Expenditures
1102M10 26295622 24381822 1102M11 16295870 66959298 1102M12 9777700 58080621 1103M1 26251236 5610593 1103M2 46622175 62706095 1103M3 63421074 7977671 1103M4 54554429 64355711 1103M5 49908126 25539019 1103M6 33416238 101002020 1103M7 35667404 19279515 1103M8 24092510 32828084 1103M9 135409824 55924630 1103M10 54648649 38257339 1103M11 6548771 2786102 1103M12 5240769 6662661 1104M1 17461171 6639862 1104M2 22661541 35925563 1104M3 23151990 23611725 1104M4 44433259 29186790 1104M5 99610039 91800304 1104M6 90520356 61915432 1104M7 31943853 75622596 1104M8 37879584 4247413 1104M9 36687040 13259684 1104M10 30926163 57258868 1104M11 44404573 44404573 1104M12 4752048 15708826 1105M1 722395 19818721 1105M2 6124224 21428922 1105M3 45372906 33221932 1105M4 52960416 19490846 1105M5 31452823 17929310 1105M6 38103034 10225926
Hicri Years Revenue Expenditures
1105M7 34301913 20531915 1105M8 32034668 60817532 1105M9 31047020 27598431 1105M10 73979976 116482641 1105M11 18973753 7231009 1105M12 2093165 3809120 1106M1 2282231 17380506 1106M2 524766 1625913 1106M3 35329762 39515900 1106M4 44727421 472584 1106M5 41145336 153511372 1106M6 16236156 11904878 1106M7 28759630 13044411 1106M8 67343187 51143334 1106M9 36852242 19765074 1106M10 49365261 13558857 1106M11 90426611 26471401 1106M12 3184398 12850273 1107M1 12981511 57052065 1107M2 7.441E+09 18022201 1107M3 73841495 108692290 1107M4 21702467 5028041 1107M5 106590443 54434814 1107M6 49759098 3785328 1107M7 70562486 23254679 1107M8 50953877 13862384 1107M9 79464639 326534693 1107M10 70505353 53443331 1107M11 47577340 20082346 1107M12 22891884 23740727 1108M1 33181839 29898037 1108M2 12895306 30102963 1108M3 66545143 96570346
Hicri Years Revenue Expenditures
1108M4 46620496 52905843 1108M5 22636255 10237372 1108M6 40174186 24901444 1108M7 64862343 107254840 1108M8 43131371 34701288 1108M9 44635053 25329551 1108M10 133868590 115443958 1108M11 99330284 115443958 1108M12 69514282 56181126 1109M1 40164449 5868211 1109M2 33151235 52627866 1109M3 67559403 39179563 1109M4 50592181 55438362 1109M5 56952425 11661807 1109M6 51019610 96885092 1109M7 49172523 40881323 1109M8 48257890 189821452 1109M9 66555664 24945285 1109M10 48242473 45697969 1109M11 28340824 12153383 1109M12 27915579 58703850 1110M1 25133199 72351570 1110M2 26942155 17399350 1110M3 14147396 11862083 1110M4 23094315 98249878 1110M5 33699217 44952039 1110M6 101920828 6686268 1110M7 62274879 76358975 1110M8 19066548 16390331 1110M9 158077100 83469409 1110M10 N/A N/A 1110M11 29195249 87080780 1110M12 20827484 7055407
Hicri Years Revenue Expenditures 1111M1 14452737 20616427 1111M2 30605726 6330035 1111M3 13319654 22718904 1111M4 22186929 6202637 1111M5 82364075 112616949 1111M6 45768256 12657678 1111M7 41235623 34052386 1111M8 22526536 2223411 1111M9 78253887 88480431 1111M10 70351343 43204071 1111M11 37911834 9592902 1111M12 25992567 9152110 1112M1 47205405 173758528 1112M2 38176986 6762991 1112M3 13154070 167751675 1112M4 20612071 13955216 1112M5 42517972 14771021 1112M6 64973471 74164398 1112M7 46398022 7319237 1112M8 27656512 21925707 1112M9 86410750 102488365 1112M10 49890758 80522551 1112M11 25088952 7147317 1112M12 37846083 4731545 1113M1 24601021 13070551 1113M2 28181306 3993522 1113M3 27395382 7570168 1113M4 13422016 8873414 1113M5 53754496 5535525 1113M6 58616841 54622810 1113M7 23822061 9854155 1113M8 34340699 74969196 1113M9 103156578 161114811
Hicri Years Revenue Expenditures
1113M10 26674421 21577843 1113M11 47094133 90167487 1113M12 17066346 15823351 1114M1 13568192 31744381 1114M2 7150781 6294422 1114M3 18067164 20151487 1114M4 9476200 39662237 1114M5 2954864 1567590 1114M6 98043132 59442821 1114M7 42104704 87163918 1114M8 46230073 71750831 1114M9 135139029 98831219 1114M10 25358067 3535654 1114M11 47507907 46322033 1114M12 28492048 96531695 1115M1 10499956 9057601 1115M2 20611781 5397280 1115M3 39166831 17103265 1115M4 213415413 71183475 1115M5 83469691 47800473 1115M6 146806302 222713382 1115M7 63732688 154474551 1115M8 36845629 37694196 1115M9 240680077 65754803 1115M10 20817720 242998582 1115M11 28085570 20480226 1115M12 23442948 36729191 1116M1 11162032 5910066 1116M2 7596324 7835821 1116M3 41464685 34516640 1116M4 35805619 3351886 1116M5 76031970 6818953 1116M6 111687083 132857783
Hicri Years Revenue Expenditures
1116M7 47412155 24754539 1116M8 66912008 29588910 1116M9 108098799 199142828 1116M10 16660885 131618473 1116M11 11596949 3997608 1116M12 11853634 15088247 1117M1 12115276 26013763 1117M2 7346551 5255566 1117M3 9020616 6040389 1117M4 46874159 1121972 1117M5 79723331 14173554 1117M6 81754560 129956536 1117M7 16468183 85659003 1117M8 52914023 6095619 1117M9 159665238 127572787 1117M10 17851281 4231778 1117M11 15210347 10462752 1117M12 14030888 105633423 1118M1 31839411 7424433 1118M2 11296185 33472866 1118M3 6915283 6988429 1118M4 20479637 7331642 1118M5 24360202 504477 1118M6 139429101 2024503 1118M7 43170389 193092876 1118M8 36527400 8858702 1118M9 176995317 187099347 1118M10 32474758 10276369 1118M11 32718302 31046210 1118M12 64336680 8245588 1119M1 43109819 12290032 1119M2 32462213 19922468 1119M3 5685213 2947049
Hicri Years Revenue Expenditures
1119M4 32715105 2178077 1119M5 20951220 4286819 1119M6 54567721 88211085 1119M7 55360056 1658493 1119M8 39847707 9789881 1119M9 144458719 108942505 1119M10 42209301 2088531 1119M11 32026002 77817804 1119M12 70115088 1199335 1120M1 34296671 1706651 1120M2 26216463 87577319 1120M3 36623960 13707896 1120M4 69560676 4469785 1120M5 78188704 649511 1120M6 67234323 3291691 1120M7 35752414 1151705 1120M8 87953324 94778700 1120M9 96220271 2390391 1120M10 19548457 2812799 1120M11 48696907 195532375 1120M12 71444255 1107961 1121M1 49062855 3990068 1121M2 21917880 89651159 1121M3 53057142 7129937 1121M4 34427563 6949014 1121M5 51230660 6287204 1121M6 65346243 6095931 1121M7 10828948 6253702 1121M8 33864099 96299551 1121M9 93402169 8437756 1121M10 31231678 2288184 1121M11 21884369 198969195 1121M12 49507694 6369529
Hicri Years Revenue Expenditures 1122M1 26292632 4535925 1122M2 27737638 28582604 1122M3 27324552 91206425 1122M4 17803002 11290843 1122M5 26734205 8744548 1122M6 39791185 90930386 1122M7 26249707 6709068 1122M8 26520062 7749425 1122M9 80432665 6676155 1122M10 26015667 197083490 1122M11 21845512 27673168 1122M12 38237742 15079212 1123M1 102992068 64589416 1123M2 24351585 104828298 1123M3 17025252 119431373 1123M4 12080481 67526651 1123M5 6407250 59260049 1123M6 10115364 16565621 1123M7 67441243 72227220 1123M8 31209714 30967761 1123M9 134640284 258409930 1123M10 20350072 10617529 1123M11 15108574 78582254 1123M12 40011561 10903167 1124M1 103864699 22899600 1124M2 49952599 51217213 1124M3 69978482 129232504 1124M4 46335347 9559950 1124M5 66677159 54392382 1124M6 34455482 3795666 1124M7 27646940 128206159 1124M8 54289401 3912895 1124M9 178006181 4840229
Hicri Years Revenue Expenditures
1124M10 104146746 109449431 1124M11 26634750 261168579 1124M12 56616602 18762940 1125M1 20477979 13085628 1125M2 59202325 59008612 1125M3 9009240 24321270 1125M4 8745736 16558032 1125M5 120926939 73768449 1125M6 62219505 21406157 1125M7 51797060 8243734 1125M8 41510977 6163650 1125M9 257964924 316080831 1125M10 30134040 80643040 1125M11 45194329 30017751 1125M12 120411718 65859070 1126M1 89726510 18987716 1126M2 36661624 118630632 1126M3 94538276 25815278 1126M4 70579147 58147776 1126M5 110925251 47972377 1126M6 112034006 19228757 1126M7 55978170 137150376 1126M8 106133937 42685421 1126M9 153340504 221122203 1126M10 84582582 30715020 1126M11 76724343 19671093 1126M12 72077831 75794137 1127M1 60514582 39167438 1127M2 57872542 35404257 1127M3 45373089 46820199 1127M4 164045477 175322377 1127M5 6138024 53362710 1127M6 4459477 12807057
Hicri Years Revenue Expenditures
1127M7 4825054 29089304 1127M8 6752269 12232427 1127M9 12492487 186621664 1127M10 284562925 28930402 1127M11 43637520 11828940 1127M12 175069594 13740924 1128M1 116299265 28148930 1128M2 103561797 55839459 1128M3 139532830 449848126 1128M4 146443624 167304245 1128M5 24345195 76197682 1128M6 72692659 23508469 1128M7 24775995 35659239 1128M8 23821186 77857778 1128M9 20039352 42690008 1128M10 133648654 87849917 1128M11 191525829 104166723 1128M12 76142532 62756041 1129M1 78456336 288257493 1129M2 37117876 19088517 1129M3 59668793 36931242 1129M4 72165698 17359117 1129M5 107245901 56340083 1129M6 96603054 95517249 1129M7 21479012 241128612 1129M8 8301680 39900648 1129M9 16800131 31949467 1129M10 701319 28831440 1129M11 103485087 5176206 1129M12 91783599 92633843 1130M1 62542089 77389328 1130M2 138885574 50487948 1130M3 96702447 162470302
Hicri Years Revenue Expenditures
1130M4 91538087 114128121 1130M5 124846284 122094049 1130M6 48711252 19113372 1130M7 41575545 5981092 1130M8 47041827 135085863 1130M9 44290835 4198862 1130M10 76670810 4712117 1130M11 40234142 11197328 1130M12 82829114 70271834 1131M1 42474001 27846179 1131M2 46168289 8646145 1131M3 35410290 134858598 1131M4 32947206 24451046 1131M5 63167075 79332403 1131M6 157330564 126039656 1131M7 81502886 159739960 1131M8 97504588 115772301 1131M9 66598296 2013663 1131M10 46738599 9184615 1131M11 38860059 5704169 1131M12 55743818 41787744 1132M1 38985527 5444409 1132M2 25969679 12191131 1132M3 108685526 114927506 1132M4 10432401 8302074 1132M5 68940495 N/A 1132M6 56363988 N/A 1132M7 60708252 N/A 1132M8 139878734 N/A 1132M9 23078521 N/A 1132M10 57108697 929432 1132M11 46179034 1302150 1132M12 89797727 N/A
Hicri Years Revenue Expenditures 1133M1 39132851 4546291 1133M2 42410415 3793068 1133M3 40001629 219659036 1133M4 56738848 2701315 1133M5 74153910 5239080 1133M6 32602848 116093536 1133M7 65289820 11701594 1133M8 113880563 16607290 1133M9 38438347 12707037 1133M10 57185249 16112464 1133M11 27484228 112247869 1133M12 86502235 9679794 1134M1 49292192 3399513 1134M2 119488749 213316153 1134M3 61895508 4866528 1134M4 82134816 4910310 1134M5 86717160 6099734 1134M6 42780394 120057789 1134M7 66620423 9057014 1134M8 98578735 6222787 1134M9 23316331 3154957 1134M10 39048746 17108989 1134M11 68269328 16627379 1134M12 90137115 129154645 1135M1 55765551 4547254 1135M2 23835475 208731710 1135M3 74022249 5352957 1135M4 114429703 109504030 1135M5 37632237 10513505 1135M6 42812708 25502641 1135M7 47530190 18107469 1135M8 148909946 106884255 1135M9 44736892 14812119
Hicri Years Revenue Expenditures
1135M10 38423776 27730093 1135M11 57860375 30738642 1135M12 63341037 4604500 1136M1 54442725 227083027 1136M2 48319462 11170418 1136M3 49697175 102801021 1136M4 88008324 31577536 1136M5 54397797 75264456 1136M6 28371770 28242550 1136M7 49394558 9296922 1136M8 125587636 27657658 1136M9 12686786 3801504 1136M10 17588535 12073620 1136M11 44931159 145550039 1136M12 59357129 47568295 1137M1 72630980 15475142 1137M2 42805120 28008459 1137M3 31628295 7958393 1137M4 56327744 202899995 1137M5 55391000 49875067 1137M6 23342106 132920759 1137M7 105329599 79945884 1137M8 136551820 18042657 1137M9 25548283 51755568 1137M10 32312279 52678348 1137M11 34205436 59490833 1137M12 73749066 113193787 1138M1 38873349 10387104 1138M2 31925951 15097777 1138M3 24450190 8139772 1138M4 65028552 228109038 1138M5 54197030 6901386 1138M6 19858167 20279923
Hicri Years Revenue Expenditures
1138M7 159742586 139690920 1138M8 160366634 81518911 1138M9 23853582 118639981 1138M10 19315057 25980099 1138M11 50578743 23629754 1138M12 167850661 196801087 1139M1 58155584 34801127 1139M2 51687970 21100815 1139M3 14874525 35175824 1139M4 65793193 16560265 1139M5 49895289 207710731 1139M6 104512139 29613436 1139M7 191174511 304882925 1139M8 29397238 6724169 1139M9 53856343 26210154 1139M10 33393983 154091826 1139M11 79112178 52190528 1139M12 64111799 99885973 1140M1 17087834 15083700 1140M2 68708752 19526057 1140M3 48394334 93820162 1140M4 16004744 187718243 1140M5 12825195 11026372 1140M6 36979795 6634538 1140M7 189626119 9350065 1140M8 24545494 107471195 1140M9 18168155 5600734 1140M10 52571691 16701886 1140M11 52571691 18534168 1140M12 59423725 108109564 1141M1 85238470 78728438 1141M2 27532590 51367234 1141M3 28446052 17844006
Hicri Years Revenue Expenditures
1141M4 109241494 70513361 1141M5 56616385 15750070 1141M6 95245826 426954523 1141M7 71056997 16826431 1141M8 263643576 242724193 1141M9 24069078 6922419 1141M10 30409084 15744402 1141M11 100360508 18738709 1141M12 89441008 7664554 1142M1 79903126 4300585 1142M2 49273268 114900998 1142M3 63292641 13269668 1142M4 92700383 21198665 1142M5 92575607 112313785 1142M6 8896145 4464830 1142M7 54177124 5019490 1142M8 127833052 240683290 1142M9 20182374 10248263 1142M10 31060427 49792370 1142M11 56150364 11928503 1142M12 101077681 68101079 1143M1 101442250 151168971 1143M2 23360305 17946889 1143M3 27222466 88543502 1143M4 44215957 23439385 1143M5 43480728 44070205 1143M6 133482341 64521809 1143M7 1.426E+09 1.585E+09 1143M8 369575359 551290496 1143M9 71009086 37952223 1143M10 43994670 58745750 1143M11 91507868 165227880 1143M12 115315981 78761287
Hicri Years Revenue Expenditures 1144M1 78190578 76657756 1144M2 30826430 266208564 1144M3 378269896 195053212 1144M4 80160488 48329602 1144M5 79454045 200251399 1144M6 35556479 39041264 1144M7 32271576 93278217 1144M8 432485796 368855770 1144M9 53328051 69830819 1144M10 20671793 32416259 1144M11 283877438 158002544 1144M12 145432412 158253886 1145M1 199773979 69202528 1145M2 46354222 49032613 1145M3 57538107 254806621 1145M4 48119366 63674944 1145M5 76623864 191702114 1145M6 161820499 196657142 1145M7 42500671 56802298 1145M8 365382934 214292712 1145M9 70033643 382554215 1145M10 51716888 50302944 1145M11 97188217 75726080 1145M12 81762427 34459951 1146M1 90510171 22232699 1146M2 73567872 94872930 1146M3 71218920 216126029 1146M4 122434839 84843420 1146M5 105839377 171502692 1146M6 117710132 127726360 1146M7 123604382 95639664 1146M8 208414667 322444435 1146M9 177061513 89644666
Hicri Years Revenue Expenditures
1146M10 72764683 66984122 1146M11 67152232 34225248 1146M12 136863202 50865832 1147M1 92981820 189487238 1147M2 27962951 24284139 1147M3 43684659 68279286 1147M4 140546694 76020042 1147M5 110501710 7429270 1147M6 118408097 231311230 1147M7 94901093 30329391 1147M8 253276771 63435624 1147M9 40044856 49249879 1147M10 71453114 119199022 1147M11 27639669 25488077 1147M12 54128455 279776625 1148M1 99546061 27590351 1148M2 159964081 147596974 1148M3 117408911 97656560 1148M4 67645488 192397693 1148M5 49723424 3301908 1148M6 94520495 26822455 1148M7 89246735 168700577 1148M8 228564968 316728321 1148M9 22951189 3752093 1148M10 27791433 1795398 1148M11 40085545 5033495 1148M12 75141965 6075399 1149M1 43278908 162234974 1149M2 111001201 33258915 1149M3 73892372 26925978 1149M4 33868871 36255663 1149M5 23294677 9142730 1149M6 116562575 106474140
Hicri Years Revenue Expenditures
1149M7 186322562 154565899 1149M8 18055107 2593797 1149M9 31649601 179449560 1149M10 14542914 26619135 1149M11 31176804 31825027 1149M12 399660698 346086122 1150M1 50118596 51485883 1150M2 24292012 26570178 1150M3 85976608 65132581 1150M4 28270400 47503849 1150M5 147469298 125261711 1150M6 62432251 63967025 1150M7 69948225 23438585 1150M8 205477971 55668126 1150M9 104129988 31875659 1150M10 281534331 125101352 1150M11 235538180 170432404 1150M12 75212915 21436185 1151M1 56056888 48928731 1151M2 32364438 40535490 1151M3 38257879 36411453 1151M4 29357936 47580125 1151M5 24704272 23192973 1151M6 137198033 36337987 1151M7 292923733 62571120 1151M8 124961001 35859827 1151M9 103088130 68993940 1151M10 80995723 71843353 1151M11 204711241 47538222 1151M12 111744883 49374495 1152M1 81102396 251682552 1152M2 97799535 36707915 1152M3 39558631 1.011E+09
Hicri Years Revenue Expenditures
1152M4 6248543 36877033 1152M5 44744168 21760778 1152M6 58050948 47162832 1152M7 64910195 307157581 1152M8 269717814 5849812 1152M9 82259527 6494908 1152M10 84065839 63837900 1152M11 66599088 437344775 1152M12 29142962 21723115 1153M1 120748815 6160565 1153M2 128742688 19149674 1153M3 61070306 57045378 1153M4 17260499 7673858 1153M5 60349923 4731274 1153M6 102627134 216160295 1153M7 152730527 25210861 1153M8 292786753 235764632 1153M9 39905698 17037676 1153M10 46706109 787719120 1153M11 35292263 31841534 1153M12 51218172 6078875 1154M1 108366166 93555077 1154M2 148715017 205665493 1154M3 57283701 13146385 1154M4 38636107 5586590 1154M5 111398799 3742793 1154M6 132175435 127362931 1154M7 233436601 198758966 1154M8 479617872 32606246 1154M9 44703520 29855466 1154M10 16964148 11446585 1154M11 36643073 24006798 1154M12 9140932 3145985
Hicri Years Revenue Expenditures 1155M1 70394879 353739503 1155M2 267199365 185567116 1155M3 440126627 441027968 1155M4 221397752 137253090 1155M5 91456888 114376642 1155M6 112377597 44376063 1155M7 107194827 53993719 1155M8 236193874 184911546 1155M9 28271689 1639410 1155M10 62591189 59207922 1155M11 15202513 506669 1155M12 21885214 444849849 1156M1 19420548 24890900 1156M2 228330611 96677556 1156M3 74922803 34873243 1156M4 60535099 48913424
Hicri Years Revenue Expenditures
1156M5 86859409 62195365 1156M6 146646532 242661456 1156M7 141697818 70912026 1156M8 318115778 299971129 1156M9 69694942 18047966 1156M10 128169934 78460348 1156M11 122806960 97935768 1156M12 10771387 405198778 1157M1 121200373 147782322 1157M2 187225770 34011472 1157M3 29553949 13693413 1157M4 55600229 44635624 1157M5 119719185 236631705 1157M6 126185351 52132139 1157M7 116828570 192156844 1157M8 220602459 32453372
Hicri Years Revenue Expenditures
1157M9 88553154 55862269 1157M10 27521987 12651771 1157M11 54322067 42050021 1157M12 120994411 482175708 1158M1 69928206 52201026 1158M2 187687309 48307252 1158M3 96562593 231449479 1158M4 40396058 49941068 1158M5 98980930 42671970 1158M6 158400025 212889286 1158M7 179428818 54540656 1158M8 286184709 357376442 1158M9 51750584 34069487 1158M10 22609669 4488088 1158M11 27074040 11567130 1158M12 56381434 10956352
Hicri Years Revenue Expenditures
1159M1 33530604 5483618 1159M2 67265870 186632980 1159M3 N/A 80196992 1159M4 N/A 10817306 1159M5 N/A 44289200 1159M6 N/A 2626908 1159M7 N/A 200401986 1159M8 N/A 28842541 1159M9 N/A 432621740 1159M10 N/A 11647288 1159M11 N/A 2904309 1159M12 N/A 1442545