Modeling Urban Structures Using
Graph-Based Spatial Patterns
Emel Do˘grus¨oz and Selim Aksoy
Department of Computer EngineeringBilkent University Bilkent, 06800, Ankara, Turkey {emelkaya,saksoy}@cs.bilkent.edu.tr
Abstract—We introduce a new method for modeling the spatial arrangements of geospatial objects. As opposed to the existing approaches that are based on classifying images using pixel level methods, we propose to use objects as textural primitives and exploit their spatial patterns. First, the primitives are detected us-ing spectral and morphological processus-ing. Then, these primitives form the nodes of a graph where the neighborhood information is obtained through Voronoi tessellation of the image scene. Next, this graph is clustered by thresholding its minimum spanning tree. Finally, the resulting clusters are classified as regular or irregular by examining the distributions of the angles between neighboring nodes. Experiments using Ikonos images show that the application of the proposed model where buildings are used as the primitives and building groups are automatically classified as organized or unorganized can extract valuable information about urban development.
I. INTRODUCTION
Remotely sensed imagery is a critical resource for urban planning, development, and monitoring applications. Although there is no exact definition for urbanization, most of the previous work characterize areas using the density of buildings [1]. This characterization is quite important in applications such as urban growth and change detection studies because fast growing cities often face the problem of unorganized urban growth, even illegal expansion that causes the destruction of green areas and has severe negative effects on environment.
Automatic detection of geospatial objects and modeling of urban structures necessitate position, scale and rotation invariant modeling techniques. Most of the previous work on modeling urbanization concentrate on pixel-based clas-sification of land cover/use. However, pixel level analysis cannot capture the detailed content and often produces noisy results. Textural features have been used as an alternative to model spatial information in neighborhoods of pixels [1], [2]. Statistics of line segments within windows were also used to classify images as rural, residential or urban without detecting any objects such as buildings [3]. In [4], we used individual buildings as textural primitives, and computed co-occurrence-based spatial domain features and Fourier spectrum-co-occurrence-based frequency domain features to model their repetitiveness and periodicity at particular orientations to classify neighborhoods as organized (regular) and unorganized (irregular).
This work was supported in part by the TUBITAK CAREER Grant 104E074 and European Commission Sixth Framework Programme Marie Curie International Reintegration Grant MIRG-CT-2005-017504.
(a) Regular (highly organized) (b) Irregular (unorganized) Fig. 1. Examples of building patterns.
In this work, we propose a structural technique for modeling high-level geospatial objects and their neighborhoods in an urban setting. The approach starts with the detection of urban primitives (e.g., buildings). Then, the neighborhoods are mod-eled in terms of the spatial arrangements of these primitives. This is achieved using a graph-based model that clusters the primitives into groups with similar spatial arrangements. This representation can be viewed as a “generalized texture” model where the image elements of interest are urban primitives instead of the traditional case of pixels. The grouping phase can be modeled as a structural pattern recognition problem that uses graph-based representations and clustering techniques.
We illustrate the proposed approach in the problem of measuring the level of urbanization according to spatial build-ing patterns where the graph nodes correspond to individual buildings, and the clusters in the graph correspond to building groups with similar arrangements. The spatial arrangements we are interested in correspond to regular patterns and irreg-ular patterns that represent highly organized and unorganized neighborhoods, respectively, as shown in Figure 1. The former represents urban areas that undergo planned land development whereas the latter corresponds to areas that are affected by illegal expansion mostly due to immigration.
The rest of the paper is organized as follows. Section II describes building detection. Section III presents the graph-theoretic modeling of building patterns. Section IV discusses labeling of graph regions as organized/unorganized. Section V presents performance evaluation using four Ikonos scenes of Ankara, Turkey. Finally, Section VI provides a summary.
(a) Pan-sharpened RGB bands
(b) Detected buildings using RGB bands
(c) Detected buildings using RGB bands and Gabor features Fig. 2. Multi-spectral bands of an example scene and the binary classification maps of buildings. Even though the error rate is lower when Gabor features are added (using pixel-based ground truth), individual buildings can be isolated better when only RGB bands are used. (Results are shown before morphological cleaning.)
II. BUILDINGDETECTION
Techniques that are specifically designed for detection of buildings can be found in the literature [5]. Our goal in this work is to evaluate measures of arrangements of buildings so we developed a simple detector for individual buildings. This detector uses a two-class Gaussian classifier trained on the pan-sharpened RGB bands of Ikonos images (near-infrared band was not available). Manually labeled pixels for buildings are used to train the target class and examples for roads, vegetation, soil, etc. are used for the non-building class.
The resulting classification can have some false positives especially along some roads and soil areas because of the similarities in RGB values. We clean noisy pixels in the back-ground and fill small holes inside the buildings using morpho-logical operations. We also compute the distance transform, suppress insignificant local minima, and apply the watershed transform to separate buildings as individual regions if they are touching each other after classification. These individual buildings are used as texture primitives in the rest of the work. We have also experimented with more complex features based on Gabor texture filters and morphological profiles, but did not get an improvement in the results. Details of these experiments are described in Section V. Even though for some feature combinations, the overall error rate is smaller than the one for RGB features, visual examination of the classification maps shows that error rates do not always reflect the visual quality of the results as shown in Figure 2. This also supports our belief that high success rates achieved using based classification methods and limited pixel-based ground truth do not present semantically satisfactory performance, and more powerful structural models are needed for further improvements.
III. GRAPH-THEORETICSCENEMODEL
In the literature, dividing images into non-overlapping sub-windows and analyzing the individual sub-sub-windows has been the common approach used for image partitioning [3], [4], [6]. Such partitions assume that the window contents have uniform feature distributions. However, it is often difficult to select a window size that is small enough to have uniform content
but is large enough to cover complex geospatial structures. Hence, window-based modeling cannot handle geospatial ob-jects at multiple scales. In this work, we propose a graph-theoretic image partitioning technique that captures the spatial arrangements of objects (which cannot be done by histogram or summary-statistics-based analysis) and that is successful even for image regions containing different types of objects (e.g., multiple buildings).
The scene model involves the construction of a graph-based representation where the graph nodes correspond to the primitives and edges model their spatial arrangements. First, neighboring primitives are found using the Voronoi tessellation corresponding to the primitive centroids. An edge is created between two nodes if they are assigned as neighbors in this decomposition. In the related literature on graph-based pattern proximity analysis, the distance between nodes (e.g., buildings) is compared to a threshold that is used to define the edges. Such approaches may be successful in some specific applications where distance between the primitives is almost constant and can give sufficient information about their spatial proximity. However, such thresholds are scale dependent and can produce poor results in modeling the spatial arrangement in applications that involve high amount of variations in terms of the structures of the primitives and the relationships between these structures.
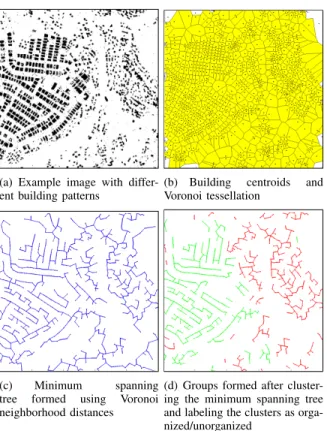
After finding the neighbors of each primitive, the goal is to group these primitives into clusters so that they can be automatically classified as regular or irregular. Voronoi tessellation of primitives can assign some nodes that are considerably distant from each other as neighbors, and this is not a desired property in analyzing the relationships of neighboring primitives. Therefore, to determine the most im-portant neighbors of each primitive, the minimum spanning tree of the graph is constructed using the distances of Voronoi neighbors. This way, in the minimum spanning tree, a node is connected to its most important and most related neighbors and its relationship with the far away neighbors can be ignored (Figure 3 illustrates the steps in graph construction).
To cluster the primitives into groups, some edges of the minimum spanning tree should be removed. The edges that are removed are selected as the ones that are at least 50% longer than the average edge length in the minimum spanning tree. (The threshold was selected empirically after a search procedure using the ground truth described in Section V.) As a result, such long edges are removed and nodes that are spatially close enough remain in the same cluster.
IV. LABELINGGRAPHREGIONS
The spatial arrangements of interest in this paper are the organization of buildings. After the graph representing the scene is formed and the clusters of buildings are found, the next step is the classification of these clusters as organized (regular) or unorganized (irregular). As illustrated in Figure 3, in organized neighborhoods, buildings are mostly aligned linearly or they have a regular grid-like arrangement. Conse-quently, when the angles between buildings in a cluster are
(a) Example image with differ-ent building patterns
(b) Building centroids and Voronoi tessellation
(c) Minimum spanning tree formed using Voronoi neighborhood distances
(d) Groups formed after cluster-ing the minimum spanncluster-ing tree and labeling the clusters as orga-nized/unorganized
Fig. 3. Phases of graph construction, clustering, and labeling (nodes labeled as organized and unorganized are shown in green and red, respectively).
examined, it can be seen that in organized neighborhoods the angle distribution has peaks around 90 and 180 degrees, whereas for irregularly aligned areas (where there is no specific arrangement of primitives), random angle distributions are observed with no considerable peaks. Therefore, the angles between connected nodes of a cluster are computed (three nodes are used for each angle) and a histogram of these angles are formed for each cluster. Then, a cluster is labeled as organized if in its histogram the count of angles in the two bins including 90 and 180 degrees is greater than the total count of angles in the rest of the bins. Note that, the measures used for both clustering and labeling are scale and rotation invariant because neighborhoods are computed from Voronoi tessellations and relative angles are computed between these neighbors, respectively.
V. EXPERIMENTS
Four scenes (2, 000 × 2, 000 pixels each) of pan-sharpened RGB bands of 1 m spatial resolution Ikonos images of Ankara, Turkey were used to evaluate the proposed algorithm. Detailed results are given below.
A. Evaluation of building detection
Two separate sets of pixels were manually labeled as build-ings vs. others to form independent training and test data for evaluating building detection. Different combinations of spec-tral (RGB) features, Gabor texture features, and morphological profile features were considered. Table I summarizes the error rates obtained using different features with a quadratic
TABLE I
ERROR RATES FOR DIFFERENT FEATURE COMBINATIONS FOR BUILDING DETECTION(BEFORE MORPHOLOGICAL POST-PROCESSING). APPROXIMATELY2MILLION PIXELS WERE USED AS TEST DATA.
Feature Code Used Features Error (%)
F1 RGB 5.43
F2 Low frequency Gabor features 13.91 F3 High frequency Gabor features 15.47
F4 F2 + F3 15.05
F5 Morphological opening profile 10.15 F6 Morphological closing profile 18.82
F7 F5 + F6 11.10 F8 F1 + F2 4.56 F9 F1 + F3 5.24 F10 F1 + F2 + F3 5.45 F11 F1 + F5 6.84 F12 F1 + F6 6.48 F13 F1 + F5 + F6 7.44 F14 F1 + F2 + F3 + F5 + F6 6.60
Gaussian classifier. Other classifiers were also considered but quadratic Gaussian was both efficient and accurate.
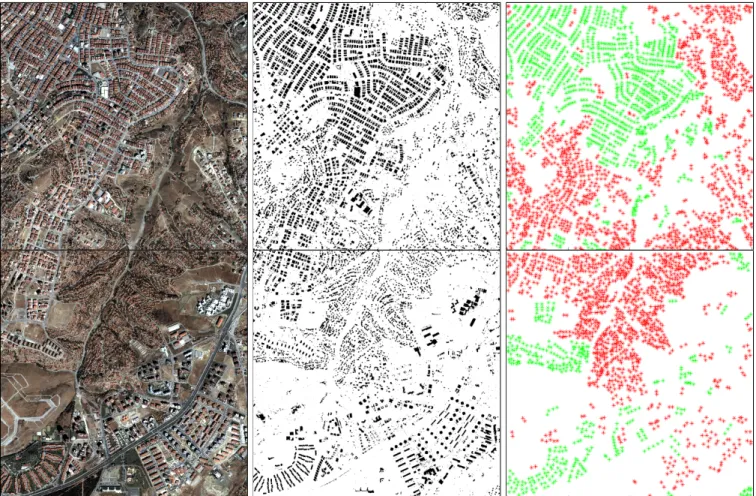
Even though the error rates for several feature combinations (e.g., F8 and F9) were smaller than the rates for others (e.g., F1), visual examination of the results showed that the error rates for pixel level ground truth did not always reflect the visual quality of the results. We decided to use the RGB fea-tures that achieved a small error rate and a successful detection of individual buildings. Examples of detected buildings are shown in Figure 4.
B. Evaluation of scene labeling
To evaluate the performance of labeling building groups as organized or unorganized, first, neighborhood masks were manually generated for all test images. Then, given all labels resulting from the procedure described in Section IV, the labels of buildings are compared to the ground truth to check whether a building automatically labeled as belonging to an organized/unorganized neighborhood is inside a mask manually labeled as organized/unorganized. Table II shows the resulting confusion matrix (success rate was 82.82%).
Example classification results are given in Figure 4. It can be seen that most of the buildings were correctly labeled. Large organized groups were found in the upper part of the first image and lower left part of the second image. Many unorganized building groups were also classified correctly. Some organized building groups in the lower left part of the first image and the upper left part of the second image were wrongly labeled as unorganized. Most of the errors were caused by the limitations of the graph clustering procedure using the minimum spanning tree. Since the only edge weight used to construct the minimum spanning tree and the subse-quent clustering was the distance between neighboring nodes (buildings), some unorganized components that are too close to organized components affected the latter during clustering. Future work will include designing additional edge weights that can model neighborhood information more accurately and also incorporating road information that can help with the definition of a neighborhood.
Fig. 4. Example classification results for two 2, 000 × 2, 000 Ikonos scenes. The left, middle and right columns show the original data, the detected buildings, and the results of classification, respectively. Buildings belonging to neighborhoods classified as organized are shown as green and buildings in unorganized neighborhoods are shown in red.
TABLE II
CONFUSION MATRIX FOR LABELING NEIGHBORHOODS AS ORGANIZED/UNORGANIZED. ERROR IS COMPUTED BY COUNTING THE MISMATCHES BETWEEN THE AUTOMATIC LABELING OF BUILDINGS AND
THE MANUAL NEIGHBORHOOD MASKS. Detected
TotalAccuracy organized unorganized (%) Trueunorganizedorganized 2,229888 4,454498 2,7275,342 81.7483.38
Total 3,117 4,952 8,069 82.82
VI. SUMMARY
We described a new graph-theoretic method for analyzing land development in high-resolution satellite imagery in terms of spatial arrangements of buildings. Buildings are detected us-ing spectral classification and morphological post-processus-ing. These buildings form the nodes of a graph where the edges are constructed using the Voronoi tessellation of the scene. Building groups are formed by thresholding the minimum spanning tree of this graph. These groups are classified as organized or unorganized by examining the distributions of the angles between neighboring nodes of the clusters.
We will incorporate new properties of building groups into the graph to improve the clustering stage and will also
introduce new primitives such as roads and vegetation to extend the graph-theoretic model to new urban classification applications. We believe that such models will provide a significant contribution toward automatic semantic analysis of remote sensing images, and will enable new results in urban planning, development, monitoring, and change detection.
REFERENCES
[1] V. Karathanassi, C. Iossifidis, and D. Rokos, “A texture-based classi-fication method for classifying built areas according to their density,” International Journal of Remote Sensing, vol. 21, no. 9, pp. 1807–1823, September 2000.
[2] S. Bhagavathy and B. S. Manjunath, “Modeling and detection of geospa-tial objects using texture motifs,” IEEE Transactions on Geoscience and Remote Sensing, 2007, (to appear).
[3] C. Unsalan and K. L. Boyer, “A theoretical and experimental investigation of graph theoretical measures for land development in satellite imagery,” IEEE Transactions on Pattern Analysis and Machine Intelligence, vol. 27, no. 4, pp. 575–589, April 2005.
[4] S. Aksoy and E. Dogrusoz, “Modeling urbanization using spatial building patterns,” in Proceedings of 4th IAPR International Workshop on Pattern Recognition in Remote Sensing, Hong Kong, August 20, 2006. [5] H. Mayer, “Automatic object extraction from aerial imagery — a survey
focusing on buildings,” Computer Vision and Image Understanding, vol. 74, no. 2, pp. 138–149, May 1999.
[6] S. Bhagavathy, “Modeling and detection of geospatial objects using tex-ture motifs,” Ph.D. dissertation, University of California, Santa Barbara, CA, December 2005.