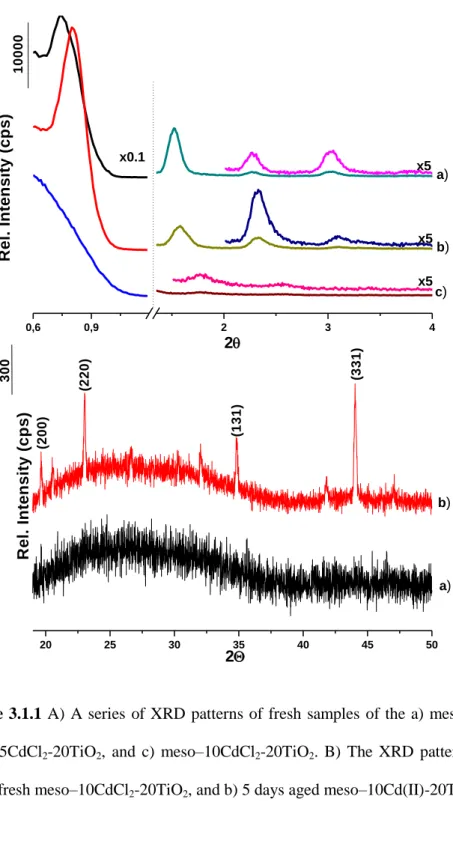
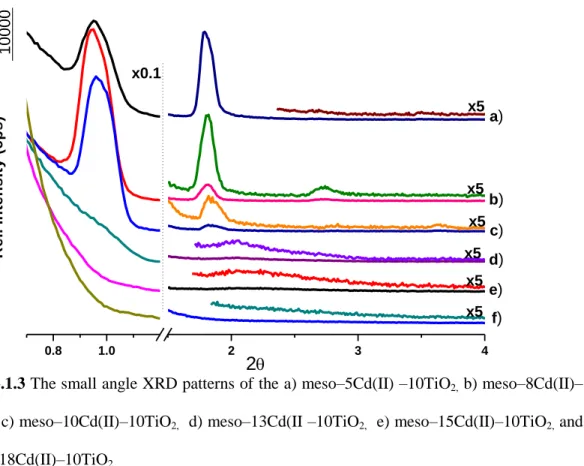
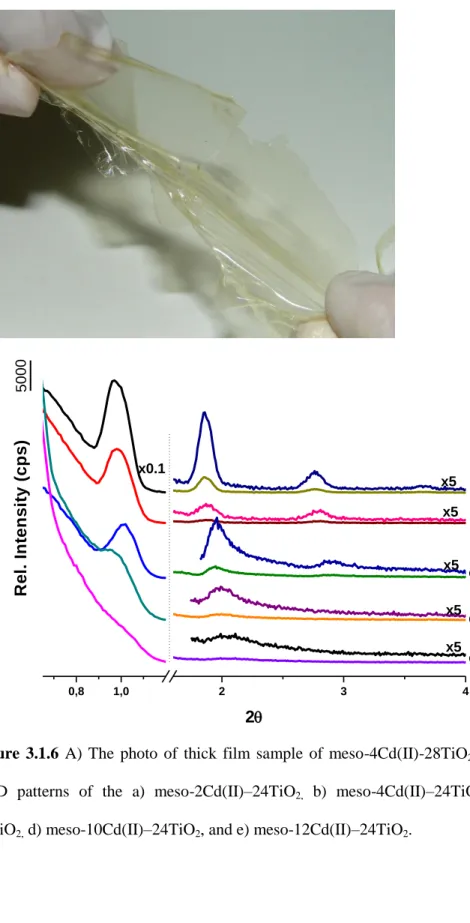
The phase behavior and synthesis of mesostructured coupled semiconductor thin films : MESO-CdS-TiO2
Tam metin
Şekil


Benzer Belgeler
The BTRC has measured radiated power density and electric field strength from cell phone towers (BTSs) in Kushtia district including Dhaka which is the capital
The imbibed metal or complex ions were chemically and/or thermally converted to metal nanoparticles inside the pores of mesoporous silica films and monoliths..
The occupation rate of the Eastern Mediterranean Sea by alien fish (Lessepsian species) has accelerated in recent years. Approximately 40% of the alien fish species
In this study, pure and gold (Au) nanoparticles doped TiO 2 thin films (Au/Ti = 10, 20, 30, 40 and 50 at%) were prepared by sol-gel method and the impact of Au nanoparticles doping
Yama ve plaklarla baflvuran befl MF’li çocuk olgunun üçünde topikal PUVA tedavisi ikisinde ise orta po- tent topikal steroid tedavisi ile baflar›l› sonuçlar
Whenever in any country, community or on any part of the land, evils such as superstitions, ignorance, social and political differences are born, h u m a n values diminish and the
Prediction: An expanding universe is evolving over time?.
haftada başvuran olgularını post-travmatik stres kı- rığı tanısı ile tedavi etmişler ancak ağrının şiddetinin giderek artması üzerine travma sonrası 5.nci ayda
