ROLE OF EDUCATION IN PREVENTING DOMESTIC VIOLENCE A Master’s Thesis by RAMIZ ABDURAHIMOV Department of Economics
İhsan Doğramacı Bilkent University Ankara August 2017 RA M IZ AB D UR AH IM OV R OL E O F ED UCAT IO N IN PR E VE NT ING DO MES T IC V IO L EN C E
Bilkent
Un
iversit
y
201
7
ROLE OF EDUCATION IN PREVENTING DOMESTIC VIOLENCE A Master’s Thesis by Ramiz Abdurahimov Department of Economics
˙Ihsan Do˘gramacı Bilkent University Ankara
ROLE OF EDUCATION IN PREVENTING DOMESTIC VIOLENCE
The Graduate School of Economics and Social Sciences of
Bilkent University by
Ramiz Abdurahimov
In Partial Fulfillment of the Requirements For the Degree of MASTER of ARTS
in
THE DEPARTMENT OF ECONOMICS ˙IHSAN DO ˘GRAMACI B˙ILKENT UNIVERSITY
ANKARA September 2017
ABSTRACT
ROLE OF EDUCATION IN PREVENTING DOMESTIC VIOLENCE
Abdurahimov, Ramiz M.A., Department of Economics Supervisor: Asst. Prof. Dr. S¸. Pelin Akyol
September 2017
This study explores the relationship between female education and domestic violence, utilizing a change in compulsory schooling law. We employ regression discontinuity design and instrumental variable estimation method to analyze the effect of the policy. The years of schooling for women has increased by a half-year. We find that increased years of schooling is accompanied by a decline in sexual violence and physical violence, while psychological violence, social control behavior and financial control behavior from partners remain unchanged. Among the
underlying channels through which education translates into domestic violence, improvements in the marriage market seem dominant. Better educated women are found to be less likely to divorce and more likely to exercise their own marriage decision, and marry men with better socio-economic status. Women’s gender attitudes have improved, while labor market outcomes remain unchanged.
¨ OZET
A˙ILE ˙IC¸ ˙I S¸˙IDDET˙IN ¨ONLENMES˙INDE E ˘G˙IT˙IM˙IN ROL ¨U
Abdurahimov, Ramiz
Y¨uksek Lisans, ˙Iktisat B¨ol¨um¨u
Tez Y¨oneticisi: Yard. Do¸c. Dr. S¸. Pelin Akyol
Eyl¨ul 2017
Bu ¸calı¸smada kadın e˘gitimi ve aile i¸ci ¸siddet arasındaki ili¸ski zorunlu e˘gitim kanunundan yararlanılarak ara¸stırılmaktadır. Bu politikanın etkilerini incelerken
regresyon s¨ureksizli˘gi analizi ve ara¸c de˘gi¸sken tahminleri kullandık. Kadınların
e˘gitim s¨uresinin yarım yıl arttı˘gı bulunmu¸stur. Elde etti˘gimiz bulgulara g¨ore
kadınların e˘gitim s¨uresi arttık¸ca cinsel ve fiziksel ¸siddete maruz kalma oranları
azalmı¸stır. E¸sler tarafından uygulanan psikolojik ¸siddet, sosyal ve finansal kontrol
davranı¸slarında ise de˘gi¸sim g¨or¨ulmemi¸stir. E˘gitim ve aile i¸ci ¸siddet arasındaki
ili¸skinin en ¨onemli unsurunun evlilik kurumu oldu˘gu g¨or¨ulm¨u¸st¨ur. Daha e˘gitimli
kadınların bo¸sanma oranları azalmı¸s olup, e¸slerini kendi iradeleri ile se¸cme
olasılı˘gının arttı˘gı, ayrıca sosyo-ekonomik bakımdan daha iyi e¸sler ile evlendikleri bulunmu¸stur. Kadınların toplumsal cinsiyet normları hakkındaki tutumları iyile¸smi¸s ve emek piyasasındaki pozisyonları de˘gi¸smemi¸stir.
ACKNOWLEDGMENTS
I am grateful to my supervisor Assistant Professor S¸. Pelin Akyol whose understanding, guidance and support made it possible for me to work on this subject. It was a pleasure working with her.
I am highly indebted to my second reader, Associate Professor C¸ a˘gla ¨Okten for
being so kind to show interest in my work and giving great advice regarding the topic of my research.
I would like to express my gratitude to Assistant Professor Aykut Attar of the Department of Economics at Hacettepe University. I deeply appreciate his constant interest, support and guidance through my training in economics.
I would like to thank my friends Adil, Deniz, Zeynep, Melis, Omid and Kemal for their support and motivation.
Finally, without hesitation I would like to thank my family to whom this thesis is dedicated to.
TABLE OF CONTENTS
ABSTRACT . . . i ¨ OZET . . . ii ACKNOWLEDGMENTS . . . iii TABLE OF CONTENTS . . . . iv LIST OF TABLES . . . . viLIST OF FIGURES . . . . vii
CHAPTER 1: INTRODUCTION . . . 1
1.1 Introduction and Literature Review . . . 1
1.2 Overview of Compulsory Schooling Law in Turkey . . . 6
CHAPTER 2: DATA AND EMPIRICAL METHODOLOGY . . . 8
2.1 Data . . . 8
2.2 Model and Identification . . . 10
2.3 Preliminary Checks . . . 11
CHAPTER 3: SCHOOLING AND DOMESTIC VIOLENCE OUTCOMES . . 15
3.1 Effects of Compulsory Schooling Law on Education Outcomes . . . . 15
3.2 Effects of Compulsory Schooling Law on Violence Outcomes . . . 18
CHAPTER 4: INVESTIGATING CAUSAL CHANNELS . . . 24
4.1 Gender Attitudes . . . 24
4.2 Labor Market Outcomes . . . 27
4.3 Marriage Market Outcomes . . . 28
CONCLUSION . . . 32
BIBLIOGRAPHY . . . 34
LIST OF TABLES
1 RD Estimates for Covariates . . . 14
2 Treatment Effects on Schooling . . . 16
3 Treatment Effects on Schooling by Childhood Region . . . 18
4 Violence Outcomes from Last Partner by Childhood Region . . . 21
5 Violence Outcomes from Any Partner by Childhood Region . . . 23
6 Education Effects on Gender Attitudes by Childhood Region . . . 26
7 Education Effects on Labor Market Outcomes by Childhood Region . 28 8 Education Effects on Marriage Outcomes by Childhood Region . . . . 30
9 Summary Statistics for 23-32 Year Old Women by Childhood Region 36 10 Violence Outcomes from Last Partner with Static Bandwidth . . . 39
11 Education Effects on Gender Attitudes with Static Bandwidth . . . . 40
12 Education Effects on Labor Market Outcomes with Static Bandwidth 41 13 Education Effects on Marriage Outcomes with Static Bandwidth . . . 42
LIST OF FIGURES
1 McCrary Density Test . . . 12
2 McCrary Density Test by Childhood Region . . . 12
3 Local Kernel Density Tests for Covariates . . . 13
4 RD Treatment Effects on Schooling: Rural vs Urban . . . 17
CHAPTER 1
INTRODUCTION
1.1
Introduction and Literature Review
Violence against women has been a serious social problem that has considerable economic effects. Its effect on economy mostly channels through the labor market. The cost of domestic violence to society is enormous, such that, it causes lower productivity, absenteeism from work, increased health and security expenditures, while children that witness abuse at home are more likely to develop mental and psychological deficiencies. The direct cost of violence against women is estimated to be around 1-2% of GDP (Duvvury et al., 2013). Aguero (2013) finds that, although violence against women affects women’s and their children’s health negatively, it is a major cause for divorce, which in turn pushes women to increase their labor supply. Carrell and Hoekstra (2012), studies the consequences of children witnessing
domestic violence at home, in particular its effects on his/her peers. Carrell and Hoekstra (2010) estimate this effect, finding that in a class of 20 students, adding
one child who was exposed to domestic violence to the class, decreases their test scores by 0.69 percentage points, namely in math and reading courses. It also increases the number of disciplinary actions by 17%. Santos (2013) finds the cost of domestic violence to victims to be e 25000, despite it being regarded as a ”private matter”.
There are different hypotheses that try to explain the role of education and female economic empowerment in preventing violence against women. One such
explanation dictates that access to better employment opportunities, income and welfare payments increase women’s bargaining power and outside option, thus rendering her unwilling to stay in an abusive relationship (Farmer and Tiefenthaler, 2003, Stevenson and Wolfers, 2006, Aizer, 2010, Hidrobo and Fernald, 2013). From an alternative point of view, better social and economic position of women
encourage their partners to use violence as an instrument as means to extract resources (Rao, 1999, Eswaran and Malhotra, 2011, Bobonis et al., 2013).
Domestic abuse is rampant in Turkey. According to DESA (2010), 40% of women in Turkey had experienced some form of intimate partner violence. We aim to
investigate the effect of education on domestic violence using the 1997 Compulsory Schooling Law. Prior to 1997, the education system was composed of the
mandatory component of five years of primary school, and the voluntary component of three years of junior high school and three years of high school. After the
enforcement of the law in 1997-1998 school-year, students were to complete eight years of mandatory schooling before having an option to drop out. Therefore
individuals born before January 1987 could drop out after their five years at school, whereas those who were born after January 1987 had to complete eighth grade. We expand on the context and intents of the law in the further sections.
motive, hence it serves as a natural experiment. Several studies utilize the law to study various non-market outcomes in Turkey. Gulesci and Meyersson (2012) investigate the effects of the law on female religiosity. They show that the reform resulted in a one-year increase in years of schooling on average among women. The education increase resulted in women reporting lower levels of religiosity, greater decision rights over marriage and contraception, as well as higher household durable consumption. Din¸cer et al. (2014) find a positive and significant connection between female education and child health and mortality. They report that 10 percentage point increase in the proportion of ever married women with eight years of schooling lowered number of pregnancies per woman by 0.13 and number of children per women by 0.11.
Erten and Keskin (2016) study the effect of education on domestic violence. Using 2008 Turkey’s National Survey on Domestic Violence against Women, they find positive correlation between increased years of schooling and labor market outcomes. They also report a significant increase in psychological violence and financial control behavior experienced by women raised in rural areas, while they report no
significant changes in physical and sexual violence as a result of the reform. They find no evidence on whether the education law had a significant effect on domestic violence attitudes, including violence against women or violence against children. We adopt Regression Discontinuity (RD) design along with 2014 Turkey’s National Research on Domestic Violence against Women (TNRDVW) micro data set to estimate the causal effects of the 1997 Compulsory Schooling Law on violence against women and channels through which education influences the violence outcomes. The RD design is a quasi-experimental method that allows us to assign the status of treatment group (those affected by the reform) and control group (those who were not affected by the reform) clearly. January 1987 cohort is the first
to be affected by the reform and our main identifying assumption is that individuals born one month apart from each other (before and after January 1987) do not display any systematic differences.
The earlier study (Erten and Keskin, 2016) employs 2008 data, whose oldest respondents that were affected by the reform were at the age of 22 at the time of survey. These women were 27 years old in 2014 which should exhibit a longer-run behavior of couples. Considering that the average marriage age for women in Turkey is 20, most of the ”treated” women were unmarried back in 2008 youngest ones being 16. The youngest ”treated” women we include in our analysis are 23 years-old, which is one standard deviation above the average. The results of this paper should be considered as complementary to previous studies, rather than a substitute. Our analysis not only reports the effects of exogenous increase in education on domestic violence, but also explores the channels through which the former two are linked. Firstly, we test whether the Compulsory Schooling Law had an impact on women’s attitudes towards gender norms and domestic abuse. Improvement in these attitudes coincide with women being more aware of their rights and growing less tolerant of being in an abusive relationship. Secondly, we examine how the labor market outcomes for women have changed as a result of the reform. These results accompanied by the trends in domestic violence, would hint towards either the household bargaining or instrumental violence theories. Thirdly, we consider the effect education has on marriage market outcomes, as highly educated women are more likely to marry men with higher socio-economic status.
We find that the years of schooling for women who have ever had a relationship increased by 0.596 years and junior high school completion rate has gone up by 19.8 percentage points (ppts). Women who grew up in rural areas received 1.815 more years of schooling and junior high school completion rate has increased by 37.8 ppts
as a result of the reform. We find no evidence of an increase in years of schooling for women who grew up in urban areas.
We introduce 5 categories of violence: physical (severe and mild), psychological, sexual, social control behavior and financial control behavior. We construct indexes for each category by averaging z-scores of dummies of having experienced an act of abuse under the relevant classes of violence. Our findings indicate a 17.1 and 20.1 ppt decrease in physical and sexual violence, respectively. The significant part of the decline in physical violence can be attributed to a 22 ppt reduction in severe
physical violence. Physical violence (mainly stemming from severe degree) has decreased by 27.4 ppt (32.9 ppt) for women raised in rural areas.
We also examine the causal channels that were effective in reducing the violence experienced by women. We find no evidence of a change in women’s gender attitudes, especially in attitudes towards husband’s right to use violence, right to beat children and women’s right to refuse sex. We also fail to find any significant effect of the reform on women’s labor market outcomes.
We proceed by investigating the effect of the Compulsory Schooling Law on marriage market. Women’s marriage decision rate has increased by 11.2 ppt – women became more likely to exercise their choice of partners after the reform. Also the husband’s employment rate has increased, while the partner’s propensity of having experienced violence during his childhood, and divorce rates have declined. Only marriage decision for women who grew up in rural areas have increased (by 22.8 ppt). Overall we find a negative relationship between education and violence against women. The main causal channel in reducing the violence is marriage market. More educated women are better at differentiating partners, thus have better access to resources and experience less violence and divorces.
1.2
Overview of Compulsory Schooling Law in Turkey
Since the establishment of the Republic of Turkey in 1923, education was managed by the central government entity, namely The Ministry of National Education. The Ministry of National Education is in charge of all structural reforms and education policies.
The Turkish National Education System has two parts: formal, which is mainly conducted in schools, and non-formal, that is carried out by out-of-school institutions such as public education centers, vocational schools or practical art schools for girls.
Prior to 1997, basic education in Turkey consisted of: five years of primary school, three years of junior high school and three years of high school. The primary school was compulsory, while the latter were voluntary. Following the primary school, students could choose to study in general or voluntary/religious (imam-hatip) schools. Turkey’s laws required the education to be provided only in Turkish, in a co-educational setting, particularly prohibited wearing headscarf, even in religious schools. This practice, however, had often been neglected in religious schools. In the light of growing political power, an Islamist party eventually won the 1995 Turkish Grand National Assembly (the parliament) elections, which would be
followed by a conflict with secular groups, notably centered in military and judiciary. One of the main points of the strife was the public display and practice of religiosity, especially women wearing headscarf and attending religious education institutions. In 1997, the military decided to intervene with new set of laws to prevent the spread of Islamist rule. On February 1997, the National Security Council announced the adoption of eighteen amendments in law. One of them, namely Law No. 4306,
stated that the compulsory schooling would be extended from five years to eight. This would not only serve as means to better education, but also would cease the validity of religious schools. The enforcement mechanism was the abolition of the five-year primary school diploma. Instead, an eight-year diploma would be awarded to students who completed eighth grade of primary-school.
The subjects of the Compulsory Schooling Law were determined by the school starting age. Those who completed fifth grade in 1997 were given the option to drop out, whereas those who finished fourth grade and would start fifth grade in
1997-1998 academic year would have to complete eight years to earn the diploma. Therefore individuals born before January 1987 would be exempt from the new enactment, while those who were born after January 1987 would have to complete eight grades. Despite imperfect compliance with the law, fails and repetitions of grades, vast majority followed the new structure.
Apart from legal amendments, considerable amount of funds has been invested to enable this scale of education. Within just a few years 82.000 classrooms were built and 70.000 instructors were recruited. In order to improve the access of students in rural areas, school buses were lunched to remote districts under the Bused Primary Education Scheme (Ministry of National Education, 2011).
The schooling law had an impressive impact on primary school enrollment rates. The net enrollment rate in primary school increased from 84.74 in 1997-1998 academic year to 93.54 in 1999-2000 academic year. The increase in enrollment rates for females (78.97 to 88.45) were greater than males (90.25 to 98.41). The sex ratio in primary education also increased from 85.63 to 88.54 (Ministry of National Education, 2011).
CHAPTER 2
DATA AND EMPIRICAL METHODOLOGY
2.1
Data
We use 2014 Turkey’s National Research on Domestic Violence against Women (TNRDVW) micro data set in this paper. The survey has nation-wide
representativeness with a sample size of 15084 households. These households were visited by interviewers in 2014 and face-to-face interviews were completed with women aged 15-59, regardless of whether they had been married, in a relationship (engaged, boyfriend) or neither. Only one woman randomly chosen from each household was interviewed and included in the sample. The survey includes information on the household population and the housing characteristics,
background characteristics, marriage history, general health and reproductive health of the women, behavioral problems of their children, background characteristics and behavioral patterns of the husband/partner, and the information on the physical, sexual and psychological acts of violence, social and financial control experienced by
women from their husbands/partners, their relationship with individuals other than their husband/partners and opinions of women on gender norms.
We will only use the sub-sample of women who have ever been married or ever had a relationship (engaged or had a boyfriend), since those who never were in a
relationship would trivially not experience violence from an intimate partner, which is the primary goal of this study. We introduce 5 categories of domestic violence: physical violence, psychological violence, sexual violence, social control behavior and financial control behavior. The violence incidences that appear in data are
self-reported. Although it is more likely that educated women report these incidences more frequently and accurately, only acts of violence reported to
authorities are truthful enough to be recorded and included in analysis. Therefore, the effect of education on domestic violence is probably over-estimated.
We divide the physical violence into two subcategories by the severity of the act of abuse: severe and mild. Severe degree of physical violence is specified as the
respondent having ever been kicked, dragged, beaten, choked, burned or threatened with a weapon or a knife by any of her partners. Mild degree of physical violence is defined by the respondent having ever been slapped, pushed, shoved, got hair pulled or punched by any of her partners. Physical violence includes acts of both severe and mild categories. This distinction allows us to examine the physical violence outcomes in greater detail. One would expect a partner to exert mild acts of violence as an instrument. On the other hand, the acts of violence with severe health damage by a partner might be traced to a behavioral or mental disorder. Psychological violence is measured by the interviewee having been insulted, belittled, humiliated, scared or intimidated by her partner on purpose. Sexual violence is specified as the respondent having ever been forced to have sex, do humiliating sexual things or had an intercourse with the partner due to fear. Social
control behavior is specified by whether the respondent’s partner ever prevented her contact from her family, her contact from her friends, insists on knowing where she is, gets angry if she speaks to another man, is suspicious that she is unfaithful, demands permission for seeking health care, intervenes in her clothes and intervenes in her social network usage. Financial control behavior is defined by whether the respondent’s partner has ever prevented her from working, refused to give her money or took her earnings. We specify the violence measures by averaging the z-scores of dummies of having experienced an act of abuse under the relevant classes of violence. Table reports summary statistics for 23-32 year old women. Columns (1)-(3) lists means, standard deviations and the number of observations for women who have ever had a relationship, and rural and urban childhood regions,
respectively. Column (4) reports the differences of columns (3) and (2). We see that there is a statistically significant difference in years of schooling between the rural and urban subsample. Attitudes towards gender norms are more gender-equal for women in urban areas. The average marriage age for women raised in rural and urban areas are 19.9 and 20.5, respectively. This implies that a significant portion of women that we include in our analysis have been married.
2.2
Model and Identification
The methodology we use is Regression Discontinuity design (Imbens and Lemieux, 2008). The change in Compulsory Schooling Law serves as the primary tool for identification of our model. Since the law was to be enforced starting from an exact date (January 1987), regardless of individual preference, treatment status
(mandated to receive additional three years of schooling) is assigned randomly and due to the political motive of the reform, manipulation of the requirements for the treatment is impossible. Therefore, our identifying assumption is that individuals
that were born one month apart (before and after January 1987) do not display any systematic differences other than being forced to complete either five or eight years of compulsory schooling. We use the birth month of individuals as the forcing variable of the model. We regard January 1987 as the cutoff to investigate the causal effect of the law.
We use the discontinuity at the cutoff point as the treatment status for
reduced-form and as an instrument for two staged least squares regression. We use local linear regression in RD estimations along the optimal bandwidth, calculated via Calonico, Cattaneo, Titiunik algorithm (CCT) (Calonico et al., 2014). The optimal bandwidth for schooling is 50 months (on each side of the cutoff), and it will be used as a static plug-in bandwidth for robustness check of the results. We include following control variables in specifications: a dummy variable for whether the respondent’s interview language was different from Turkish, month-of-birth fixed effects, a dummy variable for having grown up in rural areas, childhood region fixed effects and their interaction. Other information on individuals, such as personal income, type of residence, health status etc. is not included in the regression. Thus, only factors determined prior to the law enforcement will be used as regressors.
2.3
Preliminary Checks
Firstly, we examine the continuity of the forcing variable near the cutoff point using McCrary’s density test (McCrary, 2008). We hypothesize that the estimated kernel density of the month of birth is not continuous at the cutoff. We reject the null hypothesis, thus the discontinuity in dependent variables are not generated by the forcing variable.
.001 .002 .003 .004 Density −50 0 50
Month of Birth, January 1987=0
McCrary Density Test
Figure 1: McCrary Density Test
Moreover, we perform McCrary test for the two subsamples that we use later, i.e. childhood region being rural/urban.
0 .001 .002 .003 .004 .005 Density −50 0 50
Month of Birth, January 1987=0
(a) Childhood Region: Rural
0 .001 .002 .003 .004 .005 Density −50 0 50
Month of Birth, January 1987=0
(b) Childhood Region: Urban Figure 2: McCrary Density Test by Childhood Region
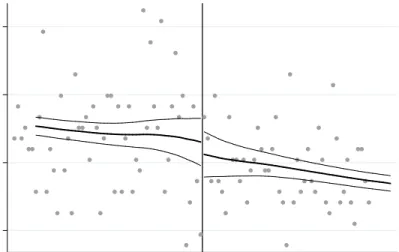
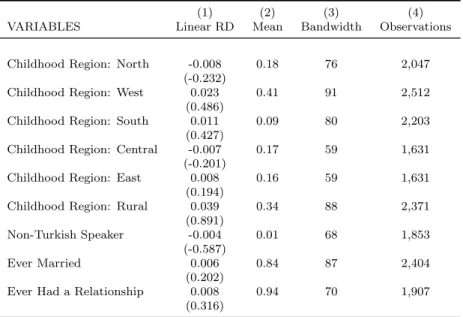
Secondly, we check for any discontinuities in covariates near the cutoff. We construct dummy variables for these background characteristics that take value 1 depending on whether the respondent grew up (until the age of 12) in Western, Northern, Southern, Central or Eastern regions of Turkey, whether the respondent
grew up in rural area (until the age of 12), the language of the interview was not Turkish, has ever been married, has ever had a relationship and 0 otherwise. Local averages of the covariates in monthly bins have been plotted against year and month of birth. January 1987 is appointed as the cutoff and lines represent local linear fits and respective confidence intervals. We find no discontinuity in any of the covariates at the cutoff. Table 1 lists the RD estimates.
0 .2 .4 .6 .8 1 −50 0 50
Month of Birth, January, 1987 = 0
Childhood Region: North
0 .2 .4 .6 .8 1 −50 0 50
Month of Birth, January, 1987 = 0
Childhood Region: West
0 .2 .4 .6 .8 1 −50 0 50
Month of Birth, January, 1987 = 0
Childhood Region: South
0 .2 .4 .6 .8 1 −50 0 50
Month of Birth, January, 1987 = 0
Childhood Region: Central
0 .2 .4 .6 .8 1 −50 0 50
Month of Birth, January, 1987 = 0
Childhood Region: East
0 .2 .4 .6 .8 1 −50 0 50
Month of Birth, January, 1987 = 0
Childhood Region: Rural
0 .2 .4 .6 .8 1 −50 0 50
Month of Birth, January, 1987 = 0
Non−Turkish Speaker 0 .2 .4 .6 .8 1 −50 0 50
Month of Birth, January, 1987 = 0
Ever Married 0 .2 .4 .6 .8 1 −50 0 50
Month of Birth, January, 1987 = 0
Ever Had a Relationship
Table 1: RD Estimates for Covariates
(1) (2) (3) (4)
VARIABLES Linear RD Mean Bandwidth Observations
Childhood Region: North -0.008 0.18 76 2,047
(-0.232)
Childhood Region: West 0.023 0.41 91 2,512
(0.486)
Childhood Region: South 0.011 0.09 80 2,203
(0.427)
Childhood Region: Central -0.007 0.17 59 1,631
(-0.201)
Childhood Region: East 0.008 0.16 59 1,631
(0.194)
Childhood Region: Rural 0.039 0.34 88 2,371
(0.891)
Non-Turkish Speaker -0.004 0.01 68 1,853
(-0.587)
Ever Married 0.006 0.84 87 2,404
(0.202)
Ever Had a Relationship 0.008 0.94 70 1,907
(0.316)
Note: Data are from 2014 TNRDVW. Column (1) lists linear RD point
esti-mates, columns (2)-(3) list means, optimal CCT bandwidths and observations included in each regression, respectively. January 1987 is chosen as cutoff. All specifications include month of birth fixed effects, region fixed effects and childhood rural or urban region dummies and their interactions as controls. Standard errors are clustered at the month-year cohort level ***, **, * indicate the significance at 1%, 5%, 10% levels, respectively.
CHAPTER 3
SCHOOLING AND DOMESTIC VIOLENCE
OUTCOMES
We start by studying the effects of the Compulsory Schooling Law on education, in detail. Further we proceed to investigate domestic violence outcomes.
3.1
Effects of Compulsory Schooling Law on Education
Out-comes
We first report the schooling effects of the reform on the sample of all women and the subsample of women who have had relationship – who are or have ever been married, engaged and boyfriend. We perform linear RD regression, using schooling outcomes as dependent variables – years of schooling, a dummy that takes value one if the respondent has completed junior high school. We appoint month of birth as the forcing variable and include interview language, month of birth fixed effects,
childhood area of growth, childhood region fixed effects and interaction of the latter two as covariates. Table 2 lists the treatment effect estimates of local linear and quadratic regressions within the CCT bandwidth – ˆh, 2ˆh and ˆh/2.
We observe that the Compulsory Schooling Law has increased the total years of schooling and junior high school completion rate by 0.649 years and 19 ppt, respectively. Years of schooling for women who have had a relationship have increased by 0.596 years which is a 7 percent increase relative to the mean. Also a 19.8 ppt increase in junior high school completion rate reaffirms the significant effect of the reform on education for the subsample of women that we target. Our results are consistent with those of Gulesci and Meyersson (2012), Din¸cer et al. (2014) and Erten and Keskin (2016).
Table 2: Treatment Effects on Schooling
(1) (2) (3) (4) (5) (6) (7)
VARIABLES Linear RD Quadratic RD Linear RD Linear RD
ˆ
hbandwidth ˆhbandwidth ˆh/2 bandwidth 2ˆhbandwidth BW Obs. Mean
SAMPLE OF ALL WOMEN
Years of Schooling 0.649* 0.393 0.182 0.813*** 53 1,337 8.44
(1.844) (0.741) (0.373) (2.959)
Junior Highschool 0.190*** 0.141** 0.081 0.185*** 58 1,259 0.63
Completion Rate (4.802) (2.277) (1.413) (6.386)
SAMPLE OF WOMEN WHO HAVE HAD A RELATIONSHIP
Years of Schooling 0.596* 0.430 0.176 0.546** 50 1,258 8.44
(1.671) (0.800) (0.353) (1.971)
Junior Highschool 0.198*** 0.144** 0.084 0.189*** 58 1,184 0.63
Completion Rate (4.880) (2.299) (1.432) (6.115)
Note: Data are from 2014 TNRDVW. Column (1)-(4) list RD point estimates for different bandwidths. January
1987 is chosen as cutoff in all specifications. Columns (5)-(7) report optimal CCT bandwidths, number of observations and sample means, respectively. All specifications include month of birth fixed effects, region fixed effects and childhood rural or urban region dummies and their interactions as controls. Standard errors are clustered at the month-year cohort level ***, **, * indicate the significance at 1%, 5%, 10% levels, respectively.
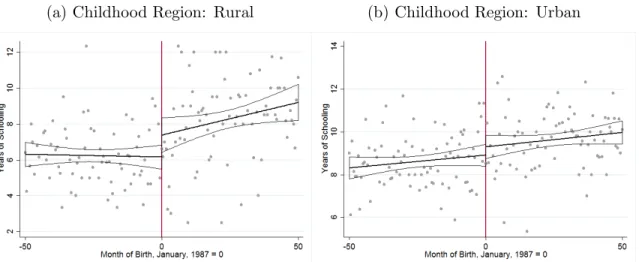
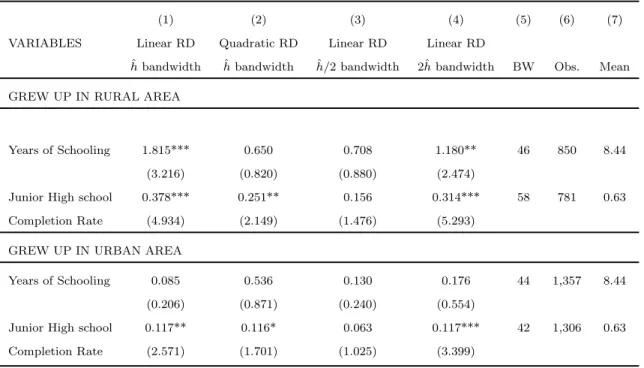
completion rate for women who grew up in rural areas versus ones who grew up in urban areas. Years of schooling have increased by 1.8 years for women who grew up in rural areas, while there is no evidence of increased years schooling for women who grew up in urban areas as a result of the reform. Figure 4 illustrates the RD
treatment effects on schooling. Local average years of schooling in monthly bins have been plotted against month and year of birth, 0 (January 1987) being the cutoff. Lines correspond to local linear fits and respective confidence intervals. Table 3 lists the RD treatment effect estimates for the schooling outcomes of the two subsamples.
(a) Childhood Region: Rural (b) Childhood Region: Urban
Table 3: Treatment Effects on Schooling by Childhood Region
(1) (2) (3) (4) (5) (6) (7)
VARIABLES Linear RD Quadratic RD Linear RD Linear RD
ˆ
hbandwidth ˆhbandwidth ˆh/2 bandwidth 2ˆhbandwidth BW Obs. Mean
GREW UP IN RURAL AREA
Years of Schooling 1.815*** 0.650 0.708 1.180** 46 850 8.44
(3.216) (0.820) (0.880) (2.474)
Junior High school 0.378*** 0.251** 0.156 0.314*** 58 781 0.63
Completion Rate (4.934) (2.149) (1.476) (5.293)
GREW UP IN URBAN AREA
Years of Schooling 0.085 0.536 0.130 0.176 44 1,357 8.44
(0.206) (0.871) (0.240) (0.554)
Junior High school 0.117** 0.116* 0.063 0.117*** 42 1,306 0.63
Completion Rate (2.571) (1.701) (1.025) (3.399)
Note: Data are from 2014 TNRDVW. Column (1)-(4) list RD point estimates for different bandwidths. January
1987 is chosen as cutoff in all specifications. Columns (5)-(7) report optimal CCT bandwidths, number of observations and sample means, respectively. All specifications include month of birth fixed effects, region fixed effects and childhood rural or urban region dummies and their interactions as controls. Standard errors are clustered at the month-year cohort level ***, **, * indicate the significance at 1%, 5%, 10% levels, respectively.
3.2
Effects of Compulsory Schooling Law on Violence
Out-comes
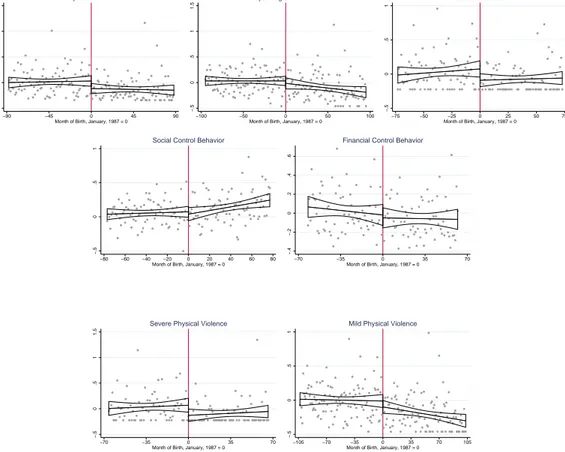
In this section, we examine the effects increased schooling might have on domestic violence. We use physical violence (severe and mild degrees), psychological violence, sexual violence, social control behavior and financial control behavior z-score
indexes as dependent variables, while using month and year of birth as the forcing variable. Figure 5 illustrates the RD treatment effects of the Compulsory Schooling Law. Local averages of the dependent variables in monthly bins have been plotted against year and month of birth. January 1987 is appointed as the cutoff and lines represent local linear fits and respective confidence intervals. One can visually
affirm that physical and sexual violence has decreased as a result of the reform. −.5 0 .5 1 1.5 −90 −45 0 45 90
Month of Birth, January, 1987 = 0
Physical Violence −.5 0 .5 1 1.5 −100 −50 0 50 100
Month of Birth, January, 1987 = 0
Psychological Violence −.5 0 .5 1 −75 −50 −25 0 25 50 75 Month of Birth, January, 1987 = 0
Sexual Violence −.5 0 .5 1 −80 −60 −40 −20 0 20 40 60 80 Month of Birth, January, 1987 = 0
Social Control Behavior
−.4 −.2 0 .2 .4 .6 −70 −35 0 35 70
Month of Birth, January, 1987 = 0
Financial Control Behavior
−.5 0 .5 1 1.5 −70 −35 0 35 70
Month of Birth, January, 1987 = 0
Severe Physical Violence
−.5
0
.5
1
−105 −70 −35 0 35 70 105 Month of Birth, January, 1987 = 0
Mild Physical Violence
Figure 5: RD Treatment Effects on Domestic Violence Categories
Further, we run OLS, local linear RD, and 2SLS regressions to estimate the effect of the education reform. The violence outcomes are constructed by averaging z-scores of subcategories of violence caused by last partners. Aside from women who have had a relationship, we also restrict our attention to those with rural childhood
regions.1 OLS estimates capture general trends, while local linear RD (sharp RD)
and 2SLS (fuzzy RD) estimates capture the effect of the reform within the optimal bandwidth obtained via CCT algorithm. We include month of birth fixed effects, region fixed effects and childhood rural/urban region dummies and their
interactions as controls.
1We do not analyze the effects of the Compulsory Schooling Law on women who grew up in
urban areas, exclusively. Since the reform had no significant effect on years of schooling for this subsample, associating changes in violence with education would be erroneous.
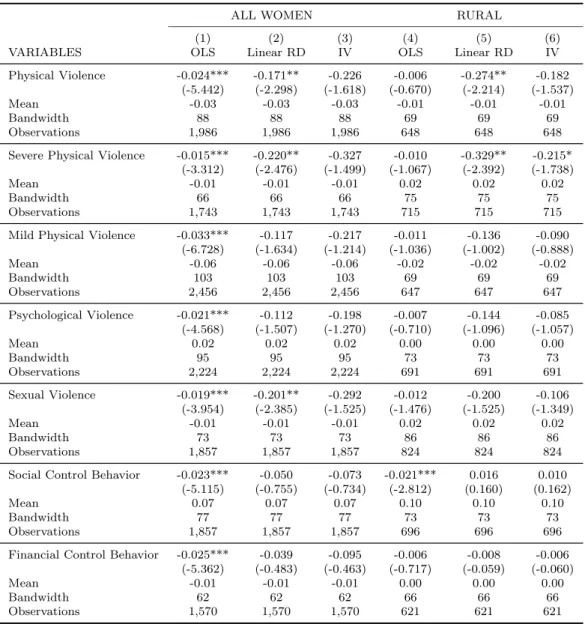
Table 4 reports the regression estimates for the domestic violence indexes. Column (1) lists OLS estimates, columns (2) and (3) list local linear RD and IV estimates. Columns (4)-(6) report the above mentioned estimates for the subsample of women who grew up in rural areas. Included below the point estimates are t-statistics, means, optimal bandwidths and observations for each regression.
There is a clear negative relationship between violence outcomes and increased years of schooling, based on the OLS estimates. RD estimates for physical and sexual violence are, indeed, negative and significant at 5% level. Despite mild degree of physical violence not having changed, severe degree of physical violence has decreased by 22 ppt, which contributes to the significant decrease in general
physical violence. For women who grew up in rural areas physical violence declined by 27.4 ppt, which mainly stem from a 32.9 ppt decrease in severe degree of physical violence.
IV estimates do not exhibit any considerable changes as attributed to the reform. We use the treatment dummy as the instrument for schooling. In the first stage of the 2SLS regression the dependent variable is binary, thus decreasing the efficiency of the point estimates greatly.
We include robustness check for the violence outcomes from last partner in the appendix. Table 10 lists all regressions performed with static plug-in bandwidth of 50 – the CCT optimal bandwidth for schooling outcomes for women who have ever had a relationship.
Table 4: Violence Outcomes from Last Partner by Childhood Region
ALL WOMEN RURAL
(1) (2) (3) (4) (5) (6)
VARIABLES OLS Linear RD IV OLS Linear RD IV
Physical Violence -0.024*** -0.171** -0.226 -0.006 -0.274** -0.182
(-5.442) (-2.298) (-1.618) (-0.670) (-2.214) (-1.537)
Mean -0.03 -0.03 -0.03 -0.01 -0.01 -0.01
Bandwidth 88 88 88 69 69 69
Observations 1,986 1,986 1,986 648 648 648
Severe Physical Violence -0.015*** -0.220** -0.327 -0.010 -0.329** -0.215*
(-3.312) (-2.476) (-1.499) (-1.067) (-2.392) (-1.738)
Mean -0.01 -0.01 -0.01 0.02 0.02 0.02
Bandwidth 66 66 66 75 75 75
Observations 1,743 1,743 1,743 715 715 715
Mild Physical Violence -0.033*** -0.117 -0.217 -0.011 -0.136 -0.090
(-6.728) (-1.634) (-1.214) (-1.036) (-1.002) (-0.888) Mean -0.06 -0.06 -0.06 -0.02 -0.02 -0.02 Bandwidth 103 103 103 69 69 69 Observations 2,456 2,456 2,456 647 647 647 Psychological Violence -0.021*** -0.112 -0.198 -0.007 -0.144 -0.085 (-4.568) (-1.507) (-1.270) (-0.710) (-1.096) (-1.057) Mean 0.02 0.02 0.02 0.00 0.00 0.00 Bandwidth 95 95 95 73 73 73 Observations 2,224 2,224 2,224 691 691 691 Sexual Violence -0.019*** -0.201** -0.292 -0.012 -0.200 -0.106 (-3.954) (-2.385) (-1.525) (-1.476) (-1.525) (-1.349) Mean -0.01 -0.01 -0.01 0.02 0.02 0.02 Bandwidth 73 73 73 86 86 86 Observations 1,857 1,857 1,857 824 824 824
Social Control Behavior -0.023*** -0.050 -0.073 -0.021*** 0.016 0.010
(-5.115) (-0.755) (-0.734) (-2.812) (0.160) (0.162)
Mean 0.07 0.07 0.07 0.10 0.10 0.10
Bandwidth 77 77 77 73 73 73
Observations 1,857 1,857 1,857 696 696 696
Financial Control Behavior -0.025*** -0.039 -0.095 -0.006 -0.008 -0.006
(-5.362) (-0.483) (-0.463) (-0.717) (-0.059) (-0.060)
Mean -0.01 -0.01 -0.01 0.00 0.00 0.00
Bandwidth 62 62 62 66 66 66
Observations 1,570 1,570 1,570 621 621 621
Note: Data are from 2014 TNRDVW. Column (1)-(3) list OLS, local linear RD and IV estimates,
respectively. Columns (4)-(6) report the above mentioned estimates for the subsample of women who grew up in rural areas. January 1987 is chosen as cutoff in all specifications. Below the point estimates are t-statistics, means, optimal CCT bandwidths and observations included in each regression. All specifications include month of birth fixed effects, region fixed effects and childhood rural or urban region dummies and their interactions as controls. Standard errors are clustered at the month-year cohort level ***, **, * indicate the significance at 1%, 5%, 10% levels, respectively.
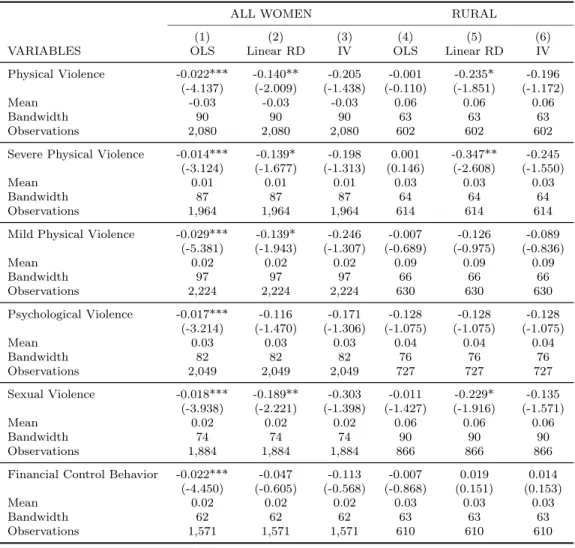
We also examine the effect of the reform on domestic violence from any partner. Again we observe a negative relationship between violence outcomes and education (see Table 5). An additional year of schooling leads to a 2.4 ppt decrease in physical violence which is 80 percent below the average.
The Compulsory Schooling Law had a significant negative effect on physical and sexual violence reducing them by 17.1 ppt and 20.1 ppt, respectively. Moreover, the reform decreased physical violence incidences with severe health damage by 22 ppt. The Schooling Law also had a significant effect in reducing violence experienced by women who grew up in rural areas. Physical violence has decreased by 27.4 ppt and physical violence acts with severe health damage has declined by mere 32.9 ppt which is considerably larger than the whole sample.
The Compulsory Schooling Law, primarily had a significant impact on fighting domestic violence, by decreasing physical and sexual violence experienced by women. The effect of the reform on physical violence was by larger margin for women who grew up in rural regions. To refine our analysis we investigate the channels that link education and domestic violence in further sections.
Table 5: Violence Outcomes from Any Partner by Childhood Region
ALL WOMEN RURAL
(1) (2) (3) (4) (5) (6)
VARIABLES OLS Linear RD IV OLS Linear RD IV
Physical Violence -0.022*** -0.140** -0.205 -0.001 -0.235* -0.196
(-4.137) (-2.009) (-1.438) (-0.110) (-1.851) (-1.172)
Mean -0.03 -0.03 -0.03 0.06 0.06 0.06
Bandwidth 90 90 90 63 63 63
Observations 2,080 2,080 2,080 602 602 602
Severe Physical Violence -0.014*** -0.139* -0.198 0.001 -0.347** -0.245
(-3.124) (-1.677) (-1.313) (0.146) (-2.608) (-1.550)
Mean 0.01 0.01 0.01 0.03 0.03 0.03
Bandwidth 87 87 87 64 64 64
Observations 1,964 1,964 1,964 614 614 614
Mild Physical Violence -0.029*** -0.139* -0.246 -0.007 -0.126 -0.089
(-5.381) (-1.943) (-1.307) (-0.689) (-0.975) (-0.836) Mean 0.02 0.02 0.02 0.09 0.09 0.09 Bandwidth 97 97 97 66 66 66 Observations 2,224 2,224 2,224 630 630 630 Psychological Violence -0.017*** -0.116 -0.171 -0.128 -0.128 -0.128 (-3.214) (-1.470) (-1.306) (-1.075) (-1.075) (-1.075) Mean 0.03 0.03 0.03 0.04 0.04 0.04 Bandwidth 82 82 82 76 76 76 Observations 2,049 2,049 2,049 727 727 727 Sexual Violence -0.018*** -0.189** -0.303 -0.011 -0.229* -0.135 (-3.938) (-2.221) (-1.398) (-1.427) (-1.916) (-1.571) Mean 0.02 0.02 0.02 0.06 0.06 0.06 Bandwidth 74 74 74 90 90 90 Observations 1,884 1,884 1,884 866 866 866
Financial Control Behavior -0.022*** -0.047 -0.113 -0.007 0.019 0.014
(-4.450) (-0.605) (-0.568) (-0.868) (0.151) (0.153)
Mean 0.02 0.02 0.02 0.03 0.03 0.03
Bandwidth 62 62 62 63 63 63
Observations 1,571 1,571 1,571 610 610 610
Note: Data are from 2014 TNRDVW. Column (1)-(3) list OLS, local linear RD and IV estimates,
respectively. Columns (4)-(6) report the above mentioned estimates for the subsample of women who grew up in rural areas. January 1987 is chosen as cutoff in all specifications. Below the point estimates are t-statistics, means, optimal CCT bandwidths and observations included in each regression. All specifications include month of birth fixed effects, region fixed effects and childhood rural or urban region dummies and their interactions as controls. Standard errors are clustered at the month-year cohort level ***, **, * indicate the significance at 1%, 5%, 10% levels, respectively.
CHAPTER 4
INVESTIGATING CAUSAL CHANNELS
Having established the negative relationship between the Compulsory Schooling Law’s effect and domestic violence, we continue by examining the causal channels between the two.
4.1
Gender Attitudes
We start by quantifying women’s attitudes towards gender norms. The data includes dummy variables based on various statements, that take value 1 if the respondent agrees with the statement. Larger values correspond to more
gender-equal opinions. Also we construct a gender attitudes index by averaging z-scores of the variables, where again, larger values correspond to more equal stance. Firstly, we observe a positive relationship between schooling and gender-equal attitudes based on OLS estimates. An additional year of schooling increases the
probability of women not condone violence from intimate partners by 2.6 ppt which is 4 percent more than the average.
Secondly, we find that the education reform had a positive effect on attitudes encompassing women’s autonomy in spending her money and a negative effect on their opinions on equal housework (e.g. cleaning, laundry work etc.), namely by 8.3 ppt and 7.5 ppt, respectively. However the point estimate of the attitude towards equal housework does not survive robustness check and it is insignificant within the bandwidth 50. The attitude towards women’s autonomy to spend their own money, on the other hand, is robust. This result hints towards the household bargaining theory, i.e. women becoming more aware of their rights, render them less tolerant of staying in an abusive relationship.
Our findings exhibit no significant change in women’s attitudes towards husband’s right to use violence or her right to refuse sexual intercourse without her consent. The last row of Table 6 shows the results for the overall gender attitudes index and it is insignificant. We fail to find any evidence of a change in women’s gender attitudes among women that were raised in rural areas.
Table 6: Education Effects on Gender Attitudes by Childhood Region
ALL WOMEN RURAL
(1) (2) (3) (4) (5) (6)
VARIABLES OLS Linear RD IV OLS Linear RD IV
Disagree: a woman should not 0.033*** -0.041 -0.129 0.041*** -0.011 -0.013
argue with her husband (10.292) (-0.716) (-0.473) (6.495) (-0.116) (-0.116)
Mean 0.67 0.67 0.67 0.61 0.61 0.61
Bandwidth 54 54 54 55 55 55
Observations 1,428 1,428 1,428 517 517 517
Disagree: a woman cannot spend 0.016*** 0.083* 0.110 0.011 0.170 0.164
her own money (5.293) (-1.974) (-1.330) (1.635) (-1.646) (-0.994)
Mean 0.70 0.70 0.70 0.66 0.66 0.66
Bandwidth 76 76 76 55 55 55
Observations 1,969 1,969 1,969 508 508 508
Agree: equal housework 0.023*** -0.075* -0.114 0.022*** -0.037 -0.027
(8.369) (-1.811) (-1.148) (4.094) (-0.441) (-0.424)
Mean 0.73 0.73 0.73 0.67 0.67 0.67
Bandwidth 80 80 80 63 63 63
Observations 2,153 2,153 2,153 611 611 611
Disagree: children can be beaten 0.019*** 0.008 0.012 0.025*** -0.006 -0.004
(6.797) (0.200) (0.204) (4.668) (-0.080) (-0.081)
Mean 0.75 0.75 0.75 0.68 0.68 0.68
Bandwidth 82 82 82 81 81 81
Observations 1,815 1,815 1,815 767 767 767
Disagree: men are responsible 0.034*** -0.019 -0.032 0.028*** -0.015 -0.010
for women’s actions (11.129) (-0.423) (-0.380) (4.923) (-0.204) (-0.209)
Mean 0.63 0.63 0.63 0.57 0.57 0.57
Bandwidth 82 82 82 80 80 80
Observations 2,101 2,101 2,101 753 753 753
Disagree: men can use violence 0.026*** 0.051 0.063 0.022*** 0.106 0.108
in certain situations (7.019) (0.886) (0.882) (3.203) (1.038) (0.872)
Mean 0.66 0.66 0.66 0.61 0.61 0.61
Bandwidth 61 61 61 58 58 58
Observations 1,554 1,554 1,554 531 531 531
Disagree: women cannot refuse 0.003*** 0.005 0.007 0.003 0.035 0.020
having sex if husband wants (2.895) (0.448) (0.436) (1.592) (1.407) (1.277)
Mean 0.98 0.98 0.98 0.97 0.97 0.97
Bandwidth 66 66 66 73 73 73
Observations 1,733 1,733 1,733 685 685 685
Gender attitudes index 0.048*** -0.041 -0.071 0.053*** 0.011 0.011
(13.080) (-0.836) (-0.639) (7.712) (0.115) (0.120)
Mean 0.05 0.05 0.05 -0.07 -0.07 -0.07
Bandwidth 62 62 62 56 56 56
Observations 1,693 1,693 1,693 526 526 526
Note: Data are from 2014 TNRDVW. Column (1)-(3) list OLS, local linear RD and IV estimates,
respec-tively. Columns (4)-(6) report the above mentioned estimates for the subsample of women who grew up in rural areas. January 1987 is chosen as cutoff in all specifications. Below the point estimates are t-statistics, means, optimal CCT bandwidths and observations included in each regression. All specifications include month of birth fixed effects, region fixed effects and childhood rural or urban region dummies and their interactions as controls. Standard errors are clustered at the month-year cohort level ***, **, * indicate the significance at 1%, 5%, 10% levels, respectively.
4.2
Labor Market Outcomes
We continue our analysis by examining the effect of the Compulsory Schooling Law on labor market outcomes for women. We include information on women’s
employment status, employed sector, social security status and ownership of financial assets that generates income – land, house, company/business, vehicle, bank savings and other in regressions. The survey data does not contain
information about women or household income.
The OLS estimates indicate a positive relationship between education and labor market outcomes. An additional year of schooling implies higher probability of better labor market position and more access to financial assets, and naturally less probability of being employed in agricultural sector.
We find no evidence of a significant change caused by the education reform. The first, fourth and last rows of Table 7 indicate insignificant RD and IV estimates which refute the positive effect of the Compulsory Schooling Law on access to resources and economic empowerment of women. Therefore, we must seek for changes in other channels to explain the causal relationship between increased schooling and violence against women.
Table 7: Education Effects on Labor Market Outcomes by Childhood Region
ALL WOMEN RURAL
(1) (2) (3) (4) (5) (6)
VARIABLES OLS Linear RD IV OLS Linear RD IV
Employed 0.033*** -0.014 -0.027 0.021*** -0.012 -0.007 (11.183) (-0.405) (-0.357) (3.654) (-0.174) (-0.174) Mean 0.28 0.28 0.28 0.22 0.22 0.22 Bandwidth 94 94 94 64 64 64 Observations 2,292 2,292 2,292 569 569 569 Employed in agriculture -0.003*** 0.001 0.001 -0.002 -0.037 -0.019 (-3.471) (0.070) (0.071) (-0.933) (-1.331) (-1.214) Mean 0.02 0.02 0.02 0.04 0.04 0.04 Bandwidth 72 72 72 83 83 83 Observations 1,788 1,788 1,788 800 800 800 Employed in service 0.040*** -0.006 -0.010 0.027*** -0.020 -0.020 (14.987) (-0.174) (-0.168) (4.731) (-0.307) (-0.294) Mean 0.21 0.21 0.21 0.13 0.13 0.13 Bandwidth 87 87 87 55 55 55 Observations 2,164 2,164 2,164 526 526 526 Social security 0.042*** 0.047 0.070 0.028*** 0.057 0.035 (16.043) (1.349) (1.403) (5.801) (1.157) (1.196) Mean 0.19 0.19 0.19 0.12 0.12 0.12 Bandwidth 78 78 78 74 74 74 Observations 1,915 1,915 1,915 700 700 700 Ownership index 0.027*** -0.051 -0.078 0.026*** -0.086 -0.050 (7.425) (-1.181) (-0.855) (4.388) (-1.278) (-1.097) Mean -0.06 -0.06 -0.06 -0.08 -0.08 -0.08 Bandwidth 89 89 89 79 79 79 Observations 2,098 2,098 2,098 751 751 751
Note: Data are from 2014 TNRDVW. Column (1)-(3) list OLS, local linear RD and IV estimates,
respectively. Columns (4)-(6) report the above mentioned estimates for the subsample of women who grew up in rural areas. January 1987 is chosen as cutoff in all specifications. Below the point estimates are t-statistics, means, optimal CCT bandwidths and observations included in each regression. All specifications include month of birth fixed effects, region fixed effects and childhood rural or urban region dummies and their interactions as controls. Standard errors are clustered at the month-year cohort level ***, **, * indicate the significance at 1%, 5%, 10% levels, respectively.
4.3
Marriage Market Outcomes
We continue by exploring the effect of the Compulsory Schooling Law on marriage partner characteristics. Increased years of schooling for women might have an impact on their intimate partner choices. More selective individuals would be more likely to marry men with better social and economic backgrounds.
The data only includes information about last partners of the respondents.
Therefore, results and analyses in this section is attributed to explaining the causal relationship between female education and domestic violence from last partner. The OLS estimates for marriage market outcomes are listed in column (1) of Table 4.3. It appears that schooling is positively correlated with marriage age and partner’s years of schooling. The impact of an additional year of female schooling leads to a decline of schooling differences between partners by 0.44 years which is 37 percent less than the average and decreases the husband’s addictive behavior index which comprises of averaging z-scores of drinking, smoking, drug abuse and gambling behavior. The differential effects of increased education for women raised in rural areas is by larger margin except for marriage age and marriage decision (see column (4) of Table 4.3). To examine the RD treatment effects, located in columns (2)-(3) of Table 4.3, the education reform increased the probability of women exercising their choice of partners by 3.7 ppt, while divorce rates have gone down by 4.7 ppt. Husband’s propensity of being employed has increased by 8.6 ppt which corresponds to 7.9 percent above the average. Moreover, the likelihood of the husband having
experienced violence while being raised has decreased by 11.4 ppt which coincides to 42.2% below the average. Estimates obtained form local linear RD regressions outperform IV in terms of efficiency. Therefore only partner’s employment status IV estimate is statistically significant.
We hypothesize that the marriage market outcomes and improved partner
characteristics have a dominant role in fighting domestic violence. Our results are consistent with those of Benham (1974) and Lefgren and McIntyre (2006). The role of education is effective before marriage as women become better at selecting partners. Lefgren and McIntyre (2006) finds that a quarter of a year increase in female schooling corresponds to a $4000 increase in husband’s earnings and leads to
better welfare for women.
Women’s improved partner choice can also be observed from the domestic violence outcomes as well. We find that the decline in physical violence act mostly stems from the reduction of those with sever health damage. Partners who use violence as an instrument to control women should be more likely to use mild physical or psychological violence. However, partners’ use of severe physical violence for
exerting control over resources is less intuitive, since it also hinders women’s ability to work. It is logical to infer that the reason behind sever physical violence is rather mental psychological than economic. Therefore, increased education for women enhanced their marital foresight and partner selection competence.
Table 8: Education Effects on Marriage Outcomes by Childhood Region
ALL WOMEN RURAL
(1) (2) (3) (4) (5) (6)
VARIABLES OLS Linear RD IV OLS Linear RD IV
Marriage age 0.373*** 0.259 0.529 0.327*** 0.286 0.395 (13.853) (0.650) (0.554) (5.987) (0.428) (0.416) Mean 20.35 20.35 20.35 19.96 19.96 19.96 Bandwidth 48 48 48 47 47 47 Observations 1,146 1,146 1,146 419 419 419 Marriage decision 0.037*** 0.112** 0.236 0.032*** 0.228*** 0.223 (9.109) (2.238) (0.964) (4.756) (2.876) (1.427) Mean 0.60 0.60 0.60 0.52 0.52 0.52 Bandwidth 50 50 50 55 55 55 Observations 1,189 1,189 1,189 475 475 475 Partner employed -0.001 0.086*** 0.132* 0.006 0.074 0.052 (-0.370) (3.231) (1.719) (1.422) (1.527) (1.411) Mean 0.92 0.92 0.92 0.92 0.92 0.92 Bandwidth 85 85 85 68 68 68 Observations 2,092 2,092 2,092 637 637 637 Partner schooling 0.555*** 0.237 0.639 0.502*** 0.667 0.830 (22.891) (0.535) (0.585) (11.867) (0.893) (0.932) Mean 9.47 9.47 9.47 8.56 8.56 8.56 Bandwidth 54 54 54 49 49 49 Observations 1,373 1,373 1,373 469 469 469 Schooling difference -0.443*** 0.068 0.129 -0.530*** 0.241 0.264 (-21.556) (0.193) (0.180) (-11.758) (0.317) (0.279) Mean 1.19 1.19 1.19 1.78 1.78 1.78 Bandwidth 62 62 62 56 56 56 Observations 2,324 2,324 2,324 523 523 523 Age difference -0.089* -0.471 -1.068 -0.011 0.233 0.378 (-1.789) (-0.946) (-0.629) (-0.144) (0.197) (0.191) Mean 4.67 4.67 4.67 4.60 4.60 4.60
Table 8 – continued from previous page
ALL WOMEN RURAL
(1) (2) (3) (4) (5) (6)
VARIABLES OLS Linear RD IV OLS Linear RD IV
Bandwidth 53 53 53 46 46 46 Observations 1,210 1,210 1,210 405 405 405 Partner’s age -0.077 -0.620 -1.603 -0.029 -0.376 -0.518 (-1.609) (-1.327) (-0.693) (-0.407) (-0.315) (-0.319) Mean 32.80 32.80 32.80 32.74 32.74 32.74 Bandwidth 57 57 57 48 48 48 Observations 1,303 1,303 1,303 427 427 427 Partner’s addictive -0.017*** 0.115 0.180 -0.022*** 0.010 0.006 behavior index (-2.923) (1.454) (0.960) (-2.653) (0.101) (0.101) Mean 0.03 0.03 0.03 0.07 0.07 0.07 Bandwidth 62 62 62 96 96 96 Observations 1,713 1,713 1,713 909 909 909 Partner’s mother 0.000 0.051 -0.168 -0.011 0.000 0.000 faced violence (0.037) (0.885) (-0.370) (-1.162) (0.000) (0.000) Mean 0.91 0.91 0.91 0.92 0.92 0.92 Bandwidth 76 76 76 64 64 64 Observations 448 448 448 128 128 128 Partner experienced -0.004 -0.114** -0.258 -0.000 -0.035 -0.029 violence (-1.099) (-2.504) (-1.100) (-0.009) (-0.382) (-0.387) Mean 0.27 0.27 0.27 0.28 0.28 0.28 Bandwidth 78 78 78 67 67 67 Observations 1,596 1,596 1,596 527 527 527 Divorced 0.000 -0.047** -0.082 0.002 0.011 0.010 (0.180) (-2.238) (-1.236) (0.774) (0.357) (0.370) Mean 0.06 0.06 0.06 0.04 0.04 0.04 Bandwidth 65 65 65 76 76 76 Observations 1,561 1,561 1,561 668 668 668 Remarried -0.003* -0.019 -0.030 -0.003* -0.001 -0.001 (-1.947) (-1.110) (-0.849) (-1.753) (-0.038) (-0.038) Mean 0.03 0.03 0.03 0.03 0.03 0.03 Bandwidth 69 69 69 81 81 81 Observations 1,788 1,788 1,788 771 771 771 Household asset -0.006 0.006 0.015 -0.009 0.070 0.058 ownership index (-1.352) (0.135) (0.135) (-0.640) (0.640) (0.610) Mean 0.01 0.01 0.01 -0.01 -0.01 -0.01 Bandwidth 61 61 61 63 63 63 Observations 1,549 1,549 1,549 602 602 602
Note: Data are from 2014 TNRDVW. Column (1)-(3) list OLS, local linear RD and IV estimates,
respectively. Columns (4)-(6) report the above mentioned estimates for the subsample of women who grew up in rural areas. January 1987 is chosen as cutoff in all specifications. Below the point estimates are t-statistics, means, optimal CCT bandwidths and observations included in each regression. All specifications include month of birth fixed effects, region fixed effects and childhood rural or urban region dummies and their interactions as controls. Standard errors are clustered at the month-year cohort level ***, **, * indicate the significance at 1%, 5%, 10% levels, respectively.
CONCLUSION
The evidence in this study suggests that the Compulsory Schooling Law increased the years of schooling for women by a half-year. The effect of the reform had larger effect on women who grew up in rural regions by increasing years of schooling by 1.8 years. On the other hand, we find no evidence of a differential impact of the
schooling law on the urban childhood subsample.
Increased education had an overall non-positive effect on domestic violence
outcomes. We report a significant decline in sexual violence and physical violence which is mainly driven by a decrease in offensive incidences with severe health damage. The decrease in the latter category is larger for women raised in rural regions. There is no evidence of a change in psychological violence, social control behavior and financial control behavior.
We also examine the causal channels through which education translates into lower levels domestic violence. We find that the Compulsory Schooling Law had no causal impact on labor market outcomes, while women’s gender attitudes have improved slightly. However, the education reform increased the probability of women
exercising their choice of partners, while divorce rates have gone down. Husband’s likelihood of being employed has increased. Additionally, the probability of the husband having experienced violence while being raised has decreased. These results
relate to the studies that link female education with better marriage matches and partner’s higher income.
Although the 1997 Compulsory Schooling Law did not successfully achieve female economic empowerment, overall, we can infer that the reform was significantly effective in fighting domestic violence against women.
BIBLIOGRAPHY
Aguero, J. (2013). Causal estimates of the intangible costs of violence against women in latin america and the caribbean. Technical report, IDB Working Paper Series. Aizer, A. (2010). The gender wage gap and domestic violence. The American economic
review, 100(4):1847.
Benham, L. (1974). Benefits of women’s education within marriage. Journal of Political Economy, 82(2, Part 2):S57–S71.
Bobonis, G. J., Gonz, M., Castro, R., et al. (2013). Public transfers and domestic violence: The roles of private information and spousal control. American Economic Journal: Economic Policy, 5(1):179–205.
Calonico, S., Cattaneo, M. D., and Titiunik, R. (2014). Robust nonparametric confi-dence intervals for regression-discontinuity designs. Econometrica, 82(6):2295–2326. Carrell, S. E. and Hoekstra, M. (2012). Family business or social problem? the cost of unreported domestic violence. Journal of Policy Analysis and Management, 31(4):861–875.
Carrell, S. E. and Hoekstra, M. L. (2010). Externalities in the classroom: How children exposed to domestic violence affect everyone’s kids. American Economic
Journal: Applied Economics, 2(1):211–28.
DESA, U. (2010). The world’s women 2010: Trends and statistics. United Nations Department of Economic and Social Affairs.
Din¸cer, M. A., Kaushal, N., and Grossman, M. (2014). Women’s education: Harbinger of another spring? evidence from a natural experiment in turkey. World
Develop-ment, 64:243–258.
Duvvury, N., Callan, A., Carney, P., and Raghavendra, S. (2013). Intimate partner violence: Economic costs and implications for growth and development. Women’s
Erten, B. and Keskin, P. (2016). For better or for worse?: Education and the preva-lence of domestic viopreva-lence in turkey. American Economic Journal: Applied
Eco-nomics.
Eswaran, M. and Malhotra, N. (2011). Domestic violence and women’s autonomy: Evidence from india. accepted at Canadian Journal of Economics.
Farmer, A. and Tiefenthaler, J. (2003). Explaining the recent decline in domestic violence. Contemporary Economic Policy, 21(2):158–172.
Gulesci, S. and Meyersson, E. (2012). For the love of the republic: education, religion, and empowerment. Unpublished working paper.
Hidrobo, M. and Fernald, L. (2013). Cash transfers and domestic violence. Journal of Health Economics, 32(1):304–319.
Imbens, G. W. and Lemieux, T. (2008). Regression discontinuity designs: A guide to practice. Journal of econometrics, 142(2):615–635.
Lefgren, L. and McIntyre, F. (2006). The relationship between women’s education and marriage outcomes. Journal of labor Economics, 24(4):787–830.
McCrary, J. (2008). Manipulation of the running variable in the regression disconti-nuity design: A density test. Journal of Econometrics, 142(2):698–714.
Ministry of National Education (2011). National education statistics formal education 2010-2011.
Rao, Vijayendra Bloch, F. (1999). Terror as a Bargaining Instrument: A Case Study of Dowry Violence in Rural India. The World Bank.
Santos, C. (2013). Costs of domestic violence: A life satisfaction approach*. Fiscal
Studies, 34(3):391–409.
Stevenson, B. and Wolfers, J. (2006). Bargaining in the shadow of the law: Divorce laws and family distress. The Quarterly Journal of Economics, 121(1):267–288.
APPENDIX
Table 9: Summary Statistics for 23-32 Year Old Women by Childhood Region
Childhood Region
VARIABLES All women Rural Urban Difference (3) - (2)
(1) (2) (3) (4)
Mean Mean Mean Estimate
(SD) (SD) (SD) (SE)
Obs Obs Obs
Education
Years of Schooling 8.255 6.816 8.949 2.13***
(4.196) (3.852) (4.188) (0.00)
1,349 495 837
Junior Highschool Completion 0.624 0.469 0.697 0.23***
(0.484) (0.500) (0.460) (0.00)
1,270 449 804
Highschool Completion 0.406 0.266 0.472 0.21***
(0.491) (0.442) (0.499) (0.00)
1,270 449 804
Primary school Completion 0.939 0.923 0.945 0.02
(0.240) (0.267) (0.227) (0.21)
1,270 449 804
Domestic Violence Indices
Physical Violence -0.029 0.001 -0.045 -0.05
(0.732) (0.785) (0.703) (0.38)
1,348 495 836
Severe Physical Violence -0.001 0.023 -0.017 -0.04
(0.835) (0.931) (0.779) (0.53)
1,348 495 836
Mild Physical Violence -0.057 -0.021 -0.074 -0.05
(0.781) (0.796) (0.775) (0.31) 1,348 495 836 Psychological Violence 0.042 0.028 0.049 0.02 (0.779) (0.751) (0.792) (0.69) 1,348 495 836 Sexual Violence 0.002 0.011 0.002 -0.01 (0.798) (0.755) (0.826) (0.87) 1,348 495 836
Social Control Behavior 0.075 0.097 0.062 -0.03
(0.589) (0.556) (0.606) (0.35)
1,348 495 836
Financial Control Behaviour -0.011 0.005 -0.019 -0.02
(0.689) (0.724) (0.670) (0.61)
1,339 493 829
Table 9 – continued from previous page Childhood Region
VARIABLES All women Rural Urban Difference (3) - (2)
(1) (2) (3) (4)
Mean Mean Mean Estimate
(SD) (SD) (SD) (SE)
Obs Obs Obs
Gender Attitudes
Disagree: a woman should not 0.669 0.613 0.694 0.08***
argue with her husband (0.471) (0.488) (0.461) (0.01)
1,334 486 832
Agree: a woman can 0.702 0.656 0.725 0.07**
spend her own money (0.458) (0.475) (0.447) (0.03)
1,337 492 830
Agree: a man should help 0.718 0.680 0.740 0.06
with housework (0.450) (0.467) (0.439) (0.05)
1,342 492 833
Disagree: children can be beaten, 0.740 0.685 0.770 0.08***
for discipline (0.439) (0.465) (0.421) (0.00)
1,340 492 832
Disagree: men are responsible 0.626 0.569 0.659 0.09***
for women’s actions (0.484) (0.496) (0.474) (0.01)
1,328 484 828
Disagree: a man can use violence 0.658 0.620 0.682 0.06
in certain situations (0.475) (0.486) (0.466) (0.05)
1,280 473 790
Disagree: a woman cannot refuse 0.884 0.896 0.869 -0.03**
to have sex with husband (0.321 ) (0.305) (0.337) (0.022)
1,161 484 687
Gender attitudes index 0.036 -0.064 0.091 0.16***
(0.513) (0.534) (0.491) (0.00)
1,349 495 837
Labor Market Outcomes
Employed 0.258 0.190 0.291 0.10*** (0.437) (0.393) (0.455) (0.00) 1,262 454 791 Employed in agriculture 0.019 0.037 0.010 -0.03*** (0.136) (0.188) (0.099) (0.01) 1,349 495 837 Employed in service 0.200 0.119 0.241 0.12*** (0.400) (0.324) (0.428) (0.00) 1,349 495 837 Social security 0.176 0.098 0.214 0.12*** (0.381) (0.298) (0.411) (0.00) 1,349 495 837 Ownership index -0.051 -0.089 -0.030 0.06 (0.487) (0.438) (0.511) (0.05) 1,349 495 837 Marriage Outcomes Marriage age 20.328 19.926 20.519 0.59*** (3.210) (3.152) (3.225) (0.01) 1,224 460 751 Marriage decision 0.598 0.518 0.643 0.12*** (0.490) (0.500) (0.480) (0.00) 1,225 461 751 Partner employed 0.931 0.914 0.941 0.03 (0.254) (0.281) (0.235) (0.10) 1,345 493 835 Partner schooling 9.454 8.482 9.937 1.46*** (3.842) (3.589) (3.879) (0.00) 1,343 493 833 Schooling difference 1.190 1.675 0.971 -0.70***
Table 9 – continued from previous page Childhood Region
VARIABLES All women Rural Urban Difference (3) - (2)
(1) (2) (3) (4)
Mean Mean Mean Estimate
(SD) (SD) (SD) (SE)
Obs Obs Obs
(3.608) (3.589) (3.608) (0.00) 1,343 493 833 Age difference 4.668 4.457 4.765 0.31 (4.348) (4.704) (4.154) (0.30) 1,223 459 751 Partner’s age 32.723 32.695 32.738 0.04 (4.807) (5.206) (4.598) (0.90) 1,223 459 751
Partner’s addictive behavior index 0.025 0.122 -0.019 -0.14***
(0.770) (0.680) (0.803) (0.00)
1,346 494 835
Partner’s mother faced violence 0.901 0.903 0.899 0.00
(0.299) (0.298) (0.302) (0.94)
301 100 199
Partner experienced violence 0.269 0.276 0.265 -0.01
(0.444) (0.448) (0.442) (0.73) 1,117 406 701 Divorced 0.053 0.033 0.065 0.03 (0.224) (0.179) (0.246) (0.03) 1,225 461 751 Remarried 0.027 0.018 0.032 0.01 (0.162) (0.134) (0.176) (0.20) 1,349 495 837
Household asset ownership index -0.006 -0.057 0.019 0.08***
(0.298) (0.315) (0.287) (0.00)
1,349 495 837
Covariates
Non Turkish Interview Language 0.008 0.003 0.003 0.00
(0.087) (0.050) (0.057) (0.83)
1,349 495 837
Childhood region: Rural 0.338 1.000 0.000 1.000***
(0.473) (0.000) (0.000) (0.000)
1,332 495 837
Childhood region: North 0.166 0.255 0.121 -0.13***
(0.372) (0.437) (0.327) (0.00)
1,349 495 837
Childhood region: West 0.392 0.238 0.463 0.22***
(0.488) (0.426) (0.499) (0.00)
1,349 495 837
Childhood region: South 0.089 0.106 0.080 -0.03
(0.284) (0.308) (0.272) (0.19)
1,349 495 837
Childhood region: Central 0.174 0.190 0.168 -0.02
(0.379) (0.393) (0.374) (0.34)
1,349 495 837
Childhood region: East 0.179 0.210 0.167 -0.04
(0.384) (0.408) (0.373) (0.08)