RESEARCH ARTICLE
Cite this: Med. Chem. Commun., 2017, 8, 81
Received 15th July 2016, Accepted 27th September 2016
DOI: 10.1039/c6md00392c
www.rsc.org/medchemcomm
Quinoides and VEGFR2 TKIs influence the fate of
hepatocellular carcinoma and its cancer stem
cells
†‡
Deniz Cansen Kahraman,
aGilles Hanquet,
bLoïc Jeanmart,
cSteve Lanners,
cPeter
Šramel,
deAndrej Bohá
č*
deand Rengul Cetin-Atalay*
fBioactivities of quinoides 1–5 and VEGFR2 TKIs 6–10 in hepatocellular cancer (HCC) and cancer stem cells (HCSCs) were studied. The compounds exhibited IC50values inμM concentrations in HCC cells. Quinoide
3 was able to eradicate cancer stem cells, similar to the action of the stem cell inhibitor DAPT. However, the more cytotoxic VEFGR TKIs (IC50: 0.4–3.0 μM) including sorafenib, which is the only FDA approved drug
for the treatment of HCC, enriched the hepatocellular cancer stem cell population by 2–3 fold after treat-ment. An aggressiveness factor (AF) was proposed to quantify the characteristics of drug candidates for
their ability to eradicate the CSC subpopulation. Considering the tumour heterogeneity and marker positive cancer stem cell like subpopulation enrichment upon treatments in patients, this study emphasises the im-portance of the chemotherapeutic agent choice acting differentially on all the subpopulations including marker-positive CSCs.
Introduction
Hepatocellular carcinoma (HCC) is the sixth most frequent and second most deadly cancer worldwide.1HCC patients are resistant to chemotherapy and radiotherapy, because conven-tional therapies can only reduce the bulk of the tumour mass but are unable to restrain tumour regrowth and relapse. HCC is a highly heterogeneous tumour in terms of morphology and clinical outcome.2The enrichment of cancer stem cells is one of the main reasons behind failure in treatment of HCC patients. Sorafenib (6), a multi-kinase inhibitor acting on VEGFR2-TK and also the only FDA approved drug for the treatment of HCC patients, inhibits proliferation and migra-tion of tumour cells and angiogenesis. Recently, it has been reported that many patients develop resistance to sorafenib. This was explained by the enrichment of cancer stem cells that have the capacity to self-renew, differentiate into cancer
cells and acquire resistance to chemotherapy in most of the cancer types.3,4 Hence, it is crucial to develop novel drugs against the differentiated cancer cells as well as liver cancer stem cells in order to successfully eradicate liver cancer. Liver cancer stem cells could be identified and isolated by several surface markers including CD133, CD90, CD44, CD13, EpCAM, OV-6, CD24, DLK1 and ICAM-1.5Cells that carry one or two of these markers were shown to possess CSC features.
The epithelial–mesenchymal transition (EMT) is a critical step for stemness. In this study, we have selected liver cancer cell lines with different phenotypic properties based on their genotypes. Huh7 and Hep3B cells are known to have epithe-lial features (well-differentiated), whereas Mahlavu and SNU-475 cells were characterized as mesenchymal-like (poorly-dif-ferentiated) cells.6Huh7 and Hep3B cells express genes asso-ciated with epithelial like properties. These cells express the HCC marker AFP along with the epithelial marker E-cadherin, while Mahlavu and SNU-475 cells don't express AFP and E-cadherin genes while they express high levels of vimentin protein.6Furthermore, Huh7 and Hep3B cells have normal migratory properties, but Mahlavu and SNU-475 cells have high migratory properties which may be due to their dif-ferential PI3K/Akt pathway activities. It was shown that Mahlavu and SNU-475 cells have constitutively active Akt pro-tein due to loss of the PTEN tumor suppressor.7 Current studies and clinical trials focus on the anti-CSC compounds targeting extracellular mediators or cell surface molecules as well as molecules involved in EMT and metastasis.8 Thus, it is crucial to define which marker is efficient to detect and
aDept. of Mol. Biol. and Gen., Bilkent University, Ankara, 06800, Turkey bLaboratoire Syncat, UMR CNRS 7509, ECPM, Université de Strasbourg, 25 rue
Becquerel, 67087 Strasbourg, France
cDepartment of Chemistry and Namur Medicine & Drug Innovation Center
(NAMEDIC), University of Namur, 61 rue de Bruxelles, 5000 Namur, Belgium
dFaculty of Natural Sciences, Comenius University, Ilkovičova 6,
Mlynskádolina842 15 Bratislava (PŠ, AB), Slovakia
eBiomagi Ltd., Mamateyova 26, 851 04 Bratislava, Slovakia
fCancer Systems Biology Laboratory, Graduate School of Informatics, ODTU,
Ankara, 06800, Turkey. E-mail: [email protected] † The authors declare no competing interests.
‡ Electronic supplementary information (ESI) available. See DOI: 10.1039/ c6md00392c
Published on 07 October 2016. Downloaded on 6/18/2018 1:30:16 PM.
View Article Online
analyse cancer stem cell markers in each cell line, which we studied by flow cytometry.
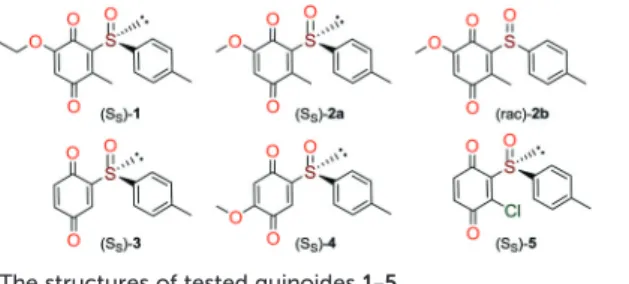
Quinones and quinone-like compounds seem to be prom-ising candidates against cancer stem cells; however, they are mainly organotoxic. It has been reported that minor changes in the side chains of the quinone structure can lead to a strong variation in the biological toxicity;9–11 thus, modelization of various quinoid derivatives with strong in-hibitory activity and low toxicity is conceivable. Therefore, we prepared a series of quinoides, 1–5 (Fig. 1), and evaluated their activities in different HCC cell lines and their cancer stem cell (HCSC) population (Tables 1, 2A and B and Fig. 5). Furthermore, VEGFR2 TKIs 6–10 (Fig. 2) were also screened in HCC cell lines (Tables 1 and 2A). Compound 6 is sorafenib tosylate (Nexavar®), and compound 9 was developed by GlaxoSmithKline as a drug candidate to inhibit VEGFR2 TK. Compounds 7, 8 and 10 were designed by Biomagi, Ltd. to modulate VEGFR2 TK activity.
Results and discussion
Chemistry
Compounds 1, 2a and 2b were prepared according to our pre-vious work starting from commercially available 2-methylhydroquinone (S1) (Scheme 1).12
Compounds 3 and 5 were prepared (Scheme 2) according to Carreño's procedure with slight modifications (see the ESI‡).13–15
The new quinoide 4 was obtained from vanillin (S7) in very good overall yield using the sequence depicted in Scheme 3.
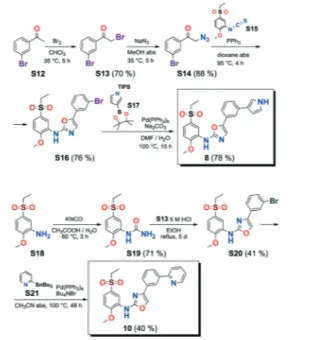
VEGFR2 TKI 6 was obtained from Bayer Inc. Synthesis of 7 was described by Lintnerová et al.16 Compound 9 was pre-pared according the procedure described by Harris et al.17 Novel compounds 8 and 10 were synthesized using the se-quence depicted in Scheme 4 (see also the ESI‡).
Biological evaluation
Bioactivities of quinoides and VEGFR2-TKs in HCC cells. NCI-SRB assay was initially performed to define the inhibi-tory concentrations (IC50values) of compounds in HCC cell lines Huh7, Hep3B, and Mahlavu. Results have shown that al-most all compounds (except for 5) had IC50values inμM con-centrations for all cell lines (Table 1). DAPT (γ-secretase in-hibitor) was used as a control for CSC inhibition.
Expression of cancer stem cell markers in HCC cell lines. CSC marker expression varies among cell lines of HCC, since
Table 1 Screening of quinoides 1–5 and VEGFR2-TKIs 6–10 in HCC cell lines
Compound
IC50(μM)a
Huh7 Hep3B Mahlavu
1 7.0 ± 0.8 12.0 ± 1.7 18.3 ± 0.8 2a 8.0 ± 0.9 5.5 ± 1.8 14.5 ± 1.3 2b 5.5 ± 0.4 4.3 ± 0.7 11.6 ± 0.2 3 20.0 ± 1.7 17.4 ± 2.1 31.3 ± 0.3 4 10.6 ± 2.0 9.9 ± 2.3 11.3 ± 0.6 5 Ni Ni Ni 6 1.6 ± 0.8 1.5 ± 0.3 0.7 ± 0.4 7 2.8 ± 1.3 2.0 ± 0.9 3.0 ± 0.5 8 1.7 ± 0.7 2.1 ± 0.3 0.8 ± 0.5 9 1.5 ± 0.7 0.7 ± 0.1 1.2 ± 0.4 10 0.4 ± 0.3 0.9 ± 0.3 1.1 ± 0.7 DAPT 5.0 ± 1.2 5.0 ± 2.0 5.0 ± 1.5
aExperiments were performed in triplicate; Ni: no growth inhibition.
Fig. 2 VEGFR2 TKIs 6–10 used in this study and their origin and VEGFR2 IC50 activities that were obtained through a commercial
service in Germany (www.proqinase.com).
liver CSCs exist heterogeneously and these features determine the characteristics of the cancer (tumourigenicity and meta-static tendency). It has previously been reported that the epi-thelial cell adhesion molecule (EpCAM) and CD133 express-ing cells are more likely to execute epithelial features, whereas CD90 expressing cells are more likely to be mesen-chymal.18,19 Expression of these markers in HCC cell lines was analyzed using flow cytometry. It was shown that CSCs of Huh7 cells could be identified by CD133 and EpCAM positiv-ity (20–30%). CSCs of Mahlavu and SNU-475 could be identi-fied by CD90 positivity (0.2–0.6%) (Fig. 3).
As stated above, the EMT is critical for cancer cell stemness. Huh7 and Hep3B cells carry epithelial features, whereas Mahlavu and SNU-475 cells carry migratory mesenchymal-like properties.6,7 Furthermore, Huh7 and Hep3B cells differ in their p53 gene status: Huh7 cells express p53IJY220S), but Hep3B cells are null for the TP53 gene.
There-fore, the expression of mutant p53 causes differential activa-tion of the β-catenin protein and its downstream mesenchy-mal proteins such as E-cadherin, vimentin, snail and slug. The significantly higher expression ofβ-catenin20due to the lack of p53 protein in Hep3B cells correlates with the higher expression of EpCAM and CD133 markers in this cell (Fig. 3).
Effects of quinoides and VEGFR2-TKIs on hepatocellular cancer stem cells (HCSCs). It is essential to discover novel compounds that were able to alter the enrichment of the CSC
Fig. 3 Flow cytometry analysis of HCC cell lines indicating the positivity of HCC cell lines for cancer stem cell markers CD133, EpCAM and CD90. Top row: IgG isotype controls, middle row: cells stained for CD133 and EpCAM markers, bottom row: cells stained for CD90.
Scheme 1 Preparation of quinones 1, 2a and 2b from 2-methylhydroquinone (S1).
Scheme 2 Syntheses of quinones 3 and 5 from 1,4-dimethoxybenzene.
Scheme 3 Synthesis of compound 4.
Scheme 4 Syntheses of 8 and 10.
unlike VEGFR2-TKIs, some of the quinoides were able to at-tenuate the CSC side population in Huh7 cells.
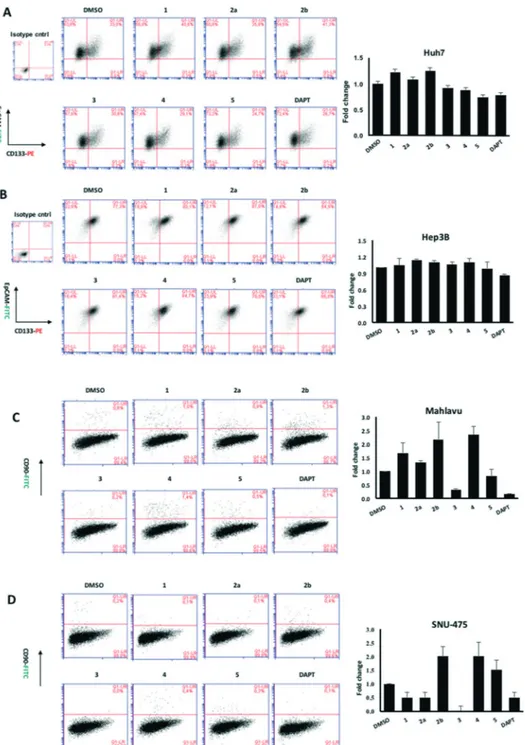
Due to the distinct dispersion of CD90 cells, we decided to include SNU-475 cells for testing the anti-HCSC activities of quinoides. Therefore, we also determined the bioactivities of quinoides in SNU475 cells. The IC50values were 5.5 ± 1.4, 10.5 ± 1.5, 6.1 ± 2.0, 0.3 ± 1.2, 9.0 ± 2.1, and 0.6 ± 1.1μM for com-pounds 1, 2a, 2b, 3, 4, and DAPT, respectively. No growth inhi-bition was observed for compound 5 (Fig. 5 and Table 2B).
Although compounds 6–10 were stronger HCC inhibiting agents as quinoides 1–5, they caused enrichment of Huh7 HCSCs in the rest of the HCC after treatment. Therefore, the positive cytotoxic effect of 6–10 was discredited by their abil-ity to leave the HCC residue fraction after treatment enriched with aggressive HCSC cells that are highly susceptible to dis-ease relapse and that acquired drug resistance frequently ob-served after HCC treatment in clinics.
Further analyses were carried out on Hep3B, Mahlavu and SNU-475 cells to test whether the same effect could be ob-served in other HCC cell lines as well. Among all compounds tested, 3 was able to attenuate the CSCs especially in mesenchymal-like cells, surpassing the efficacy of the stem
Conclusions
There is only one literature report describing macrocyclic benzoquinone herbimycin A [CAS: 70563-58-5, BRN: 4834067] that inhibits (61–78%) human bone marrow mesenchymal stem cells at 1–5 μM concentration.21We present here for the first time the screening of benzoquinone compounds in CSCs. One of the achievements of our pivotal study is identi-fication of quinoide 3 as an exceptional compound to treat HCSCs. Although its mechanism is not yet known, we hy-pothesize different behaviours of screened quinoides 1–5 based on their structural differences, benzoquinone reactivity and general medicinal chemistry knowledge. All quinoides 1–5 possess a chemically reactive benzoquinone fragment that can likely be an irreversible inhibitor binding to a bio-logical target e.g. by the Michael reaction with a cysteine amino acid residue. The most active quinoide 3 in Mahlavu and SNU-475 is the one that misses most of substitutions on its benzoquinone skeleton compared to the other tested quinoides. The steric and electronic properties of 3 could be a reason why quinoide 3 is the most active one included (Fig. 5). In the case of the SNU-475 tumour, there are three active quinoides (1, 2a and 3); therefore, other mechanismIJs) can also be included. As could be seen, all VEGFR2 TKIs 6–10 are cytotoxic to HCC cell lines (IC50= 3.0–0.4 μM, Table 1), and at the same time, they are less toxic towards HCSCs since it was observed that cancer stem cells were enriched up to 3 times after treatment (Fig. 5 and Table 2A). The most syner-gic case would be to identify cytotoxic compounds for both HCCs and HCSCs. The results obtained by screening of VEGFR2 TKIs can deliver two positive consequences: i) VEGFR2 TKIs can be used to enrich the % of stem cells in the final fraction before stem cell isolation for research pur-poses. Moreover, such stem cells can remember VEGFR2 TKI treatment and can be used for the development of the next generation of inhibitors. ii) It is obvious that experimental compounds can be differently cytotoxic towards heteroge-neous tumour cells. Their different influence on CSCs should be quantified separately because of its practical meaning.
In cancer therapeutics, it is important to identify treat-ment regimens against cancer stem cells as well as tumor cells, because patients suffer from relapse or incomplete re-covery after treatment if it fails to eliminate CSCs. The per-centage of DMSO treated cells in flow cytometry analysis rep-resents the initial CSC marker positivity of the cells before treatment (Fig. 4) Thus, we suggest that once the cells were treated with a compound, the number of cells with marker
Fig. 4 Expression of stem cell markers CD133 and EpCAM in Huh7 cells treated with (A) quinoides 1–5 and (B) VEGFR2-TKIs 6–10 as shown by flow cytometry analysis.
positivity can be compared with the DMSO control in order to define the fold change in the percentage of cancer stem cells. Since only the cells that stay alive after treatment are analyzed (see methods), it is important to emphasize the den-sity of the cancer stem cells before and after treatment. Therefore, the compounds that cause a decrease or enrich-ment in cancer stem cell population can be quantified simply by normalizing the treated cell population by DMSO controls.
Here, we suggest the aggressiveness factor (AF), a new characteristic quantifying the risk for certain compounds to be able to develop a more aggressive disease: AF(exp. cmpd.) = [(total number of CSCs after exp. cmpd. treatment)/(total number of CSCs before treatment)].
The low AFvalue is an indication for the quality of a drug candidate toward cancer cells. Such molecules don't possess drug resistance or induce more aggressive tumours (Table 2). AF
Fig. 5 Flow cytometry analysis of HCC cell lines after 72 hours of treatment with quinoides 1–5. (A) Huh7, (B) Hep3B, (C) Mahlavu, and (D) SNU-475. Cancer stem cells were defined by their positivity for CSC markers, CD133 together with EpCAM, or CD90. Each treatment was compared to its corresponding DMSO control to define the changes in percentage of double positive population. DAPT is used as positive control for CSC inhibition. The bar graphs indicate the fold change in positivity for markers between DMSO control and experimental groups.
as higher tumor-forming and metastasis capacities along with resistance to antitumor drugs which allows tumors to survive and relapse.8The analysis of the action of the chemo-therapeutics that deplete the CSC-like population by the fol-lowing surface markers may enumerate the qualities of the compounds and may allow one to assess their differential ac-tion. Our results represent parallel findings with sorafenib (6) and other compounds and allow comparative analysis of the compounds toward cancer stem cell marker positive cell populations. The AFconcept introduced in this study clearly demonstrates the differential action of the compounds.
It is known that patients used to develop resistance to-wards sorafenib (6). This is consistent with our data with sorafenib (6) having an AF value that is 2 fold higher com-pared to that of the DMSO control while maintaining good cytotoxicity through the low IC50values (Table 2A). However, the known CSC inhibitor (DAPT) has low AF values and its IC50is much higher than that for sorafenib (6). Furthermore, while quinoide 5 does not possess cytotoxic actions (for each HCC line) and 3 has high IC50values against Huh7, Hep3B or MV (Mahlavu) cells, they both significantly reduce the CSC marker positive subpopulations in mesenchymal Mahlavu and SNU-475 cells (Tables 2A and B).
The normalized aggressiveness factor allows selection of promising experimental compounds possessing lower proba-bility to form aggressive tumours in comparison to a particu-lar drug with known clinical behaviour. The methodology can serve as a simple and valuable tool for pre-clinical screening.
Experimental section
Syntheses of compounds 1–10
The syntheses and physicochemical properties of prepared organic compounds 1–10 can be found in the ESI.‡
Cell culture
Huh7 and Mahlavu, human hepatocellular carcinoma (HCC) cell lines, were maintained in Dulbecco's modified Eagle's medium (DMEM) (Invitrogen/GIBCO), supplemented with 10% fetal bovine serum (FBS) (Invitrogen/GIBCO) and 0.1 mM nonessential amino acid, whereas SNU-475 cells were maintained in RPMI (Invitrogen/GIBCO), supplemented 10% fetal bovine serum (FBS) and 2 mML-glutamine. Both media contained 100 units per mL penicillin and 100 units per mL streptomycin. Cells were grown at 37°C in a humidified incu-bator under 5% CO2.
ddH2O and dried. 50μl of 0.4% SRB dye (Sigma-Aldrich) was applied to each well and incubated at room temperature for 10 min. Each well was washed with 1% acetic acid and left for air-drying. SRB dye was solubilised using 100 μl per well 10 mM Tris-Base solution, and the absorbance was measured at 515 nm. The experiment was performed in triplicate, and the absorbance values were normalized to DMSO controls. Flow cytometry
HCC cells are inoculated into 100 mm2 culture dishes (100 000–200 000 cells). 24 hours later, cells were treated with the compounds (IC100conc.) for 72 hours. Dead cells that no lon-ger remained attached to the surface of the culture plates were discarded through vacuum aspiration and cells that remained attached were collected to be fixed with 4% para-formaldehyde for 30 minutes. Huh7 and Hep3B cells were stained for cancer stem cell markers using anti-CD133/1 (AC133)–biotin (Miltenyi, 130-090-664), anti-biotin–PE (Miltenyi, 130-090-756), and anti-EpCAM–FITC (Miltenyi, 130-080-301), whereas Mahlavu and SNU-475 cells were stained using anti-CD90–FITC (Miltenyi, 130-095-403). For isotype controls, mouse IgG1 isotype control–FITC conjugate (Miltenyi, 130-092-213) and mouse IgG1 isotype control anti-body–biotin conjugate (Miltenyi, 130-093-018) were used. Staining of cells was performed according to the manufac-turer's protocol. Cells were analyzed using the BD Accuri C6 Flow Cytometer and Software (BD Biosciences). The same staining procedure was applied for the analysis of HCC cells in order to determine the CSC marker positivity.
Acknowledgements
Liver cancer stem cell studies and DCK supported by TUBITAK grant #113S540. COST Actions: CM1106, CA15135, VEGA 1/0634/13, APV SK-FR-2015-0014 and Biomagi, Ltd. are acknowledged for chemistry. Sorafenib tosylate (6) was obtained as a gift from Bayer, Inc.
References
1 B. W. Stewart and C. P. Wild, World Cancer Report 2014, 2014. 2 T. Yamashita and X. W. Wang, J. Clin. Invest., 2013, 123(5),
1911–1918.
3 H.-W. Xin, C. M. Ambe, D. M. Hari, G. W. Wiegand, T. C. Miller, J. Q. Chen, A. J. Anderson, S. Ray, J. E. Mullinax, T. Koizumi, R. C. Langan, D. Burka, M. A. Herrmann, P. K. Goldsmith, A. Stojadinovic, U. Rudloff, S. S. Thorgeirsson and I. Avital, Gut, 2013, 62, 1777–1786.
4 A. K.-M. Chow, L. Ng, C. S.-C. Lam, S. K.-M. Wong, T. M.-H. Wan, N. S.-M. Cheng, T. C.-C. Yau, R. T.-P. Poon and R. W.-C. Pang, PLoS One, 2013, 8, e78675.
5 J.-H. Sun, Q. Luo, L.-L. Liu and G.-B. Song, World J. Gastroenterol., 2016, 22, 3547–3557.
6 H. Yuzugullu, K. Benhaj, N. Ozturk, S. Senturk, E. Celik, A. Toylu, N. Tasdemir, M. Yilmaz, E. Erdal, K. C. Akcali, N. Atabey and M. Ozturk, Mol. Cancer Ther., 2009, 8, 90. 7 I. Durmaz, E. B. Guven, T. Ersahin, M. Ozturk, I. Calis and
R. Cetin-Atalay, Phytomedicine, 2016, 23, 42–51.
8 F. Marcucci, C. Rumio and F. Lefoulon, Front. Radiat. Oncol., 2016, 6, 115.
9 T. J. Monks, R. P. Hanzlik, G. M. Cohen, D. Ross and D. G. Graham, Toxicol. Appl. Pharmacol., 1992, 112, 2–16.
10 T. J. Monks and D. C. Jones, Curr. Drug Metab., 2002, 3, 425–438. 11 K. Ollinger and A. Brunmark, J. Biolumin. Chemilumin.,
1991, 266, 21496–21503.
12 D. A. Lanfranchi and G. Hanquet, J. Organomet. Chem., 2006, 71, 4854–4861.
13 M. C. Carreño and J. L. García Ruano, Synthesis, 1992, 1992, 651–653.
14 M. C. Carreño, J. L. G. Ruano, M. A. Toledo and A. Urbano, Tetrahedron Lett., 1994, 35, 9759–9762.
15 M. A. Brimble, L. J. Duncalf and D. C. W. Reid, Tetrahedron: Asymmetry, 1995, 6, 263–269.
16 L. Lintnerová, M. García-Caballero, F. Gregáň, M. Melicherčík, A. R. Quesada, J. Dobiaš, J. Lác, M. Sališová and A. Boháč, Eur. J. Med. Chem., 2014, 72, 146–159.
17 P. A. Harris, M. Cheung, R. N. Hunter, M. L. Brown, J. M. Veal, R. T. Nolte, L. Wang, W. Liu, R. M. Crosby, J. H. Johnson, A. H. Epperly, R. Kumar, D. K. Luttrell and J. A. Stafford, J. Med. Chem., 2005, 48, 1610–1619.
18 T. Yamashita and S. Kaneko, J. Gastroenterol., 2014, 49, 1105–1110.
19 Z. F. Yang, D. W. Ho, M. N. Ng, C. K. Lau, W. C. Yu, P. Ngai, P. W. K. Chu, C. T. Lam, R. T. P. Poon and S. T. Fan, Cancer Cell, 2008, 13, 153–166.
20 T. Cagatay and M. Ozturk, Oncogene, 2002, 21, 7971–7980.
21 S. Mruthyunjaya, R. Manchanda, R. Godbole, R. Pujari, A. Shiras and P. Shastry, Biochem. Biophys. Res. Commun., 2010, 391, 43–48.