SOLID STATE EMISSIVE BODIPY DYES WITH BULKY SUBSTITUENTS AS SPACERS AND
A SENSITIVE AND SELECTIVE RATIOMETRIC NEAR IR FLUORESCENT PROBE FOR ZINC IONS BASED ON THE
DISTYRYL-BODIPY FLUOROPHORE
A THESIS
SUBMITTED TO THE MATERIALS SCIENCE AND NANOTECHNOLOGY PROGRAM OF THE INSTITUTE OF ENGINEERING AND SCIENCES
OF BİLKENT UNIVERSITY
IN PARTIAL FULFILLMENT OF THE REQUIREMENTS FOR THE DEGREE OF
MASTER OF SCIENCE
By
TUĞBA ÖZDEMİR July 2010
I certify that I have read this thesis and that in my opinion it is fully adequate, in scope and in quality, as a thesis of the degree of Master of Science.
………. Prof. Dr. Engin U. Akkaya (Principal Advisor)
I certify that I have read this thesis and that in my opinion it is fully adequate, in scope and in quality, as a thesis of the degree of Master of Science.
………. Assist. Prof. Dr. Mehmet Bayındır
I certify that I have read this thesis and that in my opinion it is fully adequate, in scope and in quality, as a thesis of the degree of Master of Science.
………. Assist. Prof. Dr. Neslihan Şaki
Approved for the Institute of Engineering and Science: ……….
Prof. Dr. Levent Onural
ABSTRACT
SOLID STATE EMISSIVE BODIPY DYES WITH BULKY
SUBSTITUENTS AS SPACERS AND
A SENSITIVE AND SELECTIVE RATIOMETRIC NEAR IR
FLUORESCENT PROBE FOR ZINC IONS BASED ON THE
DISTYRYL-BODIPY FLUOROPHORE
Tuğba ÖzdemirM.S. in Materials Science and Nanotechnology Supervisor: Prof. Dr. Engin U. Akkaya
July, 2010
Dyes having solid state fluorescence are playing an important role for organic light emitting devices (OLED), optoelectronic devices and photoelectric conversion. However, emissive solids are not common because of the quenching resulting from the packing. With these considerations, we have synthesized and characterized novel boradiazaindacene BODIPY-based dye with bulky substituents (3,5-di-tert-butylphenyl) to prevent π-π stacking of the chromophore. We have succesfully demonstrated that by simple modulation of BODIPY core with very bulky groups lead us to have a bright emissive compounds in solid state. In the second part of this research, we developed BODIPY based near-IR dye as a selective, ratiometric and water-soluble fluorophore for Zn (II) cation. We functionalized the versatile BODIPY from its 3 and 5 positions for long wavelength emission the zinc selective chemosensor.
Keywords: Solid state fluorescence, Stokes’ shift, π-π stacking, Near-IR dyes, boradiazaindacene, chemosensor.
ÖZET
HACİMLİ GRUPLAR KULLANILARAK KATI HAL
EMİSYONU OLAN BODİPY BOYARMADDELERİ VE
DİSİTİRİL BOYAR MADDE BAZLI ÇİNKO İYONLARI İÇİN
SEÇİCİ VE DUYARLI ORANTISAL YAKIN INFRARED
FLORESANS PROBU
Tuğba Özdemir
M.S. in Materials Science and Nanotechnology Supervisor: Prof. Dr. Engin U. Akkaya
July, 2010
Emisyonu olan katı maddeler fotoelektrik çevrim ve OLED uygulamalarını da içeren çeşitli uygulamalarından dolayı ilgi çekmektedirler. Ancak katı halde emisyon özelliği olan çok az sayıda organik bileşik vardır. Bu fikir doğrultusunda, ortogonal büyük hacimli grupların (3,5-di-tert-butil) BODIPY çekirdeğine yerleştirilmesi π-yüzeyleri arasındaki örtüşmeyi azaltarak sönümlenmeyi de en aza indiren bileşikleri sentezlemiş bulunmaktayız. Farklı dalgaboylarında emisyonları olan bir seri katı halde emisyonlu bileşikler sentezlenmiştir. Çalışmanın ikinci kısmında, yakın-IR bölgesinde emisyonu olan, seçici, orantılamalı ve suda çözünebilen BODIPY-temelli Zn(II) katyonuna duyarlı boya geliştirmiş bulunuyoruz. BODIPY yi 3 ve 5 pozisyonlarından türevlendirerek uzun dalga boyunda emisyonu olan çinkoya duyarlı kemosensör sentezlenmiştir.
Anahtar Kelimeler: Katı hal emisyonu, Stokes kayması, π-π istiflenmesi, yakın kızılötesi boyalar, boradiazaindasen, kemosensör.
ACKNOWLEDGEMENT
I would like to express my sincere gratitudes to my supervisor Prof. Dr. Engin U. Akkaya for invaluable guidance, support, and patience during the course of this research. One of the most important and right decisions in my life is joining Prof. Akkaya’s lab and being a member of such a beautiful team. I will never forget experience that I have benefited from greatly throughout my life.
I would like to thank to Dr. Serdar Atilgan for being a brother for me and for the great contribution to everything present in this thesis. I am very lucky to have a chance to work with him. His lab experience, motivation and encouragement forced me to become a good scientist. He will be in my life with her wife Neslihan and her beautiful son Eymen Kaan in perpetuity.
Also, I want to thank Dr. Leyla T. Yıldırım (Hacettepe University) for gathering the X-ray data and Dr. Abdullah Tülek and Assist. Prof. Dr. Mehmet Bayındır for providing absorption and emission spectra in thin films.
I owe a special thank to Dr. Ö. Altan Bozdemir, Dr. Ali Coşkun, Deniz Yılmaz ve Erhan Deniz for his support and guidance to improve my skills in the field of supramolecular chemistry.
I am obliged to thank each and every member of Supramolecular Chemistry Laboratory, Ruslan Guliyev, Yusuf Çakmak, Onur Büyükçakır, Sündüs Erbaş Çakmak, Barbaros Reis, Safacan Kölemen, Sencer Selçuk, Ziya Köstereli, Fazlı Sözmen, Dr. Cihan Gündüz, Bilal Kılıç, Nisa Yeşilgül, Merve Türkşanlı, Eser İden, Hande Boyacı, Yiğit Altay, Tuba Yaşar and Tuğçe Durgut for the great atmosphere in the laboratory. It is my pleasure to work with them.
My special thanks are due to Bora Bilgiç, Oya Bilgiç, Tamer Tezel, Asuman Durmuş, Görkem Günbaş and Abidin Balan for their help, support and friendships. Finally, I want to express my gratitude to my family and İlker Kütük for their love, support, and understanding.
TABLE OF CONTENTS
ABSTRACT ... iii ÖZET... iv ACKNOWLEDGEMENT... v TABLE OF CONTENTS ... vi LIST OF FIGURES... ix LIST OF TABLES ... xv INTRODUCTION... 1 1.1 Fluorescence ... 1 1.2 Stokes shift... 4 1.3 BODIPY as a Fluorophore... 5 1.4 Suzuki reaction ... 61.4.1 Mechanism of Suzuki coupling... 7
1.4.2 Applications of Suzuki coupling ... 10
1.5 Sonogashira coupling... 12
1.5.1 Mechanism of Sonogashira Reaction ... 14
1.5.2 Applications of the Sonogashira Reaction ... 15
1.6 Fluorescence in the Solid State... 17
1.7 Fluorescent chemosensors ... 20
1.8 Mechanism of Sensing... 21
1.8.1 Photoinduced Electron Transfer (PET) ... 22
1.8.2 Internal Charge Transfer (ICT) ... 23
1.9 Importance of Ratiometric Analysis... 26
1.11 Importance of Zn2+ion ... 27 1.12 Fluorescent Zn2+chemosensors... 28 EXPERIMENTAL PROCEDURES ... 30 2.1 General... 30 2.2 Experimental Part-I... 31 2.2.1 Synthesis of Compound (3)... 31 2.2.2 Synthesis of Compound (6)... 32 2.2.3 Synthesis of Compound (7)... 33 2.2.4 Synthesis of Compound (9)... 34 2.2.5 Synthesis of Compound (10)... 35 2.2.6 Synthesis of Compound (11)... 36 2.2.7 Synthesis of Compound (13)... 37 2.2.8 Synthesis of Compound (14)... 38 2.2.9 Synthesis of Compound (15)... 39 2.3 Experimental Part-II ... 40 2.3.1 Synthesis of Compound (17)... 40 2.3.2 Synthesis of Compound (19)... 41 2.3.3 Synthesis of Compound (20)... 41
2.3.4 Synthesis of the Compound (21) ... 42
2.3.5 Synthesis of compound (22)... 43 2.3.6 Synthesis of Compound (23)... 44 2.3.7 Synthesis of Compound (26)... 45 2.3.8 Synthesis of Compound (27)... 46 2.3.9 Synthesis of Compound (28)... 47 2.3.10 Synthesis of Compound (29)... 48
3.1 Solid state emissive BODIPY dyes with bulky substituents as spacers72 50
3.2 A Sensitive and Selective Ratiometric Near IR Fluorescent Probe for
Zinc Ions Based on the Distyryl-Bodipy Fluorophore74,... 61
CONCLUSION ... 73
REFERENCES... 74
APPENDIX A- NMR SPECTRA ... 78
APPENDIX B- MASS SPECTRA... 91
LIST OF FIGURES
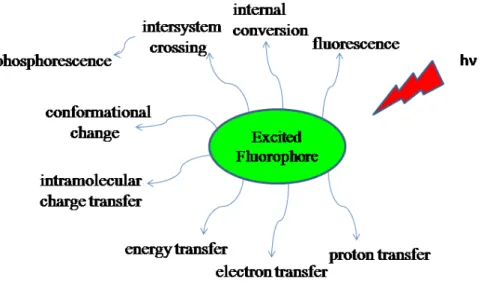
Figure 1. Types of de-activation processes of an excited fluorophore... 1
Figure 2. Jablonski diagram4... 2
Figure 3. Schematic representation of Stokes shift. ... 5
Figure 4. The structure and numbering system of BODIPY. ... 5
Figure 5. Schematic representation of Suzuki coupling... 7
Figure 6. Advantages of Suzuki coupling. ... 7
Figure 7. Mechanism of Suzuki coupling. ... 8
Figure 8. Example of functionalization on carbon nanotubes with Suzuki coupling. ... 10
Figure 9. Example of application of Suzuki coupling in the synthesis of solar cell sensitizers... 11
Figure 10. Example of using Suzuki coupling in NLO. ... 11
Figure 11. Reaction conditions of Sonogashira coupling... 12
Figure 12. Reaction conditions of Sonogashira coupling presented by Stephens and Castro... 12
Figure 13. Reaction conditions of Stephens and Castro, Heck and Sonogashira coupling reactions... 13
Figure 14. Mechanism of Sonogashira coupling... 14
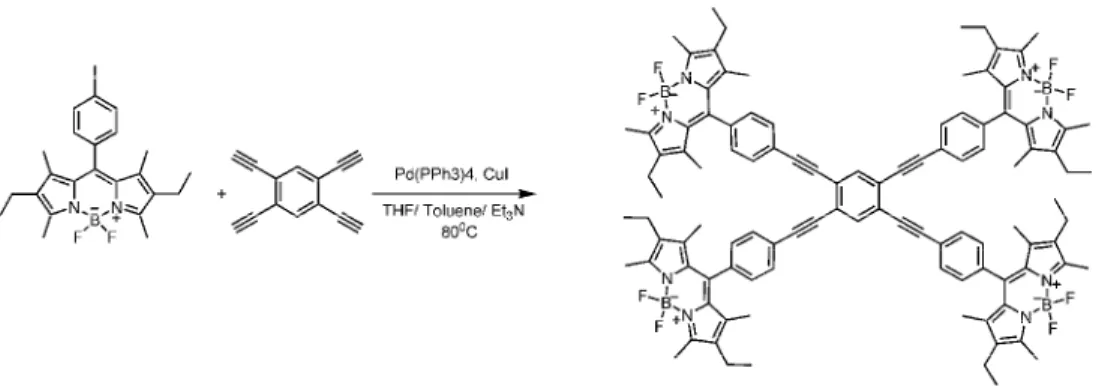
Figure 15. Example of application of Sonagashira coupling in energy transfer systems reported by Akkaya et al... 16
Figure 16. Example of application of Sonagashira coupling in biologically active compounds. ... 16
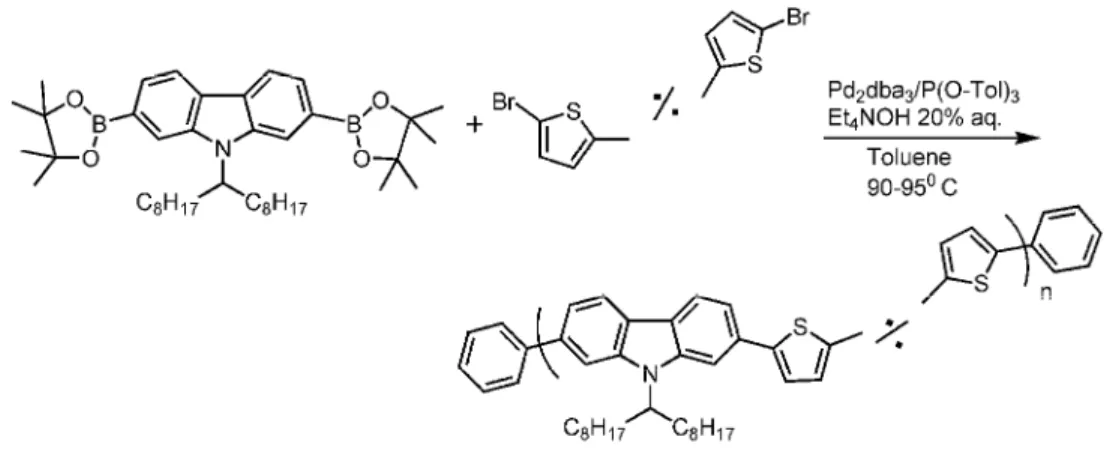
Figure 17. Example of application of Sonagashira coupling in conjugated polymers. ... 17
Figure 18. Example of hindering quenching of dyes in the solid state with using of bulky groups... 18
Figure 19. Example of hindering quenching of dyes in the solid state with
organic salt with primary amine... 19
Figure 20. Example of hindered quenching of dyes in the solid state with inclusion of guest molecules in the crystalline state. ... 19
Figure 21. Schematic representations for the types of fluorescent molecular sensors. ... 21
Figure 22. Molecular orbital diagrams for reductive PET. ... 22
Figure 23. Some examples of PET chemosensors... 23
Figure 24. Band gap changes on interactions with cations of ICT type sensors. 25 Figure 25. Some examples of ICT chemosensors. ... 26
Figure 26. Some examples of DPA- based chemosensors. ... 29
Figure 27. Synthesis of compound 3. ... 31
Figure 28. Synthesis of compound 6. ... 32
Figure 29. Synthesis of compound 7. ... 33
Figure 30. Synthesis of compound 9. ... 34
Figure 31. Synthesis of compound 10. ... 35
Figure 32. Synthesis of compound 11. ... 36
Figure 33. Synthesis of compound 13. ... 37
Figure 34. Synthesis of compound 14. ... 38
Figure 35. Synthesis of compound 15. ... 39
Figure 36. Synthesis of compound 17. ... 40
Figure 37. Synthesis of compound 19. ... 41
Figure 38. Synthesis of compound 20. ... 41
Figure 39. Synthesis of compound 21. ... 42
Figure 40. Synthesis of compound 22. ... 43
Figure 41. Synthesis of compound 23. ... 44
Figure 43. Synthesis of compound 27. ... 46
Figure 44. Synthesis of compound 28. ... 47
Figure 45. Synthesis of compound 29. ... 48
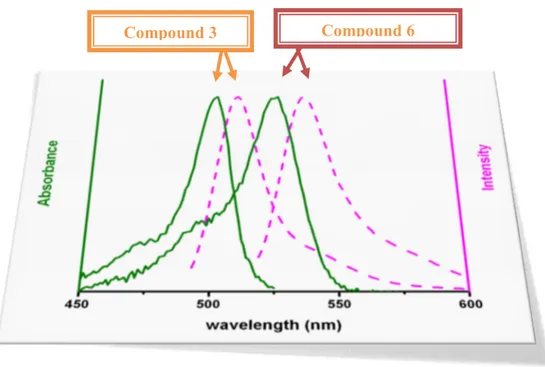
Figure 46. Absorption spectra of the thin films (top) and the emission spectra (bottom) of the dyes 3 and 6 in solution and as thin films. The inset shows the powder form of the compounds under UV irradiation at 360 nm. ... 51
Figure 47. Absorbance and emission spectra of Compound 3 and 6 in CHCl3. 53 Figure 48. ORTEP drawings of compounds 3 (top) and 6 (bottom). ... 54
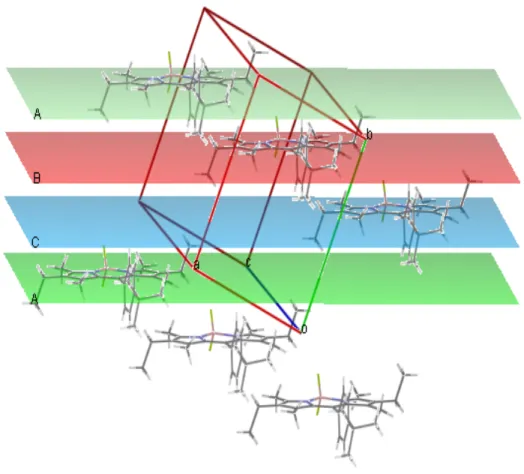
Figure 49. Packing diagram for Compound 3. ... 55
Figure 50. Packing diagram for Compound 6. ... 56
Figure 51. Structural representations of targeted dyes. ... 57
Figure 52. Absorption spectra of dyes 9, 11 and 15 in CHCl3... 58
Figure 53. Absorption spectra of dyes 9, 11 and 15 in CHCl3... 59
Figure 54. Representation of the modulated BODIPY fluorophore as a Zn2+ selective chemosensor ... 61
Figure 55. Absorbance change of the dye 56 (2.5 µM) in response to different metal ions (5.0 µM) in aqueous solutions. The solutions are buffered with 0.1 M HEPES pH 7.2. 5% EtOH was added as cosolvent... 63
Figure 56. Change in the emission spectrum in response to different cations (100 μM) in aqueous medium at pH 7.2. Excitation was done at 630 nm. The solutions are buffered with 0.1 M HEPES pH 7.2. 5% EtOH was added as cosolvent... 64
Figure 57. The change in absorption spectrum of the dye 29 (2.5 µM) as a function of increasing Zn(II) concentration. Concentration of Zn(II) is varied between 0 to 100 µM... 65
Figure 58. Change in the emission spectrum of the dye 29 (2.5 µM) in response to increasing concentrations of Zn(II) in ethanol-water mixture (%5 in ethanol). Zinc concentrations were varied in the following order: 0, 0.25, 0.5, 1, 2, 5, 10, 20, 50, 100 µM. Excitation was at 630 nm, with slit widths of 5 nm. ... 66
Figure 59. Fluorescence intensity ratio (F675/F730) of 29 versus log [Zn2+]. The concentration of 56 was 2.5 μM. Hill plot analysis yielded to 1:1 stoichiometry
with a slope 0.97... 67
Figure 60. Logarithmic values for the fluorescence intensity of dye at 675 nm versus log[Zn2+]. Hill coefficients (0.938) fits with 1:1 coordination of dye-Zn2+ ... 68
Figure 61. Curve of fluorescence intensity at 675 nm of the dye versus increasing concentration of Zn2+. The concentration of the dye was 5.0 µM. Dissociation constant was calculated as 2.0 × 10⁻⁵M... 68
Figure 62. Curve of fluorescence ratio of the dye at 675 nm and 730 nm (5.0 µM) versus increasing concentration of Zn2+... 69
Figure 63. Digital photographs of the chemosensor solutions (5.0 μM) in the presence of different metal ions at 100 μM concentration. The upper plate is taken under ambient light, and the bottom one under UV illumination at 360 nm. Solvent: ethanol-aqueous buffer mixture (5% in ethanol, HEPES 0.1 M, pH= 7.2)... 69
Figure 64. Normalized emission intensities at 680 nm (the emission intensity of the free dye= 1) of the chemosensor (1.2 μM) in the presence of selected metal ions (1.0 mM). Excitation was done at 630 nm with 5 nm slit widths. Solvent: ethanol-aqueous buffer mixture (5% in ethanol, HEPES 0.1 M, pH= 7.2)... 71
Figure 65. Results of the competition experiments between Zn (II) and selected metal ions. The free dye 29 (chemosensor) concentrations were set at 2.5 μM. Excitation was at 630 nm; emission intensity values at 680 nm were collected; and all metal ions were added at 200 μM concentration. Solvent: ethanol-aqueous buffer mixture (5% in ethanol, HEPES 0.1 M, pH=7.2). ... 71
Figure 66. 1H spectrum of Compound 3... 78
Figure 67.13C spectrum of Compound 3. ... 78
Figure 68.1H spectrum of Compound 6... 79
Figure 69.13C spectrum of Compound 6. ... 79
Figure 70. 1H spectrum of Compound 7... 80
Figure 71.13C spectrum of Compound 7. ... 80
Figure 73.13C spectrum of Compound 9. ... 81
Figure 74.1H spectrum of Compound 11... 82
Figure 75. 13C spectrum of Compound 11. ... 82
Figure 76. 1H spectrum of Compound 13... 83
Figure 77. 1H spectrum of Compound 14... 83
Figure 78.1H spectrum of Compound 15... 84
Figure 79.13C spectrum of Compound 15. ... 84
Figure 80.1H spectrum of Compound 17... 85
Figure 81. 1H spectrum of Compound 19... 85
Figure 82. 1H spectrum of Compound 20... 86
Figure 83.1H spectrum of Compound 21... 86
Figure 84.1H spectrum of Compound 22... 87
Figure 85. 13C spectrum of Compound 22. ... 87
Figure 86. 1H spectrum of Compound 23... 88
Figure 87. 13C spectrum of Compound 23. ... 88
Figure 88. 1H spectrum of Compound 26... 89
Figure 89. 1H spectrum of Compound 27... 89
Figure 90. 1H spectrum of Compound 29... 90
Figure 91. 13C spectrum of Compound 29. ... 90
Figure 92. Mass spectrum of Compound 6. ... 91
Figure 93. Mass spectrum of Compound 9. ... 92
Figure 94. Mass spectrum of Compound 11. ... 93
Figure 95. Mass spectrum of Compound 15. ... 94
Figure 96. Mass spectrum of Compound 23. ... 95
Figure 97. Mass spectrum of Compound 28. ... 95
Figure 99. ORTEP drawing of the molecular structure of the title compounds with the atomic numbering scheme. a) Compound 3, b) Compound 6... 101 Figure 100. Two different views of the packing diagram of the title compound 3. Planes A, B and C are the closest near parallel π-surfaces defined as the boradiazaindacene framework... 103 Figure 101. Packing diagram of the title compound 6. Planes A, B and C are the closest near parallel π-surfaces defined as the boradiazaindacene framework. 105 Figure 102. View of the plane defined by the bodipy π-surfaces (A) and 8-phenyl substituent (P), dihedral angle between the A and P is 84.35 and 79.56 for compound 3 and 6 respectively. ... 106 Figure 103. Packing diagram of the of the bodipy dye with no meso substituent studied as a reference. Dihedral angle between the A and B group planes is 17.90. ... 107 Figure 104. Hydrogen bonding geometry in compound 6. ... 108
LIST OF TABLES
Table 1. Timescale of some possible excited state procesess. ... 3 Table 2. Quantum yield, max. absorbance, max. emission and Stokes shifts of Compound 3 and 6. ... 53 Table 3. Quantum yield, max. absorbance, max. emission and Stokes shifts of Compound 9, 11 and 15. ... 59 Table 4. Crystal data and experimental details of the title compounds... 98 Table 5. Atomic coordinates and equivalent isotropic displacement parameters for non-hydrogen atoms of compound 3. ... 99 Table 6. Atomic coordinates and equivalent isotropic displacement parameters for non-hydrogen atoms of compound 6. ... 100 Table 7. Selected bond lengths (Å) and bond angles ()... 102 Table 8. Structural parameters of hydrogen bonds between donor (D), acceptor (A) and hydrogen (H). ... 103 Table 9. The distance between the closest near parallel π-surfaces for compound 3. ... 104 Table 10. The distance between the closest near parallel π-surfaces for compound 6. ... 104 Table 11. The distance between the closest near parallel π-surfaces for the reference compound. ... 107
CHAPTER 1
INTRODUCTION
1.1
Fluorescence
At room temperature, most elementary particles are in their ground states. However, the electrons are promoted to a higher energy state namely excited state, with the irradiation by photons with proper energies of these elementary particles. There are many pathways that an excited molecule can undergo as seen in Figure 1.
During the seventeenth and eighteenth centuries, luminescence phenomena was reported by several investigators but British scientist George G. Stokes was the first to describe in 18521and he used the term “fluorescence” as "to denote the general appearance of a solution of sulphate of quinine and similar media".2 If photon emission occurs as comeback of an electron from a singlet excited state to ground state, this process is termed as fluorescence. However, there are other processes for de-excitation like intersystem crossing, intramolecular charge transfer, and internal conversion. Furthermore, the excited state molecule can interact with another molecule and transfer its energy or electron or may form excimer.3
The Perrin-Jablonski diagram (Figure 2) explains possible pathways that photon absorption can cause. When a molecule absorbs light, it is promoted to one of the vibrational levels of the singlet electronic states (S1, S2). If this excited molecule relaxes and turns to the vibrational state of a lower electronic state, this non-radiative transition is called as internal conversion.
Figure 2. Jablonski diagram4 Eexcitation
Internal conversion is less efficient from S1to S0, since the energy gap between S1 and S0 is much larger compared to S2 and S1. Therefore, from S1 to S0 transition results emission of photons so it is called fluorescence. Another radiationless transition is intersystem crossing which occurs from excited singlet state (S1) to the excited triplet state (T1).
From excited triplet state (T1), there are three possible pathways. First one is phosphorescence. This process occurs since non-radiative de-activation from the triplet state T1 is dominant than radiative relaxation in solution at room temperature. Actually, T1 to S0 transition is forbidden but spin-orbit coupling allows the observation of this process. Second pathway is delayed fluorescence which is reverse intersystem crossing. The third path is the triplet-triplet transition. Since the triplet-triplet transition is spin allowed if the population of excited molecule in T1 state is large enough, absorption occurs at a distinct wavelength by another photon.
In Table 1, timescale for fluorescence processes are given. The reason why the time of the phosphorescence is so long is the longer excited state lifetime.
1.2
Stokes shift
As stated above, when light is absorbed by a fluorophore, its electrons turn out to be excited and promoted from a ground state to the excited electronic singlet state. Every fluorophore requires different amount of energy and shown in Figure 2 as Eexcitation5. Since the fluorophore is exposed to internal conformational change and releases some of its absorbed energy as heat, this state is only 1–10 nanoseconds long.
The electrons immediately after go to relaxed electronic singlet state which is a lower and more stable energy level. When the electrons in relaxed electronic singlet state turn back to their ground state, they give off the energy (Eemission) as fluorescence.
The distinction between the maximas of the excitation and emission wavelengths of a fluorophore is called Stokes shift (Figure 3). The reason why Stokes shift occurs is that energy of emission is fewer than the energy of absorption. In other words, fluorescence happens at lower energies.6Almost all fluorophores exhibit this property when they are studied in solution. Also, molecular structure determines the magnitude of the shift and this shift can be up to several hundred nanometers.
The fall of excited electrons to the lowest vibrational energy level of the S1 excited state, is the essential reason of the Stokes shift. Besides, excitation energy can diminish the excess vibrational energy, thermally. Resonance energy transfer, excited-state reactions and complex formation are other possible reasons of longer emission wavelengths.5
Figure 3. Schematic representation of Stokes shift.
Large Stokes shift has undeniable importance for fluorescence imaging. It allows more sensitive measurements. Also, increasing Stokes shift is very important to get solid-state emissive dyes used for different applications since it prevents self-quenching.
1.3
BODIPY as a Fluorophore
BODIPY is abbreviation of the 4,4-difluoro-4-bora-3a-aza-4a-aza-s-indacene. The structure and the numbering of the BODIPY core are given in Figure 4.
It is extremely useful fluorophore in many applications and Treibs and Kreuzer first discovered in 19687. Last three decades, BODIPY has been used widely and it still maintains its popularity. This popularity arises because of the superior characteristics of BODIPY. To begin with, it has strong absorption and fluorescence in the visible and near-IR region8. Modification on the BODIPY core leads the variation on the emission range. Akkaya et al. reported and showed that by modification on the 1 and 7 positions with 3 and 5 positions with Knoevenagel reactions (tetra-stryryl BODIPY) allows almost 840 nm emission wavelength.9 In addition, BODIPY dyes can be functionalized in order for solubilization not only in organic solvents, but also in water. In other words, derivatization on the BODIPY core, which has seven positions susceptible to functionalization, provides versatile characteristics. Moreover, they have high quantum yields and large extinction coefficients and are stable under continuous illumination and almost insensitive to solvent polarity and pH of the medium10,11. Furthermore, BODIPY dyes have narrow absorption and emission bandwidths, and so they give sharp peaks on emission spectra compared to other fluorophores such as fluorescein.5
1.4
Suzuki reaction
A useful and general methodology for the formation of carbon-carbon bonds (Figure 5) is obtained from the reaction between organoboron compounds and organic halides or triflates under the catalysis of palladium. This reaction is called Suzuki coupling.12 In Figure 6, the advantages of Suzuki coupling reactions are shown.13 There are a plenty of advantages of this reactions. To illustrate, the reaction conditions are mild, unaffected by the presence of water and reagents are available. Moreover, it permits the usage of broad range of functional groups and small amount of catalyst and it is applied in one pot synthesis and gives non-toxic by-products. In addition, the waste products can be distracted readily and so it can be used both in laboratory and industrial
applications. Furthermore, it shows regio- and stereoselectivity and is does not affected by the effect of steric hindrance.
Figure 5. Schematic representation of Suzuki coupling.
Figure 6. Advantages of Suzuki coupling.
1.4.1 Mechanism of Suzuki coupling
A widely used mechanism for Suzuki coupling reaction includes three steps which are oxidative addition, transmetallation and reductive elimination (Figure
7)14. Even though, the steps are difficult operations such as ligand exchanges, the presence of the intermediates 3 and 8 are proven by isolation or spectroscopic analyses15.
Figure 7. Mechanism of Suzuki coupling.
In Suzuki coupling reactions, various palladium (0) catalysts can be used since it can activate carbon-halogen bonds. A large number of palladium (0) catalysts can be useful in cross-coupling reaction. The most frequently employed palladium(0) catalysts are Pd(PPh3), on the other hand, PdCl2(PPh3)2, Pd(0Ac)2 and PPh3 or phosphine derived ligands are suitable because they show resistance to air.16
Oxidation addition step 1-alkenyl, 1-alkynyl, allyl, benzyl, and aryl halides to a palladium (0) complex results a stable trans-a-palladium (II) complex.17 In catalytic cycle, oxidative addition is generally rate-determining step.5 The relative reactivity order of halides is I > OTf > Br >> Cl. Electron acceptors are more susceptible to the oxidative addition than electron releasing groups for activation of aryl and 1-alkenyl halides. Also, characterization of oxidative addition which involves oxidation of metal is performed by electrochemical techniques (steady state voltametry, cyclic voltametry).18
Due to being inert to the organopalladium(II) halides, organoboron compounds do not generally take part in catalytic cycle, but, low nucleophile strength of organic group on boron atom can be overcome by negatively charged bases such as sodium or potassium carbonate, phosphate, hydroxide, and alkoxide19since these bases allow quaternization of the boron giving the corresponding “ate” complex which is more likely to undergo Suzuki coupling with organic halide.20 Transmetallation step is less known since the mechanism depends on the media and environment where the reaction takes place.5
As mentioned above, third step in catalytic cycle of Suzuki coupling is reductive elimination. In this step, the palladium(0) complex is reproduced and the reaction occurs from cis complex and the trans complex is converted to cis-complex. The reactivity decreases in the order of diaryl- > (alky1) aryl- > dipropyl- > diethyl- > dimethylpalladium(II). This can be explained by involvement by the π-orbital of aryl group while the bond is forming.21
The difference between the Suzuki and Stille couplings, in which both couplings allows C-C bond formation, is that the boronic acid must be activated with a base since the base converts the borane (BR3) into boronate (BR3(OH)–) which is more reactive. Hence, activation of the boron atom promotes the transmetallation step by increasing the polarization of the organic ligand.
1.4.2 Applications of Suzuki coupling
Suzuki coupling reactions have high impact on chemistry and there are lots of application areas. Some of the examples are given to realize the importance of Suzuki coupling reactions.
To begin with, Suzuki coupling is used to functionalize carbon nanotubes which have excellent electronic and mechanical characteristics. With carbon nanotubes, non-covalent and covalent functionalizations are possible. For covalent modulations, Suzuki coupling can be used the derivatization of the
walls of carbon nanotubes. As seen in the below (Figure 8), carbon nanotubes are functionalized with chromophores (Ar groups in the Figure 8) by using Suzukicoupling22.
Figure 8. Example of functionalization on carbon nanotubes with Suzuki
coupling.
Another application area of Suzuki coupling is in solar cell. This technology is crucial for being alternative to petroleum-based energy which is subject to depletion. In photovoltaic devices, poly(2,7-carbazole) derivatives are utilized as active constituents and Suzuki coupling is used for the synthesis of this polymer (Figure 9).23
Figure 9. Example of application of Suzuki coupling in the synthesis of solar
cell sensitizers.
Nonlinear optics (NLO) is the other application of Suzuki coupling reactions. NLO is the field of optics and deals with the action of light in non-linear media. NLO is very important since in the future, photonics might replace electronics. Therefore, connecting electron donor group with electron-withdrawing group can be achieved by Suzuki coupling reactions as in the example of 1,8-di(hetero)arylnapthalene derivative (Figure 10).24
1.5
Sonogashira coupling
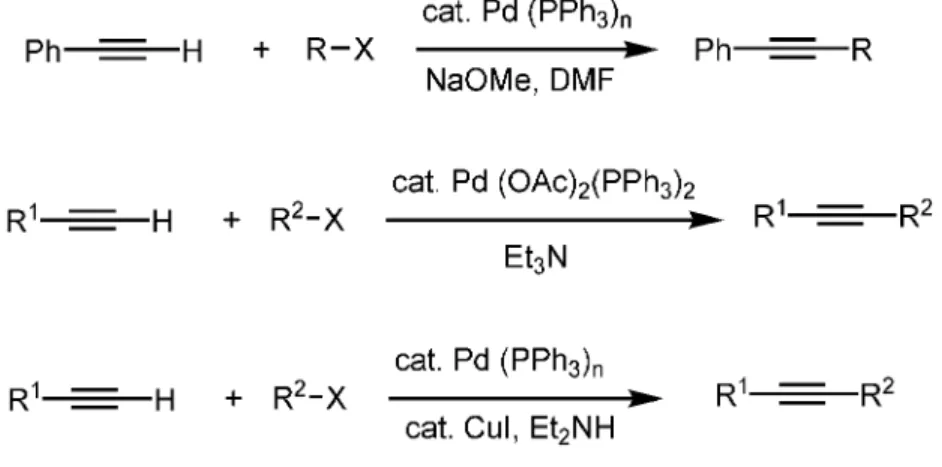
Sonogashira reaction is the coupling of terminal alkynes with aryl or vinyl halides by catalysis of palladium (Figure 11). Like Suzuki coupling, a base is required for the progression of the reaction, but, a co-catalyst such as copper iodide is used in sonogashira coupling which is not the case in Suzuki coupling.
Figure 11. Reaction conditions of Sonogashira coupling.
Sonogashira coupling has been improved in 1975 by different groups as shown in Stephens and Castro25 indicated under reflux in pyridine Pd catalyzed Stephens-Castro cross-coupling reaction of aryl halides with alkynylcopper to prepare internal arylacetylenes known as the Stephens-Castro reaction.
Figure 12. Reaction conditions of Sonogashira coupling presented by Stephens
and Castro.
Cassar26 demonstrated that the Pd-catalyzed cross-coupling reaction of aryl bromides and iodides with sodium acetylides generated in situ by mixing terminal alkynes with NaOMe in DMF (Figure 13). After that, Heck27 showed
that by using Pd-complex and a base, aryl and vinyl halides undergo cross-coupling with terminal acetylenes (Figure 13). Then, Sonogashira28used CuI as a co-catalyst and an amine base as a solvent and reactant to make conditions milder and perform the reaction smootly and now it is called as Sonogashira reaction (Figure 13). This coupling reaction is very useful for alkyne cross-coupling since it is simple to prepare starting material and conditions are mild even it gets more milder conditions for unactivated organic electrophiles. Furthermore, Sonogashira coupling is capable of tolerating various functional groups and modifications can be done to improve yields and to overcome difficulties with the cross-coupling reactions.
Figure 13. Reaction conditions of Stephens and Castro, Heck and Sonogashira
1.5.1 Mechanism of Sonogashira Reaction
The mechanism of Sonogashira coupling (Figure 14) is similar to Suzuki coupling. It has three main steps: oxidative addition, transmetallation and reductive elimination. Since the steps are given in details above, these steps are not explained here deeply. Organic halide gives oxidative addition to form Pd(II) complex and this intermediate undergoes transmetallation with alkynyl copper which is formed by from the terminal alkyne, base, and copper iodide. With the coupling of two organic ligands, Pd(0) catalyst is obtained and so reductive elimination step is terminated.
Figure 14. Mechanism of Sonogashira coupling.
One of the important parameters in Sonogashira coupling is the palladium catalyst. Most commonly used ones are Pd(PPh3)2Cl2and Pd(PPh3)4. They are
very similar to each other but Pd(PPh3)4is more reactive and smaller reaction times is needed. Besides, this catalyst can decompose easily when exposed to air and temperature above 0o and it is more expensive compared to Pd(PPh3)2Cl2. Also, Pd(PPh3)4 reduces the formation of by-product which is diacetylene formed by reduction of the Pd(II) complex. This formation can be reduced by bubbling argon or nitrogen gases to purge the oxygen from reaction medium. Generally, the amount of CuI used in Sonogashira coupling is twice of palladium catalyst (2-5 mol %).
The other vital parameter for Sonogashira coupling is the amine which is not only used as for a base but also for reaction solvent. Most commonly used bases are Et3N, Et2NH, iPr2NH. On the other hand, stronger bases like piperidine and pyrrolidine are used and increase in reaction rate is observed.
To get milder reaction conditions and to get rid of the difficulties faced with Sonogashira coupling, much effort has been spent by scientists and many articles were publishing.
1.5.2 Applications of the Sonogashira Reaction
There are numerous applications of the Sonogashira coupling such as light harvesting molecules, synthesis of natural products and conjugated polymers. To begin with, Sonogashira coupling can be used in the design of light harvesters. As shown in Figure 15, Akkaya et al. presented that BODIPY units can be linked to ethynyl- substituted benzene at (1,4), (1,3,5), and (1,2,4,5) positions. In this type of energy transfer cassettes are highly efficient because of both through-space and through-bond interactions.29
Figure 15. Example of application of Sonagashira coupling in energy transfer
systems reported by Akkaya et al.
Sonogashira coupling is seen in the synthesis of a derivative of (+)- and (-)-harveynone, which have reported to be phytotoxin and have antitumor activity (inhibitor of spindle formation), and (-)-tricholomenyn A, which have shown antimitotic activity . By using Sonogashira coupling, they have got good yields of the desired coupled product (74-97%) (Figure 16)30.
Figure 16. Example of application of Sonagashira coupling in biologically
Conjugated polymers and oligomers are very important since they are functional materials for electronics, photonics, advanced coatings, and related applications. The characteristics of conjugated polymers are significantly sensitive to the presence of impurities, acting as uncontrolled dopants, quenchers of excited states.31 Sonogashira coupling is generally useful for getting polyaryleneethynylenes (Figure 17) and fluorene polymers and copolymers by catalytic versions of chemical polymerization.
Figure 17. Example of application of Sonagashira coupling in conjugated
polymers.
1.6 Fluorescence in the Solid State
π-π stacking is a non-covalent and intermolecular interaction and arises from the stacked arrangement of the aromatic moities. However, even though some explanations have been made, the theoretical explanation of π-π stacking for larger molecules is not well explained.32
π-π stacking is generally meant as π-π interaction because the interactions are the result of presence of π-orbitals. In other words, intermolecular overlapping of π -orbitals in π-conjugated systems causes π-π interactions. Therefore, as the number of π-electrons increases, the interactions become more stronger.33
Fluorophores can show bright fluorescence in solution, however, in the solid-state, they become quenched due toπ-π stacking. Hence, in the aggretion state, most of the fluorophores are exposed to fluorescence quenching and so having
fluorescence in the solid state becomes crucial for the fluorophores. Ultimately, the most important element for the design of novel, highly bright solid-state emissive dye is to hinder the quenching and prevent the π-π stacking in the solid-state.
There are some methods to reduce the π-π stacking in molecules. Introducing bulky groups is one of the methods used for separating π systems of fluorophores. With these considerations, Qian and coworkers34 introduced two 4-tritylphenylethynl and phenylethynl groups into the 2,6-positions of the BODIPY core to inhibit the concentration of quenching and finally they got solid-state emissive dye with large Stokes shift (Figure 18).
Figure 18. Example of hindering quenching of dyes in the solid state with using
of bulky groups.
Another method for reducing π-π stacking in the molecules is using organic salt with a primary amine. In this method, the fluorescence intensity can be manipulated by changing the alkyl chain length of the amine. For example, as seen in the Figure 19, organic salts of anthracene-2,6-disulfonic acid (ADS) with linear alkylamines provide a tunable solid-state fluorescence system and the change in alkyl chain length of amines is interpreted as the arrangements and corresponding fluorecence properties.35
Figure 19. Example of hindering quenching of dyes in the solid state with
organic salt with primary amine.
In the solid state, fluorescence enhancement can be obtained by inclusion of guest molecules in the crystalline state. Therefore, guest enclathration is the other method for the destruction ofπ-πinteractions between the fluorophores36.
For fundamental research into solid state fluorescence and for the advancement of new intense solid-emissive materials, the benzofuranonaphthoquinol-type fluorophores which display dramatic fluorescence enhancement upon complexation with guest molecules will be convenient and so Yoshida et al. have developed the amine-inclusion (morpholine) derivatives of benzofuranonaphthoquinol fluorophores which have intense solid-fluorescence properties.37(Figure 20)
Figure 20. Example of hindered quenching of dyes in the solid state with
1.7
Fluorescent chemosensors
The fluorescent detection and biological imaging of the specific molecules which are crucial in living systems have aroused attention, since it is highly sensitive, cheap and processed easily compared to handling radioactive tracers for most biochemical measurements. Therefore, fluorescent chemosensors has a significant value for their simplicity and high sensitivity. In the design of the fluorescent sensors, the receptor (the recognition moiety) and fluorophore (signal source) are the substantial parts. The importance of the receptor arises from its impact on binding and selectivity38. In other words, a receptor should
have a strong affinity towards the target ion. The fluorophore is a signal
transformer that transforms the information into an optical signal due to the analyte. Therefore, it should be stable under light and should not be affected by pH of the medium, temperature and polarity and so on. According to presence or concentration of the analyte when binds to sensor, there will be changes in the fluorescence intensity, lifetime or a shift of fluorescence wavelength will ocur. Also, binding of the analyte to chemosensor will cause increase or decrease in the fluorescence that is observed with the help of the fluorophore3.
The fluorescent molecular sensors can operate in three different ways. First one depends on the collision of the analytes which causes fluorescence quenching like gas particles collision. Second methodology relies on the reversible binding of the analyte to fluorophore. In this probe, there can be fluorescence quenching known as chelation enhancement of quenching (CHEQ) or fluorescence enhancement known as chelation enhancement of fluorescence (CHEF). In the third approach, fluorophores can be attached to the receptor part with/without a spacer. If there is an alkyl chain as a spacer between receptor and fluorophore, the system is called fluorophore-spacer-receptor probe. However, if there is no spacer between receptor and the fluorophore, such probes are called integrated fluorescent probes (Figure 21). In other words, in integrated fluorescent probe, receptor is conjugated to the fluorophore via π-electron system39. In this third way, fluorescence can be quenched or enhanced with the binding of analyte.
Figure 21. Schematic representations for the types of fluorescent molecular
sensors.
1.8 Mechanism of Sensing
There are two main categories in the sensor design: electrochemical and optical sensor. The first type is based on the attachment of a redox active group to a receptor. Binding of guest molecule brings about the changes in the redox property of the receptor, and cyclic voltametry (CV) is used to detect these changes40. However, there are some drawbacks of this design. For example, this method necessitates large amount of sample and it is expensive. Optical sensors can be colorimetric, electron-selective, path selective and fluorescent. The first two types are on the basis of the change in the absorbance.41 The most useful type of optical sensors is fluorescence-based sensors. They are more sensitive, fast, and more secure in terms of process, where samples are not demolished and no hazardous products are formed. These properties of fluorescence allow to detection of smaller concentration at pico or femtomolar levels.
There are two most commonly used mechanisms by fluorescence modulation in Zn(II) sensing. These are photoinduced electron transfer (PET)42 and internal charge transfer (ICT)43.
1.8.1 Photoinduced Electron Transfer (PET)
In the idea of PET chemosensors, the fluorophore is attached to the receptor via a spacer and the receptor contains high energy non-bonding electron pair like on nitrogen atom. This atom can donate an electron to the excited fluorophore and so fluorescence quenching occurs. In this system, the excited fluorophore can be electron donor or acceptor.44 Also, the redox potentials of the S0and excited states determine the direction of the electron transfer. As shown in Figure 22, when the fluorophore is excited, an electron of the fluorophore in the highest occupied molecular orbital (HOMO) is raised to the lowest unoccupied molecular orbital (LUMO). In other words, when an ion binds to the electron pair of the fluorophore, the oxidation-reduction potential of the receptor increases and so the HOMO of the receptor decreases in the energy fluorophore. As a result, PET process is blocked and fluorescence becomes enhanced.45
In the literature, there are numerous examples of PET chemosensors as seen in Figure 2346-49. Moreover, large number of different receptor moieties can be used as a part PET sensor as selective ligands for alkali, alkaline earth and transition metal ions. By the coordination of cation, PET becomes thermodynamically unfavorable because of the decrease in HOMO energy of the ionophore, and so fluorescence quenching is suppressed.47
Figure 23. Some examples of PET chemosensors.
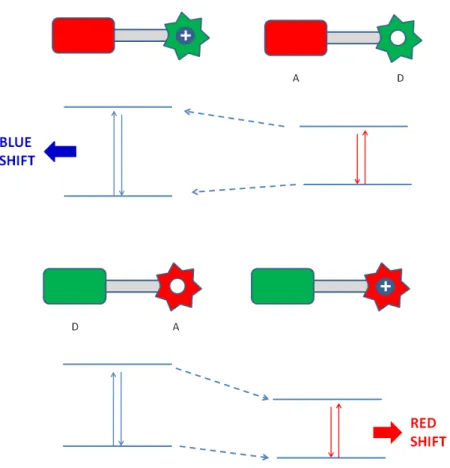
1.8.2 Internal Charge Transfer (ICT)
When there is no spacer between the fluorophore and receptor moities in the design of the probe, in other words, receptor is directly attached to the fluorophore, it can be said that ICT mechanism is in action. In this design, receptor moiety is in conjuction with the π-electron system fluorophore moiety. To obtain an ICT type probe, fluorophore must contain an electron-donating
group such as –NH2 and an electron-withdrawing group. By the excitation of the light, ICT occurs from donor to acceptor50. When a receptor (donating part) interacts with a cation, there will be a decrease in the electron-donating character of receptor. As a result, the conjugation will be affected and blue shift will be expected in the absorption spectrum. This mechanism can be explained as charge-dipole interactions. Amino group will be positively charged upon excitation and when this positively charged amino group interacts with the cation, the excited state will be destabilized. As seen in the Figure 24, energy gap between So and S1will become larger at the end of this process so blue shift is anticipated. Another possible mechanism observed in the ICT processes is that the acceptor group (electron receptor) like carbonyl group can interact with the cation and increases electron-withdrawing property of that part. Again, charge-dipole interactions can be used to explain this mechanism. When the acceptor group is affected by the electron receptor, the excited state becomes more stable and as a result, red shift will be observed since the energy gap between S0and S1will decrease.51
Figure 24. Band gap changes on interactions with cations of ICT type sensors.
As shown in the Figure 25, in the literature, there are lots of examples of ICT type chemosensors. These chemosensors are sensitive to different cations. Compound 5 is Cd2+selective chemosensor with watersolubility. Also, in vitro studies with HK-2 cell lines showed its selectivity and sensitivity52. Another Hg2+selective and sensitive and ICT type chemosensor is shown as compound
653. The advance in the chemosensor design was presented by Akkaya group54. Compound 7 is designed for the Hg2+ ion with modulation of resonance energy transfer, signal ratio was amplified.
Figure 25. Some examples of ICT chemosensors.
1.9 Importance of Ratiometric Analysis
In chemosensors, ratiometric measurements are very important, since it allows high signal-selectivity.37 Ratiometric analysis means that the ratio of the
intensities at two suitable emission or absorption wavelengths. In this analysis, the signal ratio is independent of the concentration of the fluorophore, and also on the intensity of the incident light. In ICT mechanism, chemosensors can be designed in ratiometric manner because with cation binding, a shift can be observed not only in the absorption but also in emission wavelength, so we can observe larger changes in fluorescense intensity. Therefore, this measurement enables us to get more precise data and diminishes artifacts by reducing the
effect of extraneous factors (illumination, photobleaching) on the fluorescence probe.46
1.10 Di-2-picolylamine (DPA) as a selective ligand
DPA was used firstly in 199655 and from then DPA was widely incorporated into many fluorophoroionophores to sense Zn2+cations. There are other reasons why DPA is so common, such as its cell permeability and high selectivity against 1A and 2A metal ions. The latter property is very important since these metal ions are coexisting with Zn2+ions in the biological environments.
Many examples have been published using DPA, which work according to either PET or ICT mechanisms. The amine on the DPA can be attached many different fluorophores by using a spacer or directly conjugated to the fluorophore. However, besides being capable of working through ICT and PET mechanisms, a chemosensor must meet some other requirements to be an effective sensor. To begin with, to prevent cell damage, excitation wavelength should be in the range of visible or near-IR region. Also, emission from near-IR fluorescent dyes are scattered much less than others and are crucial for in vivo imaging. Moreover, they should be water-soluble for biological applications and have high quantum yields and large extinction coefficients. As mentioned above, also it should allow ratiometric analysis and large Stokes shift.
1.11 Importance of Zn
2+ion
It is well-known that Zn2+ is the second most abundant transition metal ion in the body following iron. Zn2+has vital role in biological processes56such as in the control of gene expression, programmed cell death, enzyme adjusting and synaptic transmission.57 Also, it is known that Zn2+ is responsible for the
formation of amyloid plaques58 which is related to the etiology of Alzheimer’s disease.59
An adult body holds more than a few grams of Zn(II)60. Up to now, the protein bound form of Zn2+ have been presented but free or loosely bound, in other words, chetable Zn2+maintains its ambiguity and its mechanism of action is still uncertain.61 Free Zn2+exists in brain (in the amount of a few millimolars in the vesicles of the signal-passing neuron)62, pancreas and retina. Furthermore, since d-shell of Zn2+is filled (d0electron configuration), spectroscopic detection is not a viable option. Therefore, fluorescent sensor molecules have been studied enormously to make clearer the function of Zn2+.
1.12 Fluorescent Zn
2+chemosensors
Designing a chemosensor requires numerous parameters to controlled. To begin with, it should be simple, selective, show give response strongly and allow to study in aqueous environments63.
According the hard and soft acids and bases theory,64 Zn2+ cation which is a moderately soft acid should bond to moderate soft bases. As a result, for enhancement of the binding constant, most of the Zn2+ receptors contain nitrogen (N) which is a moderate soft donor atom.
In recent literature, a large number of fluorescent probes for zinc have been studied based on different fluorophores such as antharacene65, 7-nitrobenz-2-oxa-1,3-diazole (NBD)66, boradiazaindacene (bodipy),67 and fluorescein68. Unfortunately, for most of them, water solubility is limited, thus various solvent mixtures are used in characterization.
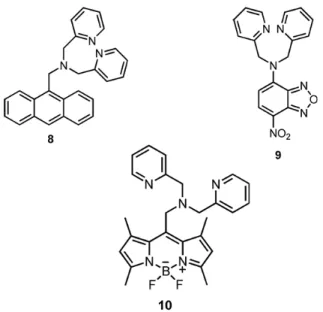
Although, there are lots of chemosensors based on DPA as a receptor, only few examples meet characteristics mentioned above. As shown in Figure 26, compound 869is a typical PET type Zn2+ion sensitive probe. It is higly selective
but it does not allow ratiometric analysis, is not water-soluble and near-IR dye. Anoher ICT type, DPA receptor based chemosensor is compound 970. In this chemosensor, the fluorophore is 7-nitrobenz-2-oxa-1,3-diazole (NBD) which has strongly electron-withdrawing character and so it shows relatively low affinity of DPA in for Zn2+. Again, it does not show fluorescence alteration. Compound 1071 is again ICT type and BODIPY-based Zn2+ selective chemosensor. It shows low dissociation constant and high quantum yield with the binding of Zn2+. However as compound 8, water- solubility is limited and it does not absorb in the near- IR region of the spectrum.
CHAPTER 2
EXPERIMENTAL PROCEDURES
2.1 General
Without further purification, all chemicals and solvents purchased from Aldrich were used.1H NMR and13C NMR spectra were recorded using a Bruker DPX-400 in CDCl3 or DMSO-d6 with TMS as internal reference. Absorption spectrometry was performed using a Varian spectrophotometer. Steady state fluorescence measurements were conducted using a Varian Eclipse spectrofluorometer. Column chromatography of all products was performed using Merck Silica Gel 60 (particle size: 0.040–0.063 mm, 230–400 mesh ASTM). Reactions were monitored by thin layer chromatography using fluorescent coated aluminum sheets. Solvents used for spectroscopy experiments were spectrophotometric grade. Mass spectrometry measurements were done at the Ohio State University Mass Spectrometry and Proteomics Facility, Columbus, Ohio, U.S.A. and Bilkent University Agilent Technologies 6530 Accurate-Mass Q-TOF LC-MS. X-ray diffraction data were obtained on an Enraf-Nonius CAD4 (-geometry) diffractometer operating in /2 scan mode using graphite-monochromated MoK radiation ( = 0.71073 Å) at room temperature.
2.2 Experimental Part-I
2.2.1 Synthesis of Compound (3)
Figure 27. Synthesis of compound 3.
3,5-di-tert-butylbenzaldehyde (1) (1.83 mmol, 400 mg) and 2,4-dimethylpyrrole (2) (3.67 mmol, 348 mg) were dissolved in CH2Cl2(350 mL) purged with argon in a 1000 mL flask. 1 drop of TFA was added and the mixture was stirred at room temperature for 3 hrs. When TLC showed consumption of the aldehyde was complete, a solution of 295 mg (1.83 mmol) of DDQ (2,3-Dichloro-5,6-dicyano-p-benzoquinone) in CH2Cl2 was added. After 3 h, Et3N (4 ml) and BF3.OEt2 (4 ml) were added. Immediately after the addition of BF3.OEt2bright green fluorescence was observed. Crude product was washed three times with water, dried over Na2SO4 and concentrated in vacuo. Then crude product purified by silica gel column chromatography using CHCl3. The pale orange fraction which has bright green fluorescence was collected. Orange solid (0.476 mmol, 207 mg, 26 %).
1H NMR (400 MHz, CDCl3) δ 7.41 (s, 2H), 7.02 (s, 1H), 5.93 (s, 2H), 2.54 (s, 6H), 1.33 (s, 6H), 1.22 (s, 18H)
13C NMR (100 MHz, CDCl3) δ 155.1, 152.0, 143.3, 143.2, 134.0, 131.5, 122.1, 121.9, 121.0, 35.0, 31.4, 14.5, 14.1.
2.2.2 Synthesis of Compound (6)
Figure 28. Synthesis of compound 6.
4-tert-butylbenzaldehyde (4) (3.10 mmol, 500 mg) and 2,4-dimethyl-3-diethyl pyrrole (5) (6.2 mmol, 761.26 mg) were dissolved in CH2Cl2(400 mL) purged with argon in a 1000 mL flask. 1 drop of TFA was added and the mixture was stirred at room temperature for 3 hrs. When TLC showed consumption of the aldehyde was complete, a solution of 500 mg (3.10 mmol) of DDQ (2,3-Dichloro-5,6-dicyano-p-benzoquinone) in CH2Cl2was added. After 3 h, Et3N (3 ml) and BF3.OEt2(3 ml) were added. Immediately after the addition of BF3.OEt2 bright yellow fluorescence was observed. Crude product was washed three times with water, dried over Na2SO4 and concentrated in vacuo. Then crude product purified by silica gel column chromatography using CH2Cl2. The orange fraction which has bright yellow fluorescence was collected. Orange solid (0.147 mmol, 608 mg, 45 %). 1H NMR (400 MHz, CDCl3) δ 7.42 (d, 2H J=8.1 Hz), 7.15 (d, 2H J=8.1 Hz), 2.51 (s, 6H), 2.25-2.18 (q, 2H J=7.5Hz), 1.29 (s, 9H), 1.2 (s, 6H), 0.93-0.96 (t, 3H, J=7.5 Hz) 13C NMR (100 MHz, CDCl3) δ 152.9, 151.7, 140.2, 138.0, 132.2, 132.1, 130.5, 127.4, 125.3, 34.3, 30.9, 16.6, 14.1, 12.0, 11.0.
2.2.3 Synthesis of Compound (7)
Figure 29. Synthesis of compound 7.
3 (0.92 mmol, 400 mg) and iodine (2.29 mmol, 582 mg) were added to a 500
mL round-bottomed flask containing 200 ml EtOH and iodic acid (1.83 mmol, 323 mg) dissolved in 2 mL of water was added to this solution. The reaction mixture was stirred at 60oC and was monitored by TLC chlorofom. Saturated Na2S2O3 solution in water was added to the solution, when all the starting material had been consumed, and the product was extracted into chloroform and dried over Na2SO4. Then, the solvent was evaporated in vacuo. The residue was purified by silica gel column chromatography using chloroform as the eluant. Red solid (600 mg, 95%).
1H NMR (400 MHz, CDCl3) δ 7.51 (d, 1H, J=1.7 Hz.), 7.15 (d, 2H, J=1.7 Hz), 2.23 (s, 6H), 1.37 (s, 6H), 1.30 (s, 18H).
13C NMR (100 MHz, CDCl3) δ 152.5, 133.8, 122.5, 121.9, 35.1, 31.4, 16.7, 16.0.
2.2.4 Synthesis of Compound (9)
Figure 30. Synthesis of compound 9.
Compound 7 (0.073 mmol, 50 mg), 3,5-di-tert-butylphenylboronic acid (8) (0.14 mmol, 34 mg) and Pd(PPh3)4(0.0073, 8.5 mg) were heated to reflux in toluene (10 ml), ethanol (5 ml) and 2 M Na2CO3(2 ml) for 6 hours. Then, the mixture was cooled to room temperature and diluted with EtOAc (20 ml) and washed with water. Then, dried with Na2SO4and evaporated to get crude product. Via silica gel chromatography (hexane/ CHCl3: 2:1), product was purified. (51.4 mg, 87%) 1H NMR (400 MHz, CDCl3) δ 7.49 (s, 1H), 7.33 (t, 2H, J=1.7 Hz), 7.20 (d, 2H, J=0.86 Hz), 7.00 (d, 4H, J=0.88 Hz), 2.01 (s, 6H), 1.36 (s, 6H), 1.35 (s, 18H), 1.32 (s, 36H). 13C NMR (100 MHz, CDCl3) δ 154.0, 152.0, 150.4, 138.9, 134.6, 132.6, 124.4, 122.2, 121.8, 120.6, 35.1, 34.8, 31.5, 31.4, 13.5, 12.5.
2.2.5 Synthesis of Compound (10)
Figure 31. Synthesis of compound 10.
3,5-di-tert-butylbenzaldehyde (1) (2.3 mmol, 500 mg) and 2,4-dimethyl-3-diethyl pyrrole (5) (5.7 mmol, 706.4 mg) were dissolved in CH2Cl2(400 mL) purged with argon in a 1000 mL flask. 1 drop of TFA was added and the mixture was stirred at room temperature for 3 hrs. When TLC showed consumption of the aldehyde was complete, a solution of 563 mg (2.3 mmol) of DDQ (2,3-Dichloro-5,6-dicyano-p-benzoquinone) in CH2Cl2was added. After 3 h, Et3N (3 ml) and BF3.OEt2(3 ml) were added. Immediately after the addition of BF3.OEt2 bright yellow fluorescence was observed. Crude product was washed three times with water, dried over Na2SO4 and concentrated in vacuo. Then crude product purified by silica gel column chromatography using CHCl3. The orange fraction which has bright yellow fluorescence was collected. Orange solid (207 mg, 42 %).
1H NMR (400 MHz, CDCl3) δ 7.49 (s, 1H), 7.11 (s, 2H), 2.14 (s, 6H), 2.31 (q, 4H, J=5.7 Hz), 1.34 (s, 18H), 1.28 (s, 6H), 1.01 (t, 6H, J=5.02 Hz).
13C NMR (100 MHz, CDCl3) δ 153.3, 151.8, 138.5, 134.7, 132.5, 122.4, 120.6, 35.1, 31.4, 17.1, 14.6, 12.5, 11.4.
2.2.6 Synthesis of Compound (11)
Figure 32. Synthesis of compound 11.
Compound 10 (0.203 mmol, 100 mg) and 1 (0.406 mmol, 88 mg) were refluxed in a mixture of benzene (20 ml), glacial acetic acid (1.5 mL), and piperidine (2 mL). Any water formed during the reaction, was removed azeotropically in a Dean-Stark apparatus. By monitoring with TLC, when all the starting material had been consumed, the mixture was cooled to room temperature and solvent was evaporated. Water (100 mL) added to the residue and the product was extracted into the chloroform (100 mL). Organic phase dried over Na2SO4, evaporated and residue was purified by silica gel column chromatography using hexane/ CHCl3( 5:1). The green colored fraction was collected then the solvent was removed under reduced pressure to yield compound 11 (148 mg, 82%). 1H NMR (400 MHz, CDCl3) δ 7.71 (d, 2H, J=16.7 Hz), 7.42 (s, 1H), 7.35 (s, 4H), 7.32 (s, 2H), 7.20 (d, 2H, J=16.7 Hz), 7.11 (s, 2H), 2.55 (q, 4H, J=7.4 Hz), 1.38 (s, 36H), 1.35 (s, 18H), 1.28 (s, 6H), 1.22 (t, 6H, J=5.5 Hz) 13C NMR (100 MHz, CDCl3) δ 151.9, 151.1, 150.3, 138.9, 136.8, 136.7, 135.1, 133.5, 123.1, 122.8, 121.7, 121.6, 119.7, 35.1, 34.9, 31.5, 31.4, 29.7, 18.4, 14.1, 11.2
2.2.7 Synthesis of Compound (13)
Figure 33. Synthesis of compound 13.
To 1-bromo-3,5-di-tert-butyl benzene (12) (0.93 mmol, 250 mg) in freshly distilled THF (10 ml) and diisopropylamine (5 ml), Pd(PPh3)2Cl2(0.056 mmol, 39 mg) and CuI (0.093 mmol, 17.6 mg) were added respectively. After 10 min., trimethylsilylacetylene (1.857 mmol, 184.4 mg) were added and the mixture was allowed to stand at 60oC overnight. The mixture was evaporated, washed with CH2Cl2 and water and organic phase was dried over Na2SO4. Then crude product purified by silica gel column chromatography using hexane. (216 mg, 87%)
1H NMR (400 MHz, CDCl3) δ 7.40 (d, 1H, J= 1.84 Hz), 7.35 (d, 2H, J= 1.88 Hz), 1.32 (s, 18H), 0.28 (s, 9H)
2.2.8 Synthesis of Compound (14)
Figure 34. Synthesis of compound 14.
Compound 13 (0.70 mmol, 200 mg) and NaOH (7 mmol, 279 mg) were added to a solution of DCM (10 ml) and MeOH (10 ml) and stirred about 15 min. Then, water (100 ml) was added to and the product was extracted into the CH2Cl2 (100 ml). The product was obtained after dried over Na2SO4 and evaporated. (147 mg, 98%)
1H NMR (400 MHz, CDCl3) δ 7.42 (d, 1H, J=1.88 Hz), 7.37 (d, 2H, J=1.80 Hz), 3.03 (s, 1H), 1.32 (s, 18H)
13C NMR (100 MHz, CDCl3) δ 150.9, 126.4, 123.3, 121.0, 84.9, 75.8, 34.8, 31.3.
2.2.9 Synthesis of Compound (15)
Figure 35. Synthesis of compound 15.
To Compound 7 (0.13 mmol, 89 mg) in freshly distilled THF (10 ml) and diisopropylamine (5 ml), Pd(PPh3)2Cl2 (0.016 mmol, 10.9 mg) and CuI (0.026 mmol, 4.95 mg) were added respectively. After 10 min., Compound 14 (0.32 mmol, 69.2 mg) were added and the mixture was allowed to stand at 60oC overnight. The mixture was evaporated, washed with CH2Cl2 and water and organic phase was dried over Na2SO4. Then crude product purified by silica gel column chromatography using CHCl3/hexane (2:1). ( 94 mg, 85%)
1H NMR (400 MHz, CDCl3) δ 7.40 (d, 1H, J= 1.84 Hz), 7.35 (d, 2H, J= 1.88 Hz), 1.32 (s, 18H), 0.28 (s, 9H)
13C NMR (100 MHz, CDCl3) δ 158.1, 152.3,150.9, 144.0, 143.8, 133.6, 131.3, 125.6, 122.7, 122.4, 122.2, 122.0, 97.4, 80.3, 35.2, 34.8, 31.4, 31.3, 13.8, 13.3. ESI-HRMS calcd for M-H+859.5913, found 859.5694, Δ= 25.5 ppm
2.3 Experimental Part-II
2.3.1 Synthesis of Compound (17)
Figure 36. Synthesis of compound 17.
3, 4, 5- trihydroxybenzoic acid (5.00 g, 29.4 mmol), 16, was dissolved in 30 mL EtOH. 1 mL of 96% H2SO4 was carefully added in 10 min and the reaction mixture was refluxed overnight. The crude product was chromatographed on silica gel and eluted with chloroform-isopropanol 7:3 (v/v) to yield 3.20 g solid compound 17. Yield was 55%. Without further purification 17 was used through next step.
1H NMR (CDCl3): δ (ppm) 6.95 (s, 2H, Ar-H), 4.20 (q, 2H, J=7.0 Hz, -CH2), 1.25 (t, 3H, J=7.0 Hz, CH3).
2.3.2 Synthesis of Compound (19)
Figure 37. Synthesis of compound 19.
Triethylene methyl ether, 18, (3.00 g, 15.0 mmol) and 5 mL of Et3N was dissolved in 150 mL of CH2Cl2. In a dropwise manner TsCl (3.20 g, 15.0 mmol) was added to the mixture. The reaction was completed after mixing one day at room temperature. The desired product was then collected with column chromatography in which the eluent was CHCl3 to yield 3.32 g 19 in a liquid form. Yield 81%.[6]
1H NMR (CDCl3): δ (ppm) 7.55 (d, 2H, J= 8.0 Hz, Ar-H), 7.15 (d, 2H, J= 8.0 Hz, Ar-H), 4.00 (m, 2H, CH2), 3.60-3.30 (m, 10H), 3.20 (s, 3H, CH3), 2.30 (s, 3H, CH3).
2.3.3 Synthesis of Compound (20)
Figure 38. Synthesis of compound 20.
A suspension of 17 (3.00 g, 15. 0 mmol), 19 (12.4 g, 45.0 mmol), K2CO3(8.10 g, 45.0 mmol) and catalyt amount of 18-crown-6 in 200 ml acetone was refluxed
overnight. Acetone was removed by evaporation, and the residue was redissolved in CHCl3and extracted with distilled water three times. The organic phase was taken and solvent was removed by evaporation. The expected product was taken without any further purification as brown oil (8.50 g, 92%).
1H NMR (CDCl3): δ (ppm) 7.20 (s, 2H, Ar-H), 4.40- 3.10 (m, 45 H), 2.30 (q, 2H, J= 7.0 Hz, -CH2), 1.30 (t, 3H, J=7.0 Hz, CH3).
2.3.4 Synthesis of the Compound (21)
Figure 39. Synthesis of compound 21.
An excess amount of 2.0 g LiAlH4was dissolved in dry 20 ml of THF and 20 (8.00 g, 12.5 mmol) was added to the reaction mixture in a dropwise manner in 30 min. After reaction was completed which was monitered with TLC the excess amount of LiAlH4 was killed with cold water. The crude reaction was filtered and washed with methanol. The solvent then was removed by evaporation and 21 was taken as an only product. (7.40 g, 100%)
1H NMR (CDCl3): δ (ppm) 7.30 (s, 1H,OH), 6.60 (s, 2H, ArH), 4.55 (s, 2H, -CH2), 4.30- 3.30 (m, 45H).
2.3.5 Synthesis of compound (22)
Figure 40. Synthesis of the compound 22.
Compound 21 (7.00 g, 11.8 mmol) and excess amount of pyridinium chloro chromate (PCC) (5.00 g) were dissolved in CH2Cl2. The reaction was monitered by TLC and when complete consumption of 21 was seen the reaction was completed. Crude reaction was extracted with basic aqueous solution one times, then three times with acidic aqueous solution. The organic phase was collected and solvent removed by evaporation. 22 was taken as only product after workup steps (6.90 g, 100%)
1H NMR (400 MHz, CDCl3): δ (ppm) 9.80 (s, 1H), 7.10 (s, 2H, Ar-H), 4.30-3.30 (m, 45H)
2.3.6 Synthesis of Compound (23)
Figure 41. Synthesis of compound 23.
3,4,5-tris(2-(2-(2-methoxyethoxy)ethoxy)ethoxy)benzaldehyde (22) (0.34 mmol, 200 mg) and 2,4-dimethyl-3-ethyl pyrrole (5) (0.68 mmol, 84.0 mg) were dissolved in CH2Cl2(250 mL) purged with argon in a 100 mL flask. 1 drop of TFA was added and the mixture was stirred at room temperature for 3 hrs. When TLC showed consumption of the aldehyde was complete, a solution of 166 mg (0.68 mmol) of DDQ (Tetrachloro-1,4-benzoquinone) in CH2Cl2 was added. After 3 h, Et3N (3 ml) and BF3.OEt2 (3 ml) were added. Immediately after the addition of BF3.OEt2 bright yellow fluorescence was observed. Crude product washed three times with water, dried over Na2SO4 and concentrated in vacuo. Then crude product purified by silica gel column chromatography using CHCl3/CH3OH (99/1, v/v). The pale green fraction which has bright yellow fluorescence was collected. Orange solid (0.147 mmol, 120 mg, 43 %).
1H NMR (400 MHz, CDCl3) δ: 6.48 (s, 2H, Ar-H), 4.15 (t, J= 5. 0 Hz, 2H), 4.06 (t, J= 5.0 Hz, 4H), 3.76 (t, J= 4.9 Hz, 4H), 3.70- 3.42 (m, 26H), 3.30 (s, 3H, -CH3), 3.27 (s, 6H), 2.48 (s, 6H, -CH3), 2.24 (q, J=7.6 Hz, 2H, -CH2), 1.46 (s, 6H, -CH3), 0.92 (t, J=7.6 Hz, 3H, CH3) 13C NMR (100 MHz, CDCl3) δ 153.7, 153.6, 139.7, 139.0, 138.2, 132.7, 130.7, 130.6, 108.0, 72.7, 72.0, 71.9, 70.9, 70.7, 70.6, 70.5, 69.7, 69.2, 59.0, 29.6, 17.0, 14.5, 11.6
2.3.7 Synthesis of Compound (26)
Figure 42. Synthesis of compound 26.
2-Picolyl chloride hydrochloride, 24, (27.45 mmol, 4.5 g) and aniline, 25, (9.15 mmol, 850 mg) were refluxed in 100 mL CH3CN. Solvent was evaporated under reduced pressure and exctrated with NaHCO3solution and organic phase was collected. Solvent was evaporated and compound 26 was purified by column chromatography with an eluent, CH3OH; CHCl3 (95; 5 v/v). Brown crystal compound (8.0 mmol, 2.20 g, 87%) [62]
1H NMR (400 MHz, CDCl3) δ: 8.47 (d, J=4.0 Hz, 2H), 7.50-7.47 (m, 2H), 7.16 (d, J=7.6 Hz, 2H), 7.07- 7.03 (m, 4H), 6.62- 6.60 (m, 3H), 4.70 (s, 4H, -CH2)
2.3.8 Synthesis of Compound (27)
Figure 43. Synthesis of compound 27.
To a cooled (5 oC) solution of freshly distilled anhydrous DMF (25 mL) was added POCl3 (615 mg, 4 mmol) within 5 min. The mixture was stirred for 30 min, then 26 (1.0 g, 3.30 mmol) was added and the resulting mixture was heated for 3h at 80oC. The mixture was hydrolyzed by slow addition of ice-cold water and then neutralized with 5 M NaOH. The product was extracted with CHCl3 and washed with water and dried with Na2SO4. After evaporation of the solvent in vacuo, the product was purified by column chromatography eluting with hexane acetone (2:1) to afforded the aldehyde 27 in 80 % yield, as a viscous liquid: 810 mg.[62]
1H NMR (400 MHz, CDCl3) δ: 9.60 (s, 1H, Al-H), 8.50 (d, 2H), 7.55 (m, 4H), 7.10 (m, 4H), 6.70 (d, 2H), 4.80 (s, 4H, -CH2).