І О
Í6
6/
e z s f Г ':. L V 'Λ ί ': Г ' iz ^ ' » .. .·,^«|Γ ^ .-’' ‘*· *'· '' '^ ' -ЧГ.* ·**jr ’; . '• -*1 ^', *:» . '-V ..V г J · . ' · ■ ^ ^.. Ιΐ ^ί ?*. !t r^ T* *V *” ** Лк ·» , mAN APPLICATION TO ISTANBUL SECURITIES EXCHANGE MARKET
PORTFOLIO SELECTION METHODS :
A THESIS
SUBMITTED TO THE FACULTY OF MANAGEMENT
AND THE GRADUATE SCHOOL OF BUSINESS ADMINISTRATION OF BILKENT UNIVERSITY
IN PARTIAL FULFILLMENT OF THE REQUIREMENTS FOR THE DEGREE OF
MASTER OF BUSINESS ADMINISTRATION
By
Mustafa Cem Tuntaş December 1991
H G ¿1?гэ
• r g r
I certify that I have read this thesis and that in my opinion it is fully adequate, in scope and in quality, as a thesis for the degree of Master of Business Administration.
- l ·
Assistant Prof.Dr. Giilniir M^./ § e n g ü l /(Principal Advisor)
<y j
I certify that I have read this thesis and that in my opinion it is fully adequate, in scope and in quality, as a thesis for the degree of Master of Business Administration.
I .
W ■' J 1-' \ —
Associate Prof.Dr. Kür^at Aydogan
I certify that I have read this thesis and that in my opinion it is fully adequate, in scope and in quality, as a thesis for the degree of Master of Business Administration.
Assistant Prof.Dr. Erdal Erel
Approved for the Graduate School of Business Administration.
Lx ^
Prof. Dr. Sübidey''Togan, Director of Graduate School of Business Administration
ABSTRACT
AN APPLICATION TO ISTANBUL SECURITIES EXCHANGE MARKET
M.Cem Tunta?
Master Of Business Administration In Management Supervisor : Assistant P r o f .D r .GULNUR M. ?ENGUL
December 1991
PORTFOLIO SELECTION METHODS :
In this study, frequently used Portfolio Theories are described and The Markowitz Mean Variance Model is used for the construction of the efficient frontier. In the construction of the efficient frontier daily price data from Istanbul Securities Exchange Market's First Market stocks during January 1 1990 - January 1 1991 period is used and the method is found useful for the ones who do not have insider information.
KEYWORDS : Stock, Portfolio, Efficient Frontier, Return, Standard deviation. Risk, Diversification, Quadratic Programming.
ÖZET
İSTANBUL MENKUL KIYMETLER BORSASI İÇİN B İR UYGULAMA
PORTFÖY SEÇİM YÖNTEMLERİ :
M. Cem T u n taş
İşletm e Y önetim i Yüksek Lisansı
Tez Y ö n eticisi : Yard. Doç. Dr. GÜLNUR M. ŞENGÜL Aralık 1991
Bu çalışm ada genel olarak kullanılan Portföy Teorileri açık lan m ış ve Mar kow itz O rtalam a Varyans Modeline göre E tk in lik S ın ın oluşturulm uştur. E tk in lik S ın ırın ın oluşturulm asında İstanbul Menkul K ıym etler Borsası 1 Ocak 1 9 9 0 - 1 Ocak 1 9 9 1 dönem i B irin ci Pazar Hisse S e n etleri günlük k a panış fiy at verileri k u ilan ılm ıştır ve bu m ethod Ş irk e t içi bilgiler elde ede m eyen k işiler için uygun bulunm uştur.
ANAHTAR KELİM ELER : Hisse Sened i, Portföy, E tk in lik S ın ın , G etiri, S ta n dard Sapm a, R isk , K uadratik Program lam a.
ACKNOWLEDGEMENT
Special thanks to my thesis supervisor Assistant Prof.Dr. Giilnur M. §engiil for her guidance and patience through out this study. I also thank to Assistant Prof.Dr. Erdal Erel and Associated Prof. Dr. Kiir^at Aydogan for their valuable comments and advises.
Finally, I thank to Mr.Güven Sak head of the Development Department of the Capital Market Board for his patience and valuable helps.
To My Parents Fatma and Yaşar
I. INTRODUCTION; 1
A. RISK INVOLVED IN SECURITY H O L D I N G ... 3
B. TURKISH FINANCIAL ENVIRONMENT: 3
II. LITERATURE REVIEW: 6 A. MODERN PORTFOLIO METHODS: ... 6
A.l Mean-Variance Portfolio S e l e c t i o n ...6
A . 2 Index Models ... 7
B. C A P M ... 8
C. FACTOR MODELS AND ARBITRAGE PRICING THEORY: 9 C.l Factor Models ... 9
C.2 Arbitrage Pricing Theory ... 10
D. OTHER METHODS: 10
III. METHODOLOGY: 12 A. METHOD: ... 14
A.l Definition of Variables ... 14
A . 2 Finding The Weights Of Each Security ... 16
A.3 Efficient Frontier ...18
T V . DATA 19 V. FINDINGS: 20 A. PERFORMANCE OF THE M E T H O D ...23
VI. CONCLUSIONS AND RECOMMENDATIONS 28
APPENDIX A : STOCKS USED IN QUADRATIC SOLUTION 30
APPENDIX В : FINDINGS OF QUADRATIC PROBLEM 32
APPENDIX C : CALCULATION OF THE VARIABLES 33
REFERENCES : 39
LIST OF TABLES
TABLE 1 : PORTFOLIO RETURNS AND STANDARD DEVIATIONS... 20
TABLE 2 : RETURNS AND STANDARD DEVIATIONS OF STOCKS
USED IN 11 PORTFOLIOS... 21
TABLE 3 : PERFORMANCE OF THE PORTFOLIOS ... 24
LIST OF FIGURES
FIGURE 1 : EFFICIENT F R O N T I E R ... 18
FIGURE 2 : EFFICIENT FRONTIER FOR ISE ... 22
FIGURE 3 : PERFORMANCE OF THE PORTFOLIOS ... 25
FIGURE 4 : PERFORMANCE OF THE PORTFOLIOS (3.DAY)... 26
f i g u r e 5 : PERFORMANCE OF THE PORTFOLIOS (7.D A Y ) ... 26
f i g u r e 6 ; PERFORMANCE OF THE PORTFOLIOS (11.D A Y ) ...27
FIGURE 7 : PERFORMANCE OF THE PORTFOLIOS (18.D A Y ) ... 27
NOMENCLATURE :
THE NOTION USED IN THIS STUDY IS PRESENTED BELOW :
j = Covariance between security i and security j. o*j= Variance of return for the security j.
= Beta of security i.
D(i,t) = Dividend and payments for the i^^ security on date t.
E(Rj^) = Expected return of security i E(Rpj^) = Expected return of portfolio i E(Pj^) = Expected return of portfolio i
Ej^ = Average rate of return of the i^^ stock i = Securities 1,2,3,....n
j = Securities l,2,3,....n
K = Nominal payment for the stock at the split
m = Number of securities to be received at the end of n = number of periods.
P(t) = Price of stock split right on quotation P(t+l) = Price of new quotation on the period (t+1) P^ = Daily Price of each security at date t.
R(i,t) = Daily return of each security i on date t Rate of return on the period t
r,· · = Correlation Between Security i and j.
STDp = Standard deviation of the portfolio = Variation of portfolio i.
= weight of security i
I. INTRODUCTION
The aim of this thesis is to select the optimal portfolio by using Markowitz efficient frontier with the data obtained from the Istanbul Stock Exchange Market.
In Turkey most of the financial intermediaries use accounting methods (such as balance sheets, ratios, etc.) for
finding the optimal portfolios. But these methods are not
sufficient to reach optimal results because such data are not accurate and contain only the unsystematic risks of the firms which are unique to a particular company, being independent of economy, politics, and other factors that affect stocks in a systematic manner.
Most of the forecasting methods uses past data for future predictions as the mean-variance method does. But, in the economies like Turkish economy where there is so much fluctuation and where it is hard to make long term predictions , data collection methods become more difficult and important.
So, in Turkey there is a need for finding a better way of preparing optimal portfolios. This thesis attempts to develop a better approach for portfolio choice, which gives the advantage of risk diversification, which contains portfolios containing minimum expected deviation of return around the mean. In other words, the portfolios on the efficient frontier have less standard deviations than the individual stocks with the same expected return.
This thesis also serves especially to the ones who can not get insider information about stocks and who decide to make short term investment because of the fluctuating economy which makes future predictions of the efficient portfolios unclear and need for capital.
A. RISK INVOLVED IN SECURITY HOLDING
The total risk involved in security holding can be separated into two parts :
1.Systematic risk: This part of the risk is due to the overall market risk (such as changes in the national or world economy), and it can not be diversified a w a y .
2.Unsystematic risk: This type of risk is unique to a particular company, being independent of economy, political, and other factors that affect securities in a systematic manner. And it can be diversified or it is avoidable.
So while selecting optimal portfolios, we need to know the risks that we are involved with in order to minimize them.
B. TURKISH FINANCIAL ENVIRONMENT:
Before dealing with common stocks in Turkey we have to know the external factors which affect systematic risks of the stocks and the recent history of Istanbul Stock Exchange and Turkish financial markets.
In Turkey, the regulatory studies about securities
markets started in 1981 by the enactment of the Capital Market
on the areas which they will transfer their funds. Therefore, he/she has to rely on the information he/she obtains about the securities. The regulations that started under the control of the Capital Market Board are important in this sense since they provide the secure and determined markets for the investors.
During the period between 1982 and 1985, securities
markets were defined one by one (See referance [6] for more
information), the rules of issuance were determined and the
working rules of financial intermediaries were s e t . [6]
In 1985, by the foundation of ISE the regulation of
secondary markets was started. Meanwhile, financial tables and
reports were bounded by certain standards.
The regulations that took place after 1985, were related
to setting accounting standards and defining working rules of
independent auditing firms. The securities market can be
classified as primary and secondary markets.
In primary markets, securities are issued for the first
time and funds are directly transferred to investors. It can be
said that public sector has an average share of 90% in primary
markets after 1984 [6]. This high percentage can be explained by the increase in issuance of public securities due to the strategy of turning to domestic borrowing in financing the budget deficits.
On the other hand, the private sector was unceartain in issuing securities. This in turn shows that private sector does not want to cut off its relations with banks and does not see the
securities markets as a permanent financing tool. After 1985, the
confidence of private sector in securities markets increased due
to banks acting as financial intermediaries in these markets.
In secondary markets, where the issued securities are
exchanged, again the banks are dominant institutions. Banks have
90% of the securities exchange volume in secondary markets. This
is the result of the activities of banks on public securities.[6]
Since 1980, the Turkish Government has implemented
several reforms aimed at liberalizing its banking dominated
financial system.
The financial reforms in Turkey since 1980 were
designated to reduce state intervention and increase the role of
markets in the operation of the financial system. The reforms
included the abolishment of interest rate ceilings, reductions in both the reserve and liquidity requirements, the introduction of new financial instruments and markets and the allowance of foreign competition.[15]
As a result, unstabilized Turkish financial
liberalization process creates fluctuations in the Turkish economy which makes future predictions of the efficient frontier unclear.
II. LITERATURE REVIEW
A. MODERN PORTFOLIO METHODS:
A.l Mean-Variance Portfolio Selection
The basic elements of modern portfolio theory emanate
from a series of propositions concerning rational investor behavior set forth by Hanrry M. Markowitz briefly in 1952.[14]
Markowitz provided a theoretical framework for the
systematic composition of optimum portfolios. He applied the
complex mathematics of quadratic programming to the question of how to select from among hundreds of individual securities, given certain basic information to be supplied by security analysts and portfolio managers, and how to weight these selections in composing portfolios. He made it clear that purchases and sales of individual securities are significant only to the extend that they affect the overall risk/return prospects of the entire portfolio.
The central theme of Markowitz's work is that rational investors should conduct themselves in a manner which reflect their inherent aversion to absorbing increased risk without compensation
by an adequate increase in expected return. This meant, to
Markowitz, that for any expected rate of return (where the expected return is the mean of a probability distribution), most investors will prefer a portfolio containing minimum expected deviation of return around the mean. Thus , risk was defined by Markowitz as the
uncertainty, or variability of returns, measured by the standard deviation of expected returns around the m e a n . [5]
A . 2 Index Models
Simplified models of the relations among securities' rates of return can provide substantial reductions in the effort required to prepare and process the data for a portfolio analysis.
[2 0 ]
Briefly, single index model simplifies the portfolio selection problem in two ways:
1. The number of parameters to be estimated are reduced
2. The solution of the problem is simplified
numerically. In particular, we no longer need to solve quadratic programming problem.
The return on each security is assumed to be related, to a greater or lesser extent, to the level of one or more of the
indexes. Relationships among securities derive from common
relationships with the indexes. A particularly simple but practical model uses only one index. These indexes can be:
1. The gross national income 2. Per-capita income
Superficially, index models bear a close resemblance to the results obtained when markets are assumed to be perfect, investors are assumed to completely agree with one another, and borrowing and lending are assumed to be available on identical terms. Under such conditions all efficient portfolios are perfectly correlated with one another, and the appropriate measure of risk is volatility-a concept closely related to the responsiveness of rate of return to changes in the level of a single index.To obtain an efficient portfolio in such a world, one need only invest in a cross section of the market, borrowing or lending to the extend required to obtain an appropriate combination of risk and expected r e t u r n . [18][7j
B. CAPM
The capital asset pricing model (CAPM) was developed by building on the portfolio theory pioneered by Markowitz. William Sharpe in 1967, John Mossin in 1967 laded the basis for the CAPM. As a model of general equilibrium in the market, the CAPM provides explicit implications with respect to the behavior of security prices, the sort of risk-return relationship that one would expect, and the appropriate measure of risk for securities. The CAPM has had, in turn, a wide-ranging impact on such area of security valuation, risk analysis, and performance m e a s u r e . [8]
Although САРМ builds on the Markowitz model it has additional assumptions:
1.Unrestricted borrowing and lending at the risk-free rate.
2.Investors have homogeneous expectations regarding the means, and coveriances of security returns.
3 .N0 taxes and no market imperfections such as
transection costs.
c. FACTOR MODELS AND ARBITRAGE PRICING THEORY:
C . 1 Factor Models
The distinctive features of Factor Model can be
summarized as follows:
1. Covariances among securities can be attributed to the pull of some common "factors” .
2. Different securities are differently sensitive to different factors.
The model can be both one-factor or multi-factor model. And we can identify some of the factors c's:
1. Unanticipated inflation
2. Change in expected inflation
3. Change in the term structure of interest rate
4. Change in the expected level of industry production
с. 2
Arbitrage Pricing TheoryThis model, formulated by Ross (1976,1977) [2] is less restrictive than the CAPM in that it holds in both single-period and multi-period settings. Unlike the CAPM, APT assumes that returns are generated by a factor model. Furthermore, it only requires markets to be perfect and investors to have utility functions that are monolotically increasing and concave. Thus, the CAPM assumptions of quadratic utility functions or normally distributed returns are not necessary in deriving the asset pricing equation of APT.
D . OTHER M E T H O D S :
THE BLACK MODEL: The Black Model (1972) [2] is identical to the Markowitz model interms of its formulation except that the nonnegativity constraint on security weights is removed. The shape and composition of the opportunity set and efficient frontier for a given set of securities are greatly altered by the removal of this constraint.
THE TOBIN MODEL: One of the underlying assumptions for both the Markowitz and Black models was that all securities had positive variance. The Tobin (1958; 1965) [2] model removes this assumption by allowing for the existence of a security that has
no risk. However, the nonnegativity constraint of the Markowitz model is imposed on all securities except for this risk-free asset. Short selling of this risk-free asset is tantamount to borrowing funds at a cost equal to the risk-free asset's rate of return.
THE MODIFIED TOBIN MODEL: The Black model removed the nonnegativity constraint on the weights that was presented in the Markowitz model, but still requires all securities to have nonzero variances. When a risk-free asset is introduced to the Black model, the efficient frontier becomes linear and is tangent to a risky portfolio on the upper half of the hyperbola. The modified Tobin model differed from Markowitz and the Black model in that a risk free borrowing and lending rate was added to the set of n risky secu r i t i e s .
DYL AND BRENNAN MODELS: A third alternative way of treating short selling has been proposed by Dyl (1975) [2]; it allows short selling, but imposes margin requirements.
The Brennan model (1971) [2] differs from the modified Tobin model by having the risk-free borrowing rate, Rf, be greater than the risk-free lending rate, Rl. in this model the resulting efficient frontier has two linear components and a strictly concave c o m p o n e n t .[2]
Briefly, both the Dyl and Brennan models result in concave efficient frontiers and in both cases efficient frontier theorem holds.
III. METHODOLOGY
The methodology used in this thesis is the Standard Mean- Variance Portfolio Selection Model. This model is chosen because of its logical assumptions which are closer to the rational investors behavior. This means that for any expected rate of return most investors will prefer a portfolio containing minimum expected
deviation of return around the mean. Mean-Variance Portfolio
Selection Model uses standard deviation from the mean as the measure of risk. Single Index Model, CAPM, and APT use beta (в coefficient of the regression equation of stock return to index return) as the measure of risk which measures the fluctuations in
stocks returns as a function of the overall market
fluctuations.(See Part II for more information)
The assumptions of this model is the same with the Markowitz model.
The Markowitz model (mean-variance model) consider these a s s umptions:
1. The investor seeks to maximize his or her expected utility of terminal wealth.
2. The investor has a single-period horizon. 3. The investor is risk averse.
4. The investor will choose his or her optimal portfolio on the basis of means and standard deviations of
r e t u r n s .
5. Markets are perfect in that transaction costs and taxes do not exist, investors are price takers, and securities are infinitely divisible so that partial shares can be purchased if necessary.
6. The weights of each security are positive.
7. None of the correlation coefficients among the n securities has a value of -1, none of the n
securities has standard deviation equal to zero, and at least two of the n securities have different
levels of expected returns.[2]
According to the mean-variance rule, a portfolio (a) is dominant to another (b) iff, { Ea > Eb and Va =< Vb} or { Ea >= Eb and Va < Vb }.
Ej^ = Expected return of portfolio i Vj^ = Variance of portfolio i.
In the "standard" portfolio selection model, an investor is to choose fractions X I , X 2 , .... ,Xn invested in n securities
subject to constraints.[14] n
S Xj^ = 1
i=l Xj^ => 0 i = 1, . . . . ,nIn the construction of the efficient frontier there are four classes of calculations :
1.Short selling allowed with riskless lending and borrowing.
2.Short selling allowed with no riskless lending and bo r r o w i n g .
3 . N0 short selling allowed with riskless lending and
borrowing.
4. No short selling allowed with no riskless lending and borrowing.
In short selling the investor sells short with the expectation that the prices of stocks will go down. Then the difference between the selling and the buying price becomes the positive return for the short seller, if the selling price is greater then the buying price. In this thesis no short selling is allowed with no riskless lending and borrowing.
A. METHOD:
A.l Definition Of Variables
DAILY RETURNS: Daily return of each individual securities are calculated as :
R(i,t) = {[P(t) - P(t-l)]+D(i,t)} / [P(t-l)]
R(i,t) = Daily return of each security i on date t P(t) = Daily Price of security i at date t.
D(i,t) = Dividend and payments for the i^^. security on date t.
AVERAGE RETURNS;
n
Ei = = (B R^)/n
i=l
Ej^ = Average rate of return of the i n = number of periods. th stock VARIANCE OF RETURN: n {S [(Ri,t)-Ei]2} i=l
= Variance of return for the
security i.
COVARIANCE BETWEEN THE SECURITIES:
04 -i = r^ j oj = Covariance between security i
and security j .
r j = Correlation Between Security i and j .
CORRELATION BETWEEN SECURITIES:
r4 ^ = [04 J / (o4.o^)] = Correlation between security i and j .
Oj^ = Standard deviation of return for the security i, oj = Standard deviation of return for the security j .
PORTFOLIO RETURNS: n
Rp = S4 (Xi Ei) i=i
X| = Weight of security i.
Ej^ = Expected return of security i.
PORTFOLIO VARIANCE: n n
o2 = 2) [S (Xi X. Oi .) ]
^ i=l j=l ^ ^ Xj^ = Weight of security i, Xj = Weight of security j . BETA OF PORTFOLIOS: n Bp = E. (Xi Bi) i=l Bj^ = Beta of security i.A . 2 Finding The Weights Of Each Security
The weights of each security in the portfolio can be found by quadratic programming.
n n
MIN. STDp= E
[2 (X^ X-j COV^j)]
i=l j = l n nE [(X^) E(Ri)] = E(Rp^)
ST. 1.2
.
1=1 2 (Xi) = 1 i=l 3. Xj^ , Xj => 0 i = Security l,2,3,....,n j = Security l,2,3,....,n Xj^ = Xj = Weights of securitiesE(Rj^) = Expected return of security i E(Rpj^) = Expected return of portfolio i
COVj^j = Covariance between security i and j
For the solution of the average daily returns, daily standard deviations of the stocks and for data collection quatro- pro is used.
In the calculation of the covariances of the stocks minitab is used.
For the solution of the quadratic programming problems, Hyper-Lindo 1987 version is used (See references [4]&[10] for more information).
The quadratic problem solved in this thesis includes 49 stocks. It has 100 constraints and 100 variables. In order to solve this promlem in a PC, we need a 8087 coprocessor and minimum 555 K free memory.
STDp = Standard deviation of the portfolio
A.3
Efficient Frontier
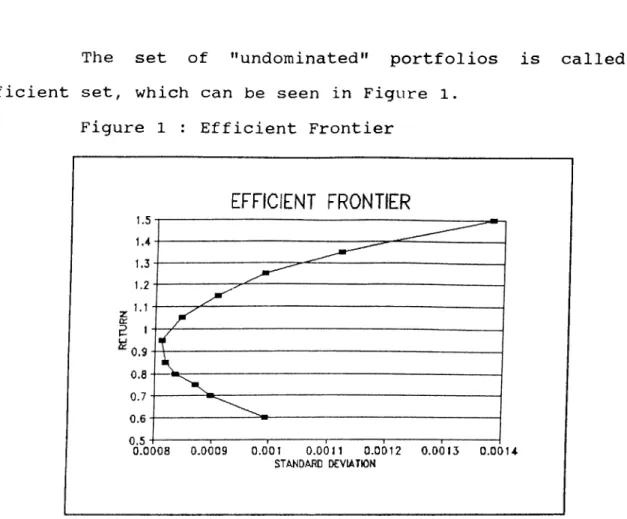
The set of "undominated" portfolios is called the
Efficient set, which can be seen in Figure 1. Figure 1 : Efficient Frontier
EFFICIENT FRONTIER
By looking at the Efficient Frontier we can select efficient portfolios with a given return and find their standard deviations or vice verse.
Given the efficient set, which portfolio is optimal for a particular investor depends on that investor's attitude toward risk. That is, if the investor is risk averse then he/she prefers portfolios with less risk, if he/she is risk seeker then he/she prefers portfolios with higher risk or in other words portfolios with higher return. So higher the risk of the portfolio, higher the return.
In the construction of the efficient frontier daily closing price data from Istanbul Securities Exchange Market's First Market stocks during January 1 1990 and January 1 1991 are collected for each security in order to see daily fluctuations and allow new data for the calculations of short-term investment.
The data will consist of closing values(TL), of each security and the market (ISE).
An important difficulty in data collection is to find the stock splits of securities. In order to prevent wrong calculations , we need to modify the price data with the formula b e l o w . [*]
= [P(t+1) - K - P(t/m)] / P(t/m)
Ri = Rate of return stock i on the period t.
P(t+1) = Price of new quotation on the period (t+1) P(t) = Price of stock split right on quotation
m = Number of securities to be received at the end of stock split.
K = Nominal payment for the stock at the split
Because of the limitations of the programs ( Minitab and Hyper Lindo at about 16.000 data) , I had to eliminate the stocks which have negative and zero average daily returns in order to run the programs. So, there are 49 stocks left for the solution of the quadratic programing which can be seen in Appendix A
IV.
DATA
[*]. Garanti Bank Securities Department.
The analysis of the portfolios on the efficient frontier is done as described in part III and the stocks that are generally used after the quadratic solution are Aksa, Eczacî Yatîrîm, Interna, Mardin çimento, Pînar Un, Polylen, Tezsan, T.IS Bankasî-A, T.SiSe Cam as can be seen in Appendix B (See Appendix A for all other stocks that are used in calculations).
When we compare the portfolios we obtained by quadratic solution (See Appendix B) we see that Aksa and Tezsan have higher weights in all of the portfolios relative to the other stocks as they have less risk and higher return.
The portfolios contain different stocks from different sectors. There is no dominating sector but Aksa and Tezsan which have the greatest share are in the Textile and Machine industry respectively appear in all portfolios.
TABLE 1 : Portfolio Returns and Standard Deviations
V.
FINDINGS ;
)LI0 NO : (Daily) RETURNS STD 1 % 0024 0.000993 2 % 0028 0.000897 3 % 0030 0.000871 4 % 0032 0.000836 5 % 0034 0.000819 6 % 0038 0.000812 7 % 0042 0.000846 8 % 0046 0.000907 9 % 0050 0.000989 10 % 0054 0.001120 11 % 0060 0.00138020
TABLE 2 :
Returns and Standard Deviations of Stocks Used
in 11 Portfolios
STOCK NAME: (Daily) RETURNS STD AKSA % 0062 0.052 ECZ.YAT % 0112 0.058 INTEMA % 0097 0.076 MARDİN.Ci % 0078 0.117 PINAR UN % 0053 0.050 POLYLEN % 0040 0.068 TEZSAN % 0013 0.038 T. IS-A % 0049 0.049 T.SISE CAM % 0069 0.057When we compare portfolio standard deviations and stock standard deviations in Table 1 and Table 2 we easily see that portfolio standard deviations are smaller than the individual s t o c k s '.
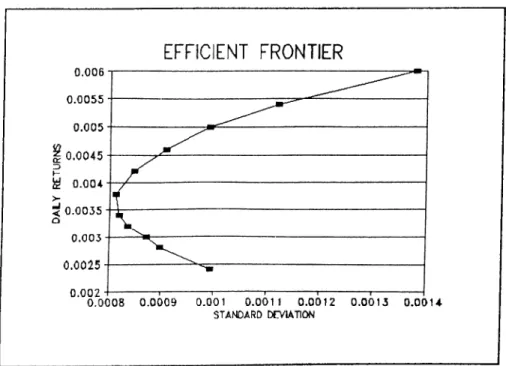
As it can be seen from the Figure 2 the standard deviations of portfolios are decreasing to 0.0038 return and then they tend to increase . This shows that efficient frontier is quadratic and convex. So, as the return of the portfolios increase the risks involved increase.
Figure 2 :
Efficient Frontier For ISE
0.0008 0.0009 0.001 0.001 1 0.0012 0.0013 o . o o u
STANDARD DCVIATION
Portfolios 1, 2, 3, 4, 5, have Inferior Performance, as there are other feasible portfolios with the same standard deviations that have higher returns. So these portfolios are not on the efficient frontier.
A. PERFORMANCE OF THE METHOD
As it is described in the part III and IV the method used in this study is the mean variance method and used daily data for short term investment and suggest that one should recalculate the new portfolios every week or at least every month.
This method is a very useful tool for the professional portfolio manager and companies which decide to invest their capital for a short period. The method has high performance when it is updated daily and used for short term investments.
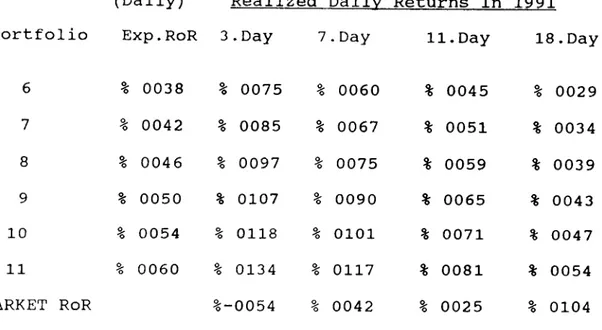
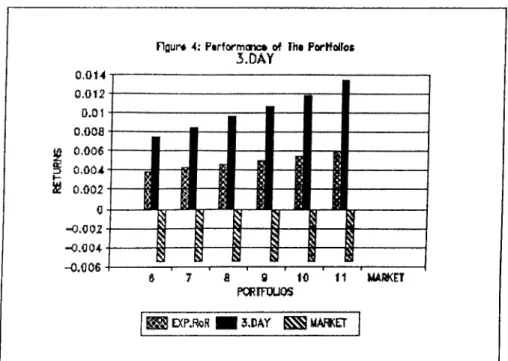
In Table 3 the actual returns of the portfolios are compared with the expected returns of the portfolios which are calculated by the mean variance method. Expected returns of the portfolios are in the first column and the realized returns are in the second, third, forth, and fifth columns respectively.
Expected returns of the portfolios are forecasted in 31.12.1990 with the yearly data of 1990 and the realized daily returns are calculated 3 days later (03.01.1991), 7 days later
(07.01.1991) , 11 days later (11.01.1991), and 18 days later
(18.01.1991) .
Table 3 : Performance of the Portfolios
(Daily) Realized Daily Returns In 1991
Portfolio Exp.RoR 3.Day 7.Day
6 7 8 9 10 11 MARKET RoR % 0038 % 0042 % 0046 % 0050 % 0054 % 0060 % 0075 % 0085 % 0097 % 0107 % 0118 % 0134 %-0054 % 0060 % 0067 % 0075 % 0090 % 0101 % 0117 % 0042 11.Day % 0045 % 0051 % 0059 % 0065 % 0071 % 0081 % 0025 18.Day % 0029 % 0034 % 0039 % 0043 % 0047 % 0054 % 0104
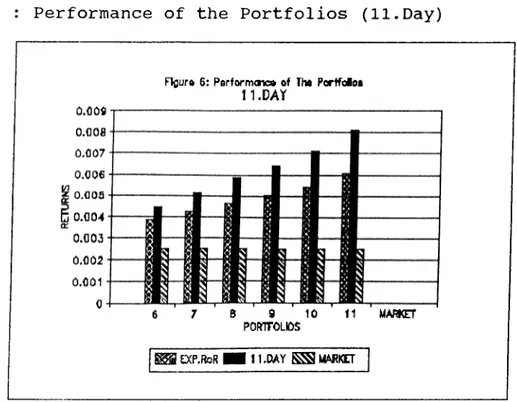
The important thing is that the accuracy of the expected return is high in 03.01.91, 07.01.91, and 11.01.91. In 18.01.91 (18 days after the forcast) the realized returns of the portfolios are smaller than the expected ones. This means that the model is more powerful in predictive abilty for short term investments. (See Table 3 and Figure 3).
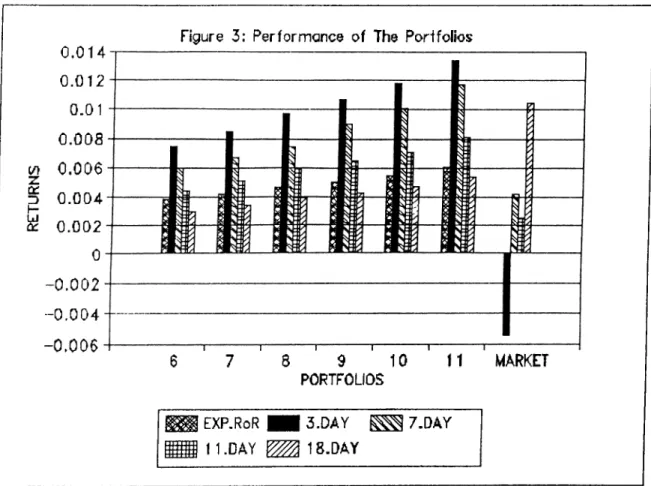
As can be seen from Figure 3, the expected returns of the portfolios are negatively biased in the 3^^, 7^^, and 11^^ days and they have higher returns than the market return.
In the 18^^ day the portfolios are positively biased and have smaller return than the market return, which means that the portfolios' performance were not as high as the market's.
Figure 3 :
Performance of the Portfolios
F ig u re 3: P e r f o r m a n c e of The P o r i fo lio sEXP.RoR
11 .DAY
8
9
10
PORTFOLIOS
3.DAY ^
7.DAY
1
8.DAY
M A R K E T25
Figure 4 :
Performance of the Portfolios (3.Day)
Flgur* A: Ptrformanc· of Ih· PorHolfoi
3.DAY
s k ^ . \ 5 \ j s ! s^ ... I ] 1i g1 j 9 e 7 a 9 10 V 11 ' MARKET PORIKIUOSEXP.R0R |3.DAY gSSMAfyET
Figure 5 : Performance of the Portfolios (7.Day)
riflur« 5: Ptrformanc· of Tht PorMolfot
7.DAY
S g 10 I I MARKET
POR7TOLJOS
DCP.RoR |7,DAr E S MARKET
Figure 6 :
Performance of the Portfolios (11.Day)
Figure 6: Performov» af Th· Portfoloi 11.DAY
B 9 10
PORTTOLIOS
D(P,RoR
I n.DAY E S u m u TFigure 7 : Performance of the Portfolios (18,Day)
Flour» 7: Parformov» »f Th· PerffolM 18.DAY
7 6 9 10 11 UAPKT
POftTrOLOS
D(P.RoR I
te.DlAY MARKETIn Turkey most of the financial intermediaries use accounting methods for finding the optimal portfolios. But these methods are not sufficient to reach optimal results because such data is not accurate and contains only the unsystematic risks of
the firms which are unique to a particular company, being
independent of economic, political, and other factors that affect stocks in a systematic manner. So, in Turkey there is a need for finding a better way of preparing optimal portfolios. This thesis attempts to develop a better approach for portfolio choice, by using the Mean Variance Portfolio Method especially for the ones who can not get insider information about stocks.
One of the advantages of the mean-variance method is that it permits risk diversification by making portfolios. The method chooses portfolios containing minimum expected deviation of return around the mean for a given return. So the portfolios on the efficient frontier have smaller standard deviations than the individual stocks with the same expected return.
In the Mean Variance Portfolio Method it is assumed that past data can be used for predicting future data, so limitations of using past data due to the expectations about the future are valid for this method. The fluctuation in the Turkish economy during the period this study was conducted also limited the predictive ability of the model.
VI.
CONCLUSIONS AND RECOMMENDATIONS
For example, the results of the Gulf crisis in 1990, began to affect the Turkish economy greatly in 1991. In addition
increasing government debts and high inflation resulted in
political instability.
High inflation because of the Gulf crisis caused interest rates to go up and high interest rates decreased demand in the Capital Market. So, in the first quarter of 1991 the stocks in the market did not show the performance as it was expected by the m o d e l .
This shows us that it is hard to predict future returns of stocks in an unstable economy with this method only. So we need to follow world trend of economic changes in each sector in the world and in Turkey in order to prevent from future systematic risks that will be faced. We need to recalculate the new portfolios using the new daily data. In addition to these, we also need to follow accounting information (ratios and balance sheets) of the firms in the Capital Market in order to predict their future performance and follow announcements about stocks (stock splits, dividents) and follow the recommendations of the executives from the weekly economic papers and magazines.
STOCKS USED IN QUADRATIC SOLUTION
APPENDIX A ;
Cl = AKAL t e k s t i l C2 = AKCIMENTO C3 = AKSA C4 = ALARKO C5 = ARCELIK C6 = AYGAZ Cl = AYMAR C8 = BAGFAS C9 = BRISACIO = ÇANAKKALE ÇİMENTO
Cll = ÇUKUROVA ELEKTRİK C12 = DENİZLİ CAM C13 = DEVE h o l d i n g C14 = ECZACI YATIRIM C15 = ECZACI ILAC C16 = EGE b i r a C17 = EGE ENDÜSTRİ C18 = EGE GÜBRE C19 = GÜNEY BİRACILIK C20 = HEKTAS C21 = i k t i s a t f i n a n s a l k i r a l a m a C22 = INTEMA C23 = IZOCAM C24 KEPEZ e l e k t r i k
30
C25 = КОС HOLDING С26 = КОС YATIRIM 0.21 = KOYTAS C28 = MAKINA TAKIM C29 = MARDİN CIMENTO C30 = MARET C31 = MENSUCAT SANTRAL C32 = NETBANK C33= OTOSAN C34 = PINAR ET C35 = PINAR SU C36 = PINAR UN C37 = PIMAS C38 = POLYLEN C39 = SANTRAL HOLDİNG C40 = SARKUYSAN C41 = SIFAS C42 = TEZSAN C43 = T.g a r a n t i BANKASI C44 = T.IS BANKASI-A C45 = T.IS BANKASI-B C46 = T.IS BANKASI-C C47 = T.SIEMENS C48 = T .s i s e c a m C49 = T.d e m i r d o k u m 31
APPENDIX B ;
FINDINGS OF QUADRATIC PROBLEM : Returns of Portfo;
Standard Deviations of Portfolios, And Weights of Stocks in
Portfolio. RETURNS (yearly) : %60 %70 %75 %80 STD (daily) : 0.000993 0.000897 0.000871 0 .000856 STOCKS P1 P2 P3 P4 AKSA % 18 % 24 % 28 % 32 ECZACI YATIRIM INTEMA MARDİN ç i m e n t o % 02 % 02 % 02 % 01 PINAR UN POLYLEN TEZSAN % 78 % 69 % 65 % 61 T.IS BANKASI-A % 02 % 02 % 03 T.SİSE CAM % 02 % 03 % 03 % 03 RETURNS (yearly) : %85 %95 %105 %115 STD (daily) : 0.000819 0.000812 0.000846 0.. 000907 STOCKS P5 P6 P7 P8 AKSA % 34 % 38 % 44 % 49 ECZACI YATIRIM INTEMA % 01 % 02 % 02 MARDİN ç i m e n t o % 01 % 02 % 02 % 02 PINAR UN % 03 % 03 % 05 % 06 POLYLEN % 01 TEZSAN % 55 % 49 % 40 % 32 T.IS BANKASI-A % 03 % 04 % 04 % 05 T .s i s e c a m % 03 % 03 % 03 % 03 RETURNS (yearly) : %125 %135 %150 STD (daily) : 0.000989 0.001120 0.001380
STOCKS P9 PIO Pil
AKSA % 53 % 58 % 66 ECZACI YATIRIM % 03 % 03 % 02 INTEMA % 02 % 02 % 03 MARDİN ç i m e n t o % 01 % 02 % 02 PINAR UN % 06 % 07 % 09 POLYLEN % 01 % 01 % 01 TEZSAN % 25 % 17 % 05 T.IS BANKASI-A % 06 % 07 % 08 T.SİSE CAM % 03 % 03 % 04
32
B. CALCULATIONS AND THE USAGE OF THE VARIABLES
Average Daily Return of each stock is calculated and used as input to find the portfolio returns.
Minimum and Maximum Daily Returns are calculated and used to see the fluctuations in the daily returns of the stocks and used to find the stock splits easily.
Standard Deviations of the stocks are calculated and used as in put to the portfolio standard deviation and used to compare the risks of individual stocks.
Average, Minimum, Maximum Daily Prices of the stocks are calculated and used to see the fluctuations in the price of the stocks and are used to find the data processing errors, if there is any.
Covariances between stocks are calculated and used to see the variances between stocks.
The covariances and average daily returns are calculated and used as inputs to the quadratic formulation described in part III.A.2 (For more information see references [4] & [17]).
APPENDIX C ;
ARAL TEKS AKÇI.
AKSA
ALARKO
ARCELIK
AYGAZSTD :
0.065 0.051 0.052 0.065 0.052 0.046 MIN RoR : -0.110 -0.273 -0.111 -0.521 -0.273 -0.205 MAX RoR : 0.577 0.174 0.274 0.295 0.217 0.194 AVG RoR ; 0.0057 0.0013 0.0062 0.0058 0.0020 0.0065 PERIOD R: 1.54441 -0.00833 1.60417 1.29412 0.15217 2.82979 MIN P : MAX P : 2450 13250 3100 10400 9000 35500 8300 46000 11500 35000 9000 69000AYMAR BAGFAS BRISA CAN.c i m. ÇUKUROVA DE.CAM
STD : 0.046 0.049 0.052 0.056 0.045 0.055 MIN RoR : -0.205 -0.127 -0.133 -0.215 -0.221 -0.158 MAX RoR : 0.194 0.186 0.167 0.224 0.203 0.130 AVG RoR : 0.0065 0.0032 0.0011 0.0031 0.0019 0.0021 PERIOD R:-0.84615 0.64407 -0.05000 0.47368 0.18750 0.04348
MIN P :
MAX P ;
10500 13000 5900 17500 3300 19750 2850 10200 9750 33500 2 0 0 0 690034
DEVA HOL. ЕС.YAT.
ЕС.ILAC EGE.BİRA EGE.ENDU EGE.GUB
STD
0.052 0.058 0.054 0.048 0.056 0.055 MIN RoR : -0.153 -0.181 -0.155 -0.125 -0.400 -0.147 MAX RoR : 0.190 0.246 0.208 0.203 0.170 0.188 AVG RoR : 0.0061 0.0112 0.0071 0.0031 0.0044 0.0013 PERIOD R: 1.98182 8.79592 1.10714 0.70149 1.52632 -0.44565 MIN P : 6700 12250 14750 15000 3900 775 MAX P : 38000 170000 85000 40000 16000 7400GUNEY.BI. HEKTAS I K T I .FIN INTEMA IZOCAM KEPEZ.ELE
STD 0.052 0.056 0.046 0.076 0.053 0.062 MIN RoR : -0.146 -0.145 -0.130 -0.184 -0.135 -0.364 MAX RoR : 0.205 0.195 0.200 0.652 0.191 0.257 AVG RoR : 0.0027 0.0016 0.0019 0.0097 0.0023 0.0030 PERIOD R: 0.39610 -0.04896 0.23529 2.88235 0.22667 0.27660
MIN P :
MAX P :
7300 15250 3750 17000 1700 3300 8500 53000 5900 29000 11750 2325035
кос.HOL КОС.YAT. KOYTAS MA.TAKIM MARDİN.CI MARET
STD :
0.068 0.083 0.058 0.058 0.117 0.061 MIN RoR : -0.596 -0.389 -0.140 -0.191 -0.565 -0.148 MAX RoR : 0.271 0.782 0.194 0.216 1.234 0.259 AVG RoR : 0.0050 0.0053 0.0043 0.0026 0.0078 0.0006 PERIOD R: 0.35135 0.69355 0.91912 0.26957 1.13889 -0.29670 MIN P : 10500 8700 1300 6600 18000 1800 MAX P : 61000 26500 38500 34500 135000 9800MENSU.SANNETBANK OTOSAN
PIN.ET
PIN.su PIN.
UNSTD : 0.059 0.065 0.062 0.058 0.054 0.050 MIN RoR : -0.397 -0.414 -0.358 -0.288 -0.150 -0.105 MAX RoR : 0.207 0.304 0.286 0.190 0.229 0.325 AVG RoR : 0.0015 0.0005 0.0006 0.0015 0.0013 0.0053 PERIOD R:- 0 . 08475 -0.34211 -0.28866 -0.06250 -0.04762 1.71429
MIN P :
MAX P :
4400 13250 1050 7800 5900 34000 500 2600 900 2900 2100 900036
PIMAS
POLYLEN SANTPAL SARKUYSAN
SIFAS TEZSAN
STD ;
0.065 0.068 0.058 0.044 0.054 0.038 MIN RoR : -0.181 -0.348 -0.169 -0.138 -0.190 -0.246 MAX RoR : 0.537 0.625 0.151 0.134 0.178 0.239 AVG RoR : 0.0026 0.0040 0.0022 0.0015 0.0038 0.0013 PERIOD R: 0.17742 0.76190 0.08434 0.14894 0.76866 0.15152 MIN P : MAX P : 2950 9600 3000 11750 18500 61000 21000 48000 6500 31000 4600 9400GARANTI IS-A IS-B IS-C SIEMENS SISE.CAM
STD : 0.074 0.049 0.060 0.059 0.055 0.057 MIN RoR : -0.414 -0.219 -0.219 -0.179 -0.176 -0.183 MAX RoR : 0.611 0.582 0.281 0.217 0.150 0.190 AVG RoR : 0.0010 0.0049 0.0051 0.0052 0.0019 0.0069 PERIOD R:-0.22222 1.63158 1.57143 1.33333 -0.58475 2.80000
MIN P :
MAX P :
3150 190000 12250 3250 11000 5000 6800 720000 42500 13000 64000 2950037
D .DOKUM
STD :
0.082 MIN RoR : -0.464 MAX RoR ; 0.689 AVG RoR : 0.0042 PERIOD R: 0.16000 MIN P : MAX P : 4500 23000(See part III.A for the definitions and formulas of var i a b l e s ) .
R E F ERENCES:
[1] . Akgiray Vedat , "Course 570 Notes” . Unpublished
Manuscript,1990.
[2] . Alexander Gordon J. , Francis Jack Clark, "Portfolio
A n a lysis" , Prentice Hall Foundations (1986), pp. 42-70 ; 106,116 ;
238.
[3] . Avriel Mordecai , "Nonlinear Programming". Prentice
Hall (1976), p p . 185,189.
[4] . Bazaraa S. Mokhtar, Shelty C.M., "Nonlinear
Programming" . John Wiley & Sons, Inc. (1979), Chapter 11.
[5] . Coher Jereme B., Zinberg Edward D . , Zeirel Arthur ,
"Investment Analysis and Portfolio Management" ,Irwin (1987) pp. 129,184.
[6] . Demircelik Adalet, Sak Güven, Temir Bahsalayis,
"Turkish Securities Reform Program in 1 9 8 0 ^s" , Research and
Development department Capital Market Board (1990).
[7] . Fuller Russell J . , Farrel James L. J r .."Modern
Investments and Security Analysis". Me Graw-Hill (1987), pp.
455,499.
[8] . Garfinkel Robert S., Nemhauser George L. ."Integer
Programming" . John Wiley & Sons (1972), pp. 340,361.
[9] .
Jensen
M .C .."Capital Markets: Theory and Evidence".Bell Journal of Economics and Management Science (Autumn 1972), pp. 357,398.
[10] . Lindo Users Manual, Third Edition, pp. 27-30, The Scientific Press, 1989.
[11] . Lintner John , "Security Prices .Risk, and Maximal
Gains from Diversification". Journal of Finance, vol. 20, no 12 (December 1965) ,pp. 587,615.
[12] . Markowitz Hanrry M. , "Portfolio Selection". Journal
of Finance, vol 7, no 1 (March 1952), pp. 77,91.
[ 13 ]. Markowitz Hanry M . , "Portfolio Selection ; Efficient Diversification of Investments", New Haven Conn: Yale University Press, 1959.
[14] . Markowitz Hanry M. , "Mean- Variance Analysis in
Portfolio Choice and Capital Markets". Basil Blockwell (1987) , pp. 3,14 , pp. 125,143
[15] . "Recent Developments In Capital Markets in Turkey" .
Proceedings of the OECD-CMB Conference, SPK Yayinlari (June 30- July 5, 1985).
[16] . Ross Stephen A.."The Arbitrage Theory of Capital
Asset Pricing". Journal of Economic Theory 13. no.3 (December 1976), pp. 341,360.
[17] . Schittkowski Klaus ."More Test Examples for
Nonlinear Programming Codes", Springer-Verlag (1987) pp. 25,214.
[18] . Sharpe William F. , Alexander Gordon,
"Investments" . Prentice Hall (1990), pp. 2,12 ; 19,30 ; 134,150 ;
184,191 ; 241,264.
[19] . Sharpe William F . ."Portfolio Theory and Capital
M a r k e t s " . Me Graw-Hill (1970), p p . 117,140.
[20] . Sharpe William F. , "Capital Asset Pricing in a
Theory of Market Equilibrium Under conditions of R i s k ". The Journal of Finance (September 1964, vol.l9, no.3, pp. 425,442.
[21] . Turban Efraim, Meredith Jack R. , "Foundations of
Management Science". Business Publications Inc. (1985), pp.
261,262.
[22] . Van Horne James C. , "Financial Management and
Poli c y " , Prentice Hall International, (1986), pp. 56,85.