PLATELET-DERIVED MICROPARTICLES
DIFFERENTIALLY REGULATE MACROPHAGE
POLARIZATION
A THESIS SUBMITTED TO
THE GRADUATE SCHOOL OF ENGINEERING AND SCIENCE OF BILKENT UNIVERSITY
IN PARTIAL FULFILLMENT OF THE REQUIREMENTS FOR THE DEGREE OF
MASTER OF SCIENCE IN
MOLECULAR BIOLOGY AND GENETICS
By
Elif Senem Köksal
ii
PLATELET-DERIVED MICROPARTICLES DIFFERENTIALLY REGULATE MACROPHAGE POLARIZATION
By Elif Senem Köksal September 2016
We certify that we have read this thesis and that in our opinion it is fully adequate, in scope and in quality, as a thesis for the degree of Master of Science.
__________________________________ İhsan Gürsel (Advisor)
__________________________________ Ali Osmay Güre
__________________________________ Kamil Can Akçalı
Approved for the Graduate School of Engineering and Science:
____________________________________ Levent Onural
iii
Abstract
PLATELET-DERIVED MICROPARTICLES
DIFFERENTIALLY REGULATE MACROPHAGE
POLARIZATION
Elif Senem Köksal
M.S. in Molecular Biology and Genetics Advisor: İhsan Gürsel
September, 2016
Platelet-derived microparticles (PMPs) shed from platelets upon activation and constitute almost 90% of the circulating microparticles. Due to their versatile cargo, PMPs were associated with the generation of immunosuppressive microenvironment and and thought to promote tumor growth. They are also potential candidates for prevention and treatment of autoimmune diseases. Macrophages are one of the enigmatic cells of the immune system. They are either categorized as ‘M1-type’, mediating an inflammatory environment or ‘M2-type’, mediating an immune suppressive environment. Cardinal signals resulting M1-tropic or M2-tropic macrophage differentiation is not fully understood. However, it is crucial to understand the inducers of macrophage polarization for therapeutic approaches. We aimed to understand the interaction between PMPs with macrophages and wished to understand mechanistic alterations upon macrophages engage with PMPs.
iv
In this thesis, we showed that activated human platelets released microparticles and they were internalized by macrophages differentiated from THP1 monocytic cell line. Internalized PMPs co-localized with late endosomes. The phagocytic capacity of M2- polarized THP1 macrophages were greater than M1-polarized macrophages. Strikingly, when THP1 derived macrophages were treated with standalone PMPs our results revealed that these macrophage were unable to mount any detectable cytokine secretion related to M1 or M2 type identity. This prompted us to encapsulate TLR agonists within PMPs and harness them as a carrier system. Different TLR ligands including TLR7 (sensing ssRNA) and TLR9 (sensing ss/ds DNA expressing CpG motifs) ligands were incorporated within PMPs via dehydration-rehydration method that was developed in our laboratory. Upon screening of several TLR agonist candidates on healthy donor PBMCs as well as on purified monocytes, we found that M1-like macrophage differentiation was TLR9 agonist D-type CpG oligodeoxynucleotide loaded PMP dependent whereas M2-like macrophage differentiation was dependent on TLR7 agonist R848 loaded PMPs.
In conclusion, this work implicated that PMP treatment of macrophages loaded with suitable ligand combinations might regulate M1/M2 type macrophage differentiation and could be used efficiently either to control tumor development (M1) or to alleviate symptoms of auto-immune/auto-inflammatory diseases (M2).
v
Özet
TROMBOSİT MİKROKESECİKLERİNİN M1- VE
M2-BENZERİ MAKROFAJ KUTUPLAŞMASINA
ETKİLERİ
Elif Senem Köksal
Moleküler Biyoloji ve Genetik, Yüksek Lisans Tez Yöneticisi: İhsan Gürsel
Eylül, 2016
Trombosit microkesecikleri (PMP), trombositlerin aktifleşmesiyle salgılanırlar ve kan dolaşımındaki mikrokeseciklerin neredeyse %90’ını oluştururlar. PMPler kargolarından dolayı bağışıklık sistemini bastıran mikro ortamların üretimi ve tümör büyümesi ile ilişkilendirilmiştir. Ancak PMPler oto-bağışıklık hastalıklarının önlenmesi ve tedavisi için potansiyel adaylar arasında bulunmaktadır. Makrofajlar bağışıklık sisteminin anlaşılmaz hücrelerinden biridir. Makrofajlar M1 pro-inflamatuar ve M2 immunsupresif olarak kategorize edilmiştir. M1-M2 makrofaj kutuplaşmasına neden olan sinyaller tamamen anlaşılmış değildir. Ancak tedavi amaçlı makrofaj kutuplaşmasını indükleyen uyarıları anlamak önemlidir. Biz bu çalışmada makrofajlar ile PMPlerin arasındaki etkileşimi anlamayı amaçladık. Ayrıca PMPlerin temas ettikleri makrofajlardaki değişimleri anlamak istedik.
Bu tez ile aktif insan trombositlerinden salınan mikrokeseciklerin THP1 monositik hücre hattından üretilmiş makrofajlar ile etkileşime girdiklerini gösterdik.
vi
Makrofajlar tarafından hücre içine alınan PMPler, geç endozoma yerleştiler. M2 makrofajına kutuplaştırılmış olan THP1 hücreleri daha gelişmiş fagositik aktivite göstererek daha fazla PMPyi hücre içine aldı. Ayrıca, yaptığımız fonksiyonel çalışmalar PMPlerin pro-inflamatuar M1 ve immunsupresif M2 makrofajlarına kutuplaşmasına veya herhangi bir immün yanıt oluşturmasına neden olmadığını ortaya çıkarmıştır. Bu nedenle, biz PMPleri taşıyıcı sistemler olarak kullanmaya karar verdik ve onları TLR (Toll-like receptor) agonistleri ile birlikte kullandık. TLR agonistlerinden ssRNA’ya bağlanan TLR7 ve CpG’ye sahip ss/dsRNA’ya bağlanan TLR9 agonistini PMP moleküllerinin içine yüklemek için laboratuvarımızda geliştirilen dehidrasyon-rehidrasyon yöntemini kullandık. Farklı sağlıklı donörlerden aldığımız periferik kan hücreleri ve monositleri üzerinde farklı TLR agonistlerini taradığımızda TLR9 agonisti D-tipi CpG oligonükleotit yüklü PMPlerin M1-benzeri ve TLR7-8 agonisti R848 yüklü PMPlerin M2-benzeri immün tepkisi gösterdikleri gözlendi.
Sonuç olarak bulgularımız, makrofajların uygun ligand kombinasyonları ile yüklü PMPler ile muamele edilmesi durumunda M1-M2 makrofaj kutuplaşmasının düzenlenebileceğini göstermiştir. Böylece M1 makrofajları ile tümör gelişimini kontrol edebilir ya da M2 makrofajları ile oto-immün/oto-inflamatuar hastalıkların belirtilerini hafifletebiliriz.
Anahtar sözcükler: Mikrokesecikler. , trombositler, makrofajlar, M1-M2 makrofaj
vii
viii
Acknowledgement
First and foremost, I would like to express my deepest gratitude to my supervisor Prof. İhsan Gürsel for giving me the opportunity to work in his lab and providing his continuous support, guidance, encouragement and patience. It has been a privilege to work with him.
I would like to express my heartfelt thanks to Assoc. Prof. Dr. Ali Osmay Güre and Prof. Dr. Kamil Can Akçalı for accepting to become members of my thesis jury and sparing time to evaluate and improve my thesis.
I feel lucky to be a part of the Gürsel group. I would like to thank past and present members of the Gürsel group: Fuat Cem Yağcı, Tamer Kahraman, Banu Bayyurt, Gizem Tinçer-König, Kübra Almacıoğlu, Begüm Han Horuluoğlu, Gözde Güçlüler, Defne Bayık, Muzaffer Yıldırım, Fehime Kara-Eroğlu and particularly to Begüm Yıldız for their support and friendship. I had to privilege to work alongside great people.
I am especially grateful to be a part of the MBG family where I met amazing people. I would like to thank all my instructors and friends in graduate school for their companionship and assistance.
Without my family, none of the exceptional things in my life would have been achievable. I would like to express my deepest love and thankfulness to my mother Seyya, my father Ahmet, my little sister Yaren and my grandparents Ayşe and İsmail for their invaluable and everlasting support. Their love is the most significant motivation for me, which makes my accomplishments meaningful.
Last but not least, I would like to thank to my dearest husband Hakan for supporting me and cheering me up throughout this period with his constant love, patience and jokes.
ix
Lastly, I would like to thank and express my deepest appreciation to all people who have been supportive throughout this thesis.
I was financially supported by The Scientific and Technological Research Council of Turkey (TÜBİTAK) BİDEB 2210E scholarship during my M.Sc. studies.
x
Table of contents
Abstract ... iii Özet ... v Acknowledgement ... viii Table of contents ... x List of figures ... xvList of tables ... xvii
Abbreviations ... xviii
Chapter 1 ... 1
Introduction ... 1
1.1 The immune system ... 1
1.2 Pattern Recognition Receptors ... 2
1.2.1 Toll-like Receptors... 2
1.3 Immunmodulatory synthetic DNA motif ... 4
1.3.1 Immune stimulatory synthetic DNA motifs ... 4
1.3.2 Immune suppressive synthetic DNA motifs ... 5
1.4 Monocytes & macrophages ... 6
xi
1.4.2 Macrophages ... 6
1.4.2.1 M1 immune stimulatory macrophages ... 7
1.4.2.2 M2 immune suppressive macrophages ... 7
1.5 Megakaryocytes & platelets ... 9
1.5.1 Megakaryocytes ... 9
1.5.2 Platelets ... 9
1.6 Extracellular vesicles ... 12
1.6.1 Platelet-derived microparticles ... 13
1.7 Aim of the study ... 14
Chapter 2 ... 16
Materials and Methods ... 16
2.1 Materials ... 16
2.1.1 General Laboratory & Cell Culture Reagents and Materials ... 16
2.1.2 Recombinants and Other Agents ... 17
2.1.3 CpG ODNs ... 17 2.1.4 PRR Ligands ... 17 2.1.5 Inhibitors ... 18 2.1.6 BCA ... 18 2.1.7 Flow Cytometry ... 18 2.1.8 Confocal Microscopy ... 20
xii
2.1.9.1 Primers ... 20
2.1.10 Reagents for ELISA ... 22
2.2 Solutions, Buffers and Culture Media ... 24
2.2.1 Cell Culture Media ... 24
2.2.2 Platelet Isolation Buffers... 24
2.2.3 Flow Cytometry Buffers ... 25
2.2.4 Agarose Gel Electrophoresis ... 26
2.2.5 ELISA Buffers ... 26
2.3 Methods ... 27
2.3.1 Maintenance of Cell Lines ... 27
2.3.1.1 MEG-01 ... 27
2.3.1.2 THP-1 ... 27
2.3.2 Cryopreservation and Thawing of Cells ... 27
2.3.3 Cell Counting ... 28
2.3.3.1 Hemocytometer ... 28
2.3.3.2 Flow Cytometer ... 28
2.3.4 PBMC Isolation ... 29
2.3.5 Platelet Isolation and Storage ... 29
2.3.6 Platelet activation and PMP Isolation ... 29
2.3.7 Exosome and MP Isolation ... 30
xiii
2.3.9 Cargo Loading to Extracellular Vesicles ... 31
2.3.10 Flow Cytometry ... 31
2.3.10.1 Fixation of Cells ... 31
2.3.10.2 Surface Marker Staining of Cells ... 31
2.3.10.3 Intracellular Cytokine Staining ... 32
2.3.10.4 Surface Marker Staining of EVs with Latex Beads ... 32
2.3.11 SP-DiOC Staining of PMPs ... 32
2.3.12 Binding & Uptake and Internalization Assays... 33
2.3.13 Analysis of PMP Localization with Confocal Microscopy ... 33
2.3.14 Determination of Gene Expression ... 33
2.3.14.1 Total RNA Isolation ... 33
2.3.14.2 cDNA Synthesis ... 34
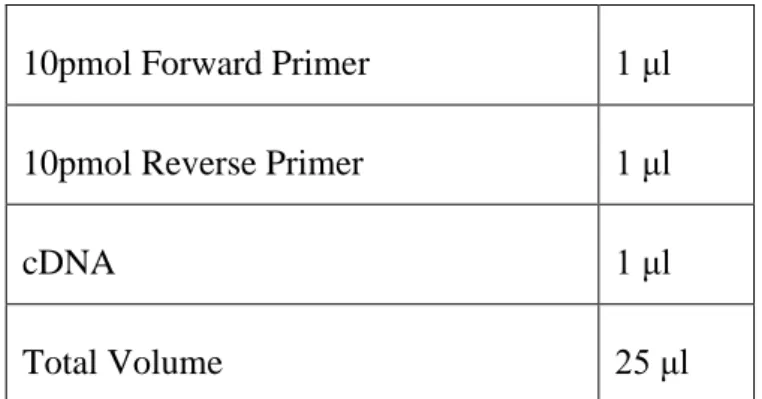
2.3.14.3 PCR ... 34
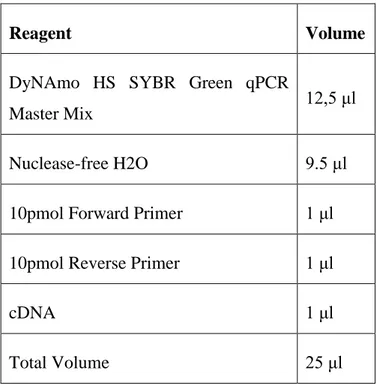
2.3.15.4 qPCR ... 36
2.3.14.5 Agarose Gel Electrophoresis ... 37
2.3.15 Cytokine ELISA... 37
2.3.16 Macrophage Differentiation and Polarization from THP-1 ... 38
2.3.16.1 Macrophage Differentiation ... 38
2.3.16.2 M1-M2 Polarization ... 38
2.3.17 Monocyte Isolation from PBMC ... 38
2.3.18 Macrophage Differentiation and Polarization from Human Monocytes ... 39
xiv
2.3.18.1 Macrophage Differentiation ... 39
2.3.18.2 M1-M2 Polarization ... 39
Chapter 3 ... 40
Results ... 40
3.1 TLR expression analysis of THP-1, MEG-01 cell lines and healthy PBMCs ... 40
3.2 Efforts to collect platelet and PMP ... 41
3.3 Efforts to generate M0, M1 and M2 macrophages from THP-1 monocytes ... 46
3.4 Platelets and PMPs interact with THP-1 macrophages... 48
3.5 Effects of free and ligand loaded PMPs on THP-1 macrophages ... 51
3.6 Effects of free and ligand loaded PMPs on healthy PBMCs ... 53
3.7 Effects of free and ligand loaded PMPs on healthy PBMC derived monocytes ... 54 Chapter 4 ... 57 Discussion ... 57 References ... 61 APPENDIX ... 70 Copyright Permissions ... 76
xv
List of figures
Figure 1.1: Cellular localization, PAMPs, adaptor molecules and signaling pathways
of TLRs. ... 3
Figure 1.2: Mechanism of CpG ODNs to facilitate immune responses ... 5
Figure 1.3: Mechanisms of macrophage polarization ... 8
Figure 1.4: Functions of platelets... 11
Figure 1.5: Different type of extracellular vesicles ... 12
Figure 1.6: Mechanism of PMP generation from platelets ... 14
Figure 3.1: TLR expression panel of THP-1, MEG-01 cell lines and healthy PBMC..41
Figure 3.2: Flow cytometry analysis of platelet and PMP isolation from whole blood of healthy individuals and MEG-01 cell culture supernatant. ... 42
Figure 3.3: Induction of platelet secretion from MEG-01 cells. ... 43
Figure 3.4: Induction of megakaryocyte differentiation from MEG-01. ... 44
Figure 3.5: Analysis of platelets isolated from whole blood. ... 45
Figure 3.6: Macrophage differentiation and M1-M2 polarization of THP-1... 47
Figure 3.7: PMA-activated THP1 macrophages were polarized into M1-M2 macrophages. ... 48
xvi
Figure 3.9: PMA-activated THP1 macrophages internalize PMPs. ... 50
Figure 3.10: PMPs co-localize into late endosome. ... 51
Figure 3.11: PMPs and TLR agonists induce IL6 and IL12 cytokine response. ... 53
Figure 3.12: PMPs and TLR agonists induce cytokine responses from PBMCs... 54
Figure 3.13: Characterization of PBMC isolated monocytes and differentiated macrophages. ... 55
Figure 3.14: PMPs and TLR agonists induce cytokine responses from monocytes. 56 Appendix Figure 1: PMPs and TLR agonists induce cytokine responses from PBMCs. ... 71
Appendix Figure 2: PMPs and TLR agonists induce cytokine responses from PBMCs. ... 72
Appendix Figure 3: PMPs and TLR agonists induce cytokine responses from PBMCs. ... 73
Appendix Figure 4: PMPs and TLR agonists induce cytokine responses from monocytes. ... 74
Appendix Figure 5: PMPs and TLR agonists induce cytokine responses from monocytes. ... 75
xvii
List of tables
Table 2.1: List of CpG ODNs. ... 17
Table 2.2: List of PRR ligands. ... 18
Table 2.3: List of inhibitors used for internalization experiments. ... 18
Table 2.4: List of flow cytometry antibodies. ... 20
Table 2.5: List of human primers used for PCR and qPCR. ... 22
Table 2.6: List of human ELISA reagents. ... 23
Table 2.7: Sample PCR reaction. ... 35
Table 2.8: PCR reaction conditions. ... 35
Table 2.9: Sample qPCR reaction. ... 36
xviii
Abbreviations
Ab Antibody
ACD Acid-Citrate-Dextrose buffer
ALR AIM2-like receptors
AP1 Activator protein 1
APC Antigen presenting cells
BCA Bicinchoninic acid assay
bp Base pair
BSA C-type lectin receptors
CCL Chemokine (C-C motif) ligand
CD Cluster of differentiation
cDNA Complementary DNA
CFSE Carboxyfluorescein succinimidyl ester
CLR C-type lectin receptors
CMAF Transcription factor Maf
CpG ODN CpG Oligodeoxynucleotide
CREB CAMP responsive element binding protein
xix
CXCL C-X-C motif chemokine ligand
DAMP Damage-associated molecular patterns
DC Dendritic cells
ddH2O Double distilled water
DMEM Dulbecco's Modified Eagle Medium
DMS Demarcation membrane system
DMSO Dimethyl sulfoxide
DNA Deoxyribonucleic acid
dsRNA Double stranded ribonucleic acid
EDTA Ethylenediaminetetraacetic acid
ELISA Enzyme-Linked ImmunoSorbent Assay
EtOH Ethanol
EV Extracellular vesicle
FBS Fetal bovine serum
FSC Forward scatter
GM-CSF Granulocyte-macrophage colony-stimulating factor
HIF-1 Hypoxia-inducible factor 1
HLA Human leukocyte antigen
IFN Interferon
Ig Immunoglobin
xx
IL Interleukin
IP10 Interferon gamma-induced protein 10
IRAK Interleukin 1 receptor associated kinase
IRF Interferon regulatory factor
JNK c-Jun N-terminal kinases
LPS Lipopolysaccharide
M1 M1-type macrophage
M2 M2-type macrophage
MACS Magnetic-activated cell sorting
M-CSF Macrophage colony-stimulating factor
MDSC Myeloid-derived suppressor cells
MEG-01 Human bone marrow megakaryoblast cell line
MHC Major histocompatibility complex
MKK Mitogen activator kinase
MP Microparticle
MyD88 Myeloid differentiation primary response 88
NEAA Non-essential amino acid
NET Neutrophil extracellular traps
NF-κB Nuclear factor Kappa B
NK Natural killer cell
xxi
NLR Nucleotide-binding oligomerization domain (Nod)-like receptors
PAMP Pathogen-associated molecular patterns
PBMC Peripheral blood mononuclear cells
PBS Phosphate buffered saline
PCR Polymerase chain reaction
Pen-Strep Penicillin and streptomycin
PKC Protein kinase C
PMA Phorbol 12-myristate
PMP Platelet-microparticles
PNPP p-Nitrophenyl Phosphate
Poly (I:C) Polyinosinic-polycytidylic acid
PPAR Peroxisome proliferator-activated receptors
PRP Platelet rich plasma
PRR Pattern recognition receptors
PS Phosphotidylserine
qPCR Quantitative PCR
RIP1 Receptor interacting Serine/Threonine kinase 1
rRNA Ribosomal ribonucleic acid
RT Room temperature
xxii
SSC Side scatter
STAT Signal transducer and activator of transcription
TAE Tris-Acetate-EDTA
TBK TANK binding kinase 1
TCR T-cell receptors
Th T helper
THP1 Human peripheral blood monocyte cell line
TIR Toll-interleukin-1 receptor
TIRAP Toll-interleukin 1 receptor (TIR) domain containing adaptor protein
TLR Toll-like receptors
TNFa Tumor necrosis factor
TPO Thrombopoietin
TRAM Translocation associated membrane protein
TRAP-6 Thrombin receptor activator for peptide 6
Treg T regulatory cell
TRIF TIR-domain-containing adapter-inducing interferon-β
1
Chapter 1
Introduction
1.1 The immune system
The immune system defends us against infections throughout our life with an interactive network of cells and molecules. These network recognizes, repels and eradicates pathogens (bacteria, viruses, fungi, and parasites) and wide variety of foreign molecules. The immune system is classified into two subsystems as adaptive and innate immunity. They differ from each other in terms of the speed and specificity of the reaction [1-2].
The innate immune system is the first line of host defense if pathogen passes the physical barriers of the body. It gives immediate but unspecific response with cellular, biochemical and physical defense mechanisms. The diverse cellular component of innate immune system includes granulocytes (basophils, eosinophils and neutrophils), mast cells, monocytes/macrophages, dendritic cells (DCs), γδ T cells and natural killer cells (NK cells) [3-5]. Innate immune response is triggered when pathogen-associated molecular patterns (PAMPs) are identified via pattern recognition receptors (PRR). Upon detection of PAMPs, inflammatory response is initiated, pathogen is killed with phagocytosis. Pro-inflammatory mediators are released and innate and adaptive immune cells are activated. Then the danger is resolved and homeostasis is restored [6].
2
The adaptive immune system is the second line of host defense. It gives antigen specific responses through B and T lymphocytes and cytokines and antibodies secreted from them. While T cells are providing cell-mediated immunity and recognize antigen specifically with T-cell receptors (TCRs) on them, B cells provide humoral immunity with secreted antibodies (Igs) and again recognize antigen specifically. Unlike innate immunity, adaptive immune response takes several days or weeks. Also, it has memory and this leads to rapid response in second exposure [6-7]. The adaptive immune response is awakened by innate immune system upon detection of pathogens. Antigen presenting cells (APCs) mostly DCs act as the link between them. It phagocytes, processes them by cutting them into small peptides and presents antigen to the lymphocytes on major histocompatibility complex (MHC) protein and provide required co-stimulatory signals [6, 8-9].
1.2 Pattern Recognition Receptors
Pattern recognition receptors (PRRs) used by the innate immune system are germ-line encoded receptors that are specialized to recognize PAMPs or DAMPs and discriminate between self and non-self. They are expressed on the cell surface, in intracellular compartments like endosome, lysosome and cytoplasm or secreted into the circulation or tissue fluids. They opsonize, activate complement and coagulation cascade, phagocyte, activate pro-inflammatory signaling pathways and induce apoptosis [4]. Overall, they clear pathogens and restore homeostasis. Also, they can activate both innate and adaptive immunity [10]. PRRs are divided into several families; Toll-like receptors (TLR), AIM2-like receptors (ALR), RIG-I like receptors, nucleotide-binding oligomerization domain (Nod)-like receptors (NLR), C-type lectin receptors (CLR) and cytosolic DNA sensors. TLRs are the first and best characterized PRR family [11-13].
1.2.1 Toll-like Receptors
TLRs are named because they are similar to Toll and discovered in the fruit fly
Drosophila melanogaster. They are type 1 transmembrane receptors with PAMP
interacting leucine-rich ectodomain folded into β-sheets, transmembrane domain and cytoplasmic Toll-interleukin-1 receptor (TIR) domain which signals through adaptive molecules like MyD88 (Myeloid differentiation primary response 88) , TIRAP
(Toll-3
Interleukin 1 receptor (TIR) domain containing adaptor protein), TRIF (TIR-domain-containing adapter-inducing interferon-β) and TRAM (Translocation associated membrane protein). They all induce different immune response. They recognize PAMPs including lipids, lipoproteins, proteins and nucleic acids derived from bacteria, virus, fungi or parasites.13 mammalian TLRs have been identified. While humans have TLR1-10, mice have TLR1-13 except TLR10 [10-12, 14-16]
Figure 1.1: Cellular localization, PAMPs, adaptor molecules and signaling pathways of TLRs [20].
TLR1-2 and TLR2-6 form heterodimers and found in cell surface. Also, TLR5, TLR11 and TLR4 are found in the cell surface and recognize their respective ligands there. TLR7-8 heterodimer, TLR3, TLR9 and TLR13 are found and sense PAMPs in endosome. TLR4 which recognizes LPS is found both on cell surface and in
4
endosome. Following ligand recognition by leucine rich domain, TIR domain signals to adaptor proteins. MyD88 is used by all TLRs except TLR3 and leads to activation of NF-κB (Nuclear factor kappa B) and MAP (Mitogen activated protein) kinase and induces secretion of inflammatory cytokines. TLR3 and 4 use TRIF to activate another pathway which activates NF-κB and IRF3 (Interferon regulatory factor) and induces type I IFN (Interferon) and inflammatory cytokine productions. TLR4 recruits all four adaptors and activate both MyD88 and TRIF dependent pathways. [18-20]
1.3 Immunmodulatory synthetic DNA motif
DNA has complex effects on the immune system. TLR9 recognizes both immune stimulatory or suppressive synthetic DNA motifs which are promising agents for vaccine development and treatment of inflammatory conditions.
1.3.1 Immune stimulatory synthetic DNA motifs
Bacterial DNA contains immune stimulatory unmethylated CpG motifs which are rare in eukaryotic DNA. During infection, these CpG motifs are recognized by TLR9 and immune cascade is initiated. Triggered immune cells proliferate, mature and secrete wide variety of cytokines, chemokines and antibodies. This immune stimulatory activity of CpG motifs in bacteria is mimicked by synthetic CpG oligodeoxynucleotides (ODNs) [21-23]. These ODNs have unmethylated CpG dinucleotide flanked by two 5’ purines and two 3’ pyrimidines. They induce IL12 and type II interferon which promote Th1 dependent cytotoxic T cell response and IL6 which promotes B cell activation and antibody secretion. CpG motifs can boost antigen specific immune responses when co-administered with vaccines. Also they show promising results as anti-allergens, anticancer and immune-protective agents [24]. There are two mostly studied classes of CpG ODNs [25-28].
K-type ODNs encode multiple CpG motifs on a phosphorothioate backbone. They have longer in vivo half-life due to the backbone. They trigger plasmacytoid DCs to differentiate and produce TNFα, and B cells to proliferate and secrete IgM. Also, they induce monocytes to proliferate and secrete IL6 [25-28].
5
D-type ODNs encodes a mixed phosphodiester/phosphorothioate backbone containing a single CpG motif flanked by palindromic sequences and have poly G tails at the 3’ and 5’ ends. They trigger plasmacytoid DCs to mature and secrete IFN-α. They don’t have any effect on B cells unlike K-type ODNs. They induce monocytes to differentiate into mature DCs. While K-type ODNs are fatly transported to the late endosome from early endosome, B-type ODNs stay longer in early endosome [25-28].
Figure 1.2: Mechanism of CpG ODNs to facilitate immune responses [28].
1.3.2 Immune suppressive synthetic DNA motifs
CpG induced immune activation can be damaging to tissues, enable to the development of autoimmune disease and increase sensitivity to immune shock if not appropriately regulated. Telomeres at the ends of the mammalian chromosomes have TTAGGG motifs which was shown to act as immune suppressant. Synthetic ODN
6
containing TTAGGG multimers inhibit activation and differentiation of macrophages, DCs, B cells and T cells and production of pro-inflammatory cytokines [29-31]. A151 is the best studied suppressive ODN. It has four TTAGGG motifs. It has been used for the treatment of autoimmune and infectious diseases, toxic shock, organ specific inflammation and others [32].
1.4 Monocytes & macrophages
1.4.1 Monocytes
Monocytes are originated from myeloid precursor in the bone marrow and fetal liver. They are released into the blood circulation to help tissue homeostasis and immunity. They are key players during inflammation and pathogen challenge. Their development completely depends on colony stimulating factor 1 (CSF1) which are secreted from stromal cells within the blood and tissues. Their half-life in the circulation is very short so they continuously migrate into tissues and form macrophages and DCs. [3, 33-34]
There are different subpopulations of circulatory monocytes. Human monocytes can be divided into classical (CD14++ CD16+), intermediate (CD14++ CD16+) and nonclassical (CD14+ CD16++) subsets [3, 35-36].
1.4.2 Macrophages
Macrophages which have roles in every process in organism’s biology including development, homeostasis, tissue repair and immune response, are derived from monocytes. They take different names depending on their tissue localization like osteoclasts in bone, alveolar macrophages in lung, Kupffer cells in liver, Langerhans cells in skin, microglia in brain. They are the most plastic cells of the hematopoietic system and can adapt to the environmental signals very fast. Their differentiation from monocytes depends on growth factors GM-CSF (Granulocyte-macrophage colony-stimulating factor) or M-CSF (Macrophage colony-stimulating factor) initially. Then they are polarized to different macrophage subsets by priming with IFNγ or IL4 and IL13. Macrophages are classified according to their functions as M1 classically activated macrophages which are primed with IFNγ and M2 alternatively activated macrophages which are primed with IL4 and IL13 [37]. Although it is a
7
limited definition for complexity of macrophages, it is parallel to the T helper cell polarization as Th1 and Th2. Also, recently it has been shown that these M1-M2 macrophages are highly dynamic and can switch to each other upon received signal. This new phenotype is called as M3 switch phenotype [38].
THP1 human monocytic cell line can be used for macrophage differentiation studies. It differentiates into macrophages with PMA treatment. During this process, monocytes in suspension, adhere to the culture plates, stop proliferating and enhance their phagocytic potential. Also, they start producing pro-inflammatory signals [39-41].
1.4.2.1 M1 immune stimulatory macrophages
Macrophages polarize into classically activated M1 macrophages when they encounter a pathogen and sense it through PRRs. They generate inflammatory response. GM-CSF or IFNγ and LPS co-stimulation induces polarization of M1 macrophages. Upon activation of the TLR or other receptors’ signaling pathway, STAT1 and NF-kB transcription factors are activated and pro-inflammatory mediators are produced. They secrete IL12 and IL23 highly but show low IL10 secretion. They efficiently produce reactive oxygen and nitrogen intermediates. It induces Th1 response by releasing pro-inflammatory molecules like IL1β, IL6, IL12, IFNγ and TNFα and co-stimulatory molecules CD86 and MHCII in order to present antigen to T cells [42-49].
In the presence of an infection or injury, monocytes are recruited to the site and differentiate into M1 macrophages in order to clear invading organisms. If these M1 macrophages cannot be stopped after elimination, they can cause worsening of the inflammatory condition or induce auto inflammatory disease such as inflammatory bowel disease, multiple sclerosis, rheumatoid arthritis and type I diabetes mellitus. Also, continuous autoimmune disease can induce spontaneous cancers due to highly produced reactive oxygen intermediates [42-46].
1.4.2.2 M2 immune suppressive macrophages
Alternatively activated M2 macrophages are immune-modulatory and mediate Th2 type immune response. IL4 and IL13 produced from various innate immune cells
8
including mast cells, basophils, esosinophils, NKT cells and macrophages are the inducers of M2 polarization. Activation of STAT3 and STAT6 predominates M2 polarization. M2 macrophages secrete low IL12 and IL23 and high IL10 [42-46]. Since macrophage polarization studies are still under investigation and due to high plasticity, cell surface markers are controversial. Macrophage mannose receptor CD206 are the mostly used cell surface markers for M2 macrophages [50-51]. CD163 is a M2 marker when it is found in combination with CMAF transcription factor [47]. Comparing to M1 macrophages, M2 macrophages have higher phagocytic activity and this has been shown with nanoparticles [52].
9
Peroxisome proliferator-activator receptor γ (PPARγ) and PPARδ is a ligand activated nuclear receptor and it is highly expressed in macrophages and platelets. Upon activation, it mediates macrophage polarization towards M2 [53-59]. Also, M2 inducers IL4 and IL13 activates PPARγ by producing its ligands like 13-(S)-hydroxyoctadecadienoic acid and 15-hydroxyeicosatetraenoic acid [54]. Moreover, PPARγ inhibits the production of inflammatory cytokines [55].
In case of cancer, macrophages contribute to the tumor initiation, progression and metastasis. However, after tumor is established, macrophages turn into tumor associated macrophages which are one of the subtypes of M2 immune suppressive macrophages. They contribute to the angiogenesis, invasion of local environment and metastasis to other parts of the body [41-45].
1.5 Megakaryocytes & platelets
1.5.1 Megakaryocytes
Megakaryocytes develop from hematopoietic stem cells that reside in the bone marrow. Commitment to megakaryocyte lineage is indicated by the expression of CD61 (integrin β3, GPIIIa) and CD41 (integrin αIIb, GPIIb). During megakaryopoiesis, cytokines like GM-CSF, IL3, IL6, IL11, IL12, thrombopoietin (TPO), transcription factors like GATA-1, RUNX1 and others play crucial roles. Megakaryocytes are very large cells with 50-100 um diameter. Also, they make endomitosis and amplify their DNA up to 128N because they have to express platelet proteins before platelet secretion. For all these functions, they increase their volume. [60-61].
1.5.2 Platelets
Platelets are the small, anucleated, 2-3 μm, discoid cells found in the blood circulation. They are secreted from megakaryocytes and found around 150,000-400,000 per μl of blood in a healthy adult. TPO is the primary cytokine which regulates the platelet release from megakaryocytes. Since their life span is short and about a week, they are constitutively produced by megakaryocytes in different sites including bone marrow, blood and lung. Although platelets are lack of nucleus, they are secreted with mRNAs and translational machinery which enable them to produce
10
their own protein. There are around 20 million proteins per platelet. Upon activation, smooth surface of platelets become spiny due to calcium influx. Storage granules including alpha-granules, dense granules and lysosomes secrete different molecules like cytokines, chemokines, coagulation factors which will mediate platelet function [62].
Thousands of platelets are released from megakaryocytes and there are several proposed mechanisms about their production. The first model suggests that platelets released by budding from the megakaryocyte membrane. Second model suggests that demarcation membrane system (DMS) leads to cytoplasmic fragmentation of megakaryocytes. These subdivided cytoplasm is enveloped by its own membrane and forms platelets. The third model suggests that platelets are released from formed proplatelets which are long and thin cytoplasmic processes emanating from megakaryocytes [63-65].
11 Figure 1.4: Functions of platelets [66].
Platelets have a role in various processes including hemostasis, wound repair, blood clotting and immune surveillance. They interact with different cells to function. For blood clotting in case of an injury, they sense and activated platelets accumulate at the site. With the glycoproteins on their surface they mediate fibrin clot formation [62]. In case of an infection, they again accumulate to the site and engage with pathogens with their PRRs and orchestrate immune cells. Platelets express TLR2, TLR3, TLR4, TLR7 and TLR9 [67-69]. They release host-defense peptides to call for immune cells including neutrophils, APCs, T and B cells to reestablish homeostasis. Platelets induce neutrophils for NET production. Also, it helps antigen processing by
12
APCs and with the help of CD40 or its ligand, it coordinates the T cell polarization and then the B cell activation for antibody production [68-69].
Human megakaryoblastic leukemia cell line MEG-01 when induced with PMA activating PKC (protein kinase C) or other agents can make megakaryopoiesis and show polyploidy, proplatelet formation and elevated expression of CD41, CD61. Also, they show reduced cell proliferation and enhanced cell adherence. Resulting megakaryocytes can secrete platelet-like particles [70-73].
1.6 Extracellular vesicles
Almost all cells release extracellular vesicles (EVs) upon activation. EVs are found in all human body fluids such as saliva, blood, urine and breast milk. Depending on their cellular origin, EVs express cell specific markers like CD14 in monocyte and CD41, CD42, CD61 in platelet EVs. They mediate intercellular communications [74-75].
Figure 1.5: Different type of extracellular vesicles [76].
EVs are divided into three groups as exosomes, microparticles and apoptotic blebs. Microparticles are generated from cell membrane by budding and they are around 100-2000 nm in diameter. The release of MPs is triggered by the increased calcium ions in cells. Scramblase induces loss of cell membrane asymmetry and as a result phosphotidylserine (PS) on membrane is exposed with budding of microparticles. Exosomes are released by the fusion of multivesicular body containing exosomes with the cell membrane. Exosomes are the smallest EVs. While MPs can fully reflect the membrane composition of cellular origin, exosomes cannot. They both carry
13
nucleic acids, lipids and proteins as a cargo. Apoptotic bodies are formed from apoptotic cells by outward blebbing of membrane. They are bigger than MPs and they carry nuclear fractions and cell organelles [77-78].
EVs function in various processes mainly intercellular communication. Also, they play role in angiogenesis, coagulation, waste management, survival, inflammation and immune responses. Tumor-derived exosomes contribute to the survival of cancer cells by releasing the toxic drugs or by controlling the immune response. They inhibit DC production by monocytes, NK and T cell activities. Also, they induce Treg and MDSC development. But they could also transfer tumor antigen to DCs and activate T cells. EVs secreted from pathogen infected macrophages stimulate other immune cells to the site of infection by carrying pro-inflammatory message, while EVs secreted from tumor activated macrophages carry immune suppressive message and prevent immune activation [80-82].
1.6.1 Platelet-derived microparticles
Platelet microparticles (PMPs) are released from activated platelets and like their progenitor platelets, they function in homeostasis and immunity. They constitute almost 90-95% of circulating microparticles. They express surface glycoproteins CD41, CD42 and CD61 which are also megakaryocyte lineage markers [83-84].
During their circulation in the blood interacts with many blood cells including leukocytes, lymphocytes and endothelial cells. Fusion of PMP to the target cell results in transfer of PMPs internal composition. PMPs are shown to have PPARγ (Peroxisome proliferator-activated receptors) and deliver it to the monocytes. Monocytes that received PPARγ differentiated into macrophages and showed less inflammatory cytokine production. However, for such transcription factors to fully function, signal or ligand may be required. Also, the delivered cargo of PMPs could be short lived and if the effect is not permanent, it may not be recognized [85-86]. Platelet-membrane functionalized particles which are like PMPs are shown to be very effective in drug delivery to the circulating tumor cells. Since these are usually metastatic tumor cells, they are very important in prevention of metastasis [87]. Also, PMPs deliver growth factors which would further induce tumor growth or enable
14
tissue regeneration. Platelet MPs promote angiogenesis meaning new blood vessel formation and help tumor growth [88-91].
Figure 1.6: Mechanism of PMP generation from platelets [88].
1.7 Aim of the study
Macrophages are the key modulator and effector cells and their activation influences multiple subset of immune cells shaping their response. Changes in their polarization status are associated with many pathophysiological conditions. Therefore, understanding how to regulate M1/M2 type macrophage polarization would be beneficial either to control tumor development (M1) or to alleviate symptoms of auto-immune/auto-inflammatory diseases (M2).
In this thesis, we tried to exploit highly phagocytic nature of macrophages through the highest microparticle secreting cells, platelets. Since almost 95% of microparticles in circulation are derived from platelets and most of these microparticles are phagocytosed by macrophages, we postulated that PMP ingestion could alter the fate of the macrophages and facilitate their polarization tendencies either towards M1 or M20like phenotype. Therefore, we aimed to regulate macrophage polarization by using different TLR agonists in platelet-derived microparticles. Initially, we showed the interaction kinetics and intracellular localization of PMPs in macrophages. Then
15
with functional studies, we aimed to show immune suppressive activity of PMPs on macrophage polarization. Our results demonstrated that standalone PMPs are insufficient to induce M2 polarization by them. However, when TLR ligands were included within PMPs we found that macrophage polarization could be modulated With the screening of several TLR agonists on PBMCs and monocytes from different healthy donors, this work established that M1-like phenotype was generated following TLR9 ligand loaded PMP treatment and M2-like phenotype was obtained following TLR7 agonist loaded PMP treatment.
16
Chapter 2
Materials and Methods
2.1 Materials
2.1.1 General Laboratory & Cell Culture Reagents and Materials
Ultracentrifuge rotor tubes highly used for EV isolation, Zap-OGLOBIN® II Lytic reagent and Z-PAK Isoton II diluent used for cell counting were purchased from Beckman Coulter, USA. 10 mL BD Vacutainer® EDTA blood collection tubes used for blood collection were purchased from BD, USA. Human CD14 microbeads and other MACS equipment were purchased from Milteny Biotech, Germany. Media used in cell culture DMEM and RPMI1640, together with FBS, PBS, 2-mercaptoethanol and L-glutamine were purchased from Gibco, USA. Other supplemental reagents Hepes, Na Pyruvate, NEAA, Pen-Strep and Trypsin were purchased from Lonza, Switzerland. Trypan blue used for cell counting and Hypure Molecular Biology Grade Water were purchased from Hyclone. All plastic materials used in cell culture like flasks, microplates, scrapers, serological pipets, filters were purchased either from Costar Corporation, UK or Corning Life Sciences Inc., USA. Mr. Frosty freezing container was purchased from Thermo Scientific, USA and 2 ml screw cap cryo vials and tissue culture dishes were purchased from Greiner bio-one, Austria.
17
2.1.2 Recombinants and Other Agents
Recombinant human IL-4, IL-13 and IFN-γ were purchased from Biolegend, USA. Recombinant human GM-CSF and M-CSF for primary monocyte culture were purchased from Endogen, USA and Tonbo, USA. PMA and Ionomycin were supplied from Sigma, USA. Platelet activator peptide TRAP-6 were purchased from Anaspec, USA.
2.1.3 CpG ODNs
CpG ODNs were supplied from several companies. Their sequence and length information were provided in Table 2.1.
Table 2.1: List of CpG ODNs.
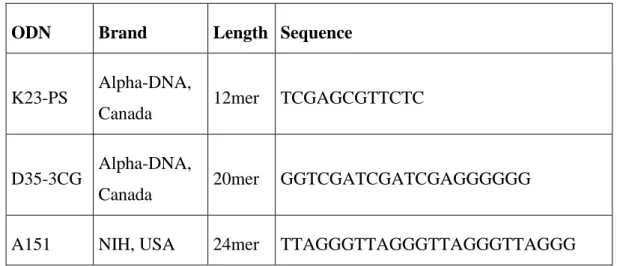
2.1.4 PRR Ligands
Ligands used for cell stimulations were listed in Table 2.2.
Ligand Source Brand
Poly (I:C) (HMW) B. Subtilis Fluka, USA
LPS E. coli Sigma, USA
R848 Synthetic Invivogen, USA
ODN Brand Length Sequence
K23-PS Alpha-DNA,
Canada 12mer TCGAGCGTTCTC
D35-3CG Alpha-DNA,
Canada 20mer GGTCGATCGATCGAGGGGGG
18
Pam3Csk4 Synthetic Invivogen, USA
Table 2.2: List of PRR ligands.
2.1.5 Inhibitors
Inhibitors used for platelet internalization experiments were listed in Table 2.3 together with working concentrations and corresponding incubation time. They were prepared in nuclease free water.
Inhibitor Brand Working concentration
Incubation time
Fucoidan Sigma, USA 40 μg/ml 30 min
Dextran Sulfate Sigma, USA 40 μg/ml 30 min
Chondroitin Sulfate Sigma, USA 40 μg/ml 30 min
Sodium Azide Merck, USA 0.1 M 90 min
Sucrose Sigma, USA 0.45 M 30 min
Table 2.3: List of inhibitors used for internalization experiments.
2.1.6 BCA
BCA and Micro BCA Protein Assay kits were purchased from Pierce, USA and assays were performed on flat bottom 96 well plates purchased from RatioLab, Germany.
2.1.7 Flow Cytometry
Staining antibodies used for flow cytometry analysis were purchased from various companies. They were listed in Table 2.4 together with their brand and catalog number. Brefeldin A used for intracellular cytokine staining were supplied from
19
Sigma, USA. Fix and Perm Medium A and B were purchased from Invitrogen, USA. 3.5 μM 4%w/v Carboxyl latex beads for flow cytometry analysis of EVs were purchased from Life Technologies, USA.
Dye Species Brand Cat #
Anti-Annexin-V-PE Biolegend, USA 640908
Anti-Annexin-V-FITC Biolegend, USA 640906
Anti-CD9-PE Human Biolegend, USA 312106
Anti-CD11b-FITC Human Tonbo, USA 35-0112-U500
Anti-CD14-PE Human Biolegend, USA 325606
Anti-CD63 Purified Human Biolegend, USA 312002
Anti-CD63-PE Human Biolegend, USA 353004
Anti-CD86-PE Human Biolegend, USA 310906
Anti-CD80-FITC Human Biolegend, USA 305206
Anti-CD81 Purified Human Biolegend, USA 349502
Anti-CD86-Alexa488 Human Biolegend, USA 305414
Anti-HLA-DQ-FITC Human Biolegend, USA 318104
Anti-HLA-DQ-PE Human Biolegend, USA 318106
Anti-IL-12/IL-23 p40-FITC Human Biolegend, USA 501804
Anti-CD206-PerCP/Cy5.5 Human Biolegend, USA 321122
Anti-IL-10-PE Human Biolegend, USA 506804
20
CFSE Biolegend, USA 79898
Propidium Iodide Sigma, USA P4170
Table 2.4: List of flow cytometry antibodies.
2.1.8 Confocal Microscopy
Transferrin TexasRed and Lysotracker gree DND26 used to stain early and late endosomes were purchased from Molecular Probes, USA and SP-DiOC were purchased from Invitrogen, USA.
2.1.9 Determination of Gene Expression
RNA isolation was performed with Trizol reagent purchased from Life Technologies, USA. ProtoScript M-MulV cDNA Synthesis Kit and OneTaq Quick-Load 2x Master mix with Standard Buffer were purchased from NEB, USA. For qPCR analysis, 2x DyNAmo HS SYBR Green qPCR mix were purchased from Thermo Scientific, USA. 6x gel loading dye and DNA ladders were purchased from Fermentas, USA.
2.1.9.1 Primers
Primers were designed with Primer3 Input v.0.4.0 program (http://frodo.wi.mit.edu/primer3/input.htm) using the cDNA sequences of human genes available at the EnsemblTM database. Each primer pair was blasted (http://www.ncbi.nlm.nih.gov/BLAST/ or http://genome.ucsc.edu/) against the human genome. Primers used for human TLR profiling and gene expression analysis were listed in Table 2.5.
Gene
Name Direction Sequence
Product size (bp) TLR1 F CATAACTCTGCTGATCGTCACC
491
21 TLR2 F GATGACTCTACCAGATGCCTCC 745 TLR2 R CAGAAGAATGAGAATGGCAGC TLR3 F GCTGTCCACCACCAGCAATA 691 TLR3 R CCTTCGGAGCATCAGTCGTT TLR4 F TTACCTGTGTGACTCTCCATCC 529 TLR4 R CAGAAGAATGAGAATGGCAGC TLR5 F CCTTGACTATTGACAAGGAGGC 718 TLR5 R TTGTAGGCAAGGTTCAGAACC TLR6 F TCTCATGACGAAGGATATGCC 578 TLR6 R CGATCAGCAGAGTTATGTTGC TLR7 F ACGAACACCACGAACCTCAC 725 TLR7 R GGCACATGCTGAAGAGAGTTAC TLR8 F GGGAACATCAGCAAGACCCA 94 TLR8 R GGCTGCAGGAGCTATTTTGC TLR9 F CAACAACCTCACTGTGGTGC 514 TLR9 R GAGTGAGCGGAAGAAGATGC TLR10 F GAACTGATGACCAACTGCTCC 557 TLR10 R GAAGTCTTGATTCCATCACGC CXCL11 F AAGCAGTGAAAGTGGCAGAT 141 CXCL11 R TAAGCCTTGCTTGCTTCGAT CCL18 F GCTGCCTCGTCTATACCTCC 113
22
CCL18 R CCGGCCTCTCTTGGTTAGGA
β-actin F CGACAACGGCTCCGGCATGT
105
β-actin R ACCATCACGCCCTGGTGCCT
Table 2.5: List of human primers used for PCR and qPCR.
2.1.10 Reagents for ELISA
2HB ELISA plates used for ELISA were purchased from SPL Life Sciences, Korea. SA-ALP was purchased from MabTech, Sweden and PNPP Tablets and 5X Diethanolamine Buffer were purchased from Thermo Scientific, USA. Monoclonal antibodies, biotinylated antibodies and recombinant proteins were purchased from variety of companies. Information showing the company name, catalog number and working conditions were listed in Table 2.6.
Antibody Name Brand Cat # Working concentration
Anti-Pan IFN-α Ab MabTech, Sweden
3425-1a-20 5 μg/ml in PBS Pan IFN-α Biotinylated
Ab MabTech, Sweden 3425-1a-20 1:1000 diluted in T cell buffer
Recombinant Pan IFN-α MabTech, Sweden
3425-1A-20 20 ng/ml in Blocker
Anti- IL-10 Ab Endogen,
USA M011 4 μg/ml in PBS
IL-10 Biotinylated hAb Endogen,
USA M011B
1:1000 diluted in T cell buffer
Recombinant IL-10 Biolegend,
23
Anti- IP-10 Ab BD, USA 555046 2 μg/ml in PBS
IP-10 Biotinylated Ab BD, USA 555048 1:1000 diluted in T cell buffer
Recombinant IP-10 BD, USA 551130 100 ng/ml in Blocker
Anti- IL-6 Ab Biolegend,
USA 501102 2 μg/ml in PBS
IL-6 Biotinylated Ab Biolegend,
USA 501202
1:1000 diluted in T cell buffer
Recombinant IL-6 Biolegend,
USA 570802 60 ng/ml in Blocker
Anti- IL-12 Ab Biolegend,
USA 511002 5 μg/ml in PBS
IL-12 Biotinylated Ab Biolegend,
USA 508802
1:1000 diluted in T cell buffer
Recombinant IL-12 Biolegend,
USA 573002 250 ng/ml in Blocker
Anti-IFN-γ Ab Biolegend,
USA 507502 4 μg/ml in PBS
IFN-γ Biotinylated Ab Biolegend,
USA 502504
1:1000 diluted in T cell buffer
Recombinant IFN-γ Biolegend,
USA 570202 500 ng/ml in Blocker
24
2.2 Solutions, Buffers and Culture Media
2.2.1 Cell Culture Media
High Glucose DMEM and RPMI-1640 (Lonza)
2,.5 or 10% FBS inactivated at 55 °C 50 g/ml Penicillin/Streptomycin 10 mM HEPES
0,.11 mg/ml Na Pyruvate
1% Non-Essential Amino Acids Solution 2 mM L-Glutamine
All ingredient were added into 500 ml medium and stored at +4 °C.
2.2.2 Platelet Isolation Buffers
ACD Buffer (Acid-Citrate-Dextrose)
39 mM Citric acid 75 mM Sodium citrate 135 mM Dextrose
The pH of the solution was adjusted to 7.4 and stored at +4 °C. Before using, solution was warmed up to RT.
Platelet Wash Buffer
10 mM Sodium citrate 150 mM NaCl
1 mM EDTA 1% (w/v) Dextrose
The pH of the solution was adjusted to 7.4 and stored at +4 °C. Before using, solution was warmed up to RT.
25 Tyrode’s Buffer 134 mM NaCl 12 mM NaHCO3 2.9 mM KCl 0.34 mM Na2HPO4 1 mM MgCl2 10 mM HEPES
The pH of the solution was adjusted to 7.4 and stored at +4 °C. Before using, solution was warmed up to RT.
2X Platelet Lysis Buffer
2% NP40 30 mM HEPES 150 mM NaCl 2 mM EDTA
The pH of the solution was adjusted to 7.4 and stored at +4 °C.
2.2.3 Flow Cytometry Buffers PBS-BSA-Na azide Buffer
500 ml 1x PBS 5g BSA (1%)
125 mg Sodium Azide (0.25%)
Solution was stirred until fully homogenized and stored at +4 °C.
10X Annexin-V Binding Buffer
0.1 M HEPES 1.4 M NaCl 25 mM CaCl
26
Ingredients were dissolved in ddH2O, pH was adjusted to 7.4 and stored at +4 °C.
Before use, solution was diluted to 1x with ddH2O.
2.2.4 Agarose Gel Electrophoresis 50X TAE (Tris-Acetate-EDTA)
242 g Tris (C4H11NO3)
37.2 g Tritiplex 3 (EDTA= C10H14N2Na2O2 . 2H2O)
57.1 ml Glacial acetic acid
Ingredients were dissolved in 1 lt ddH2O, autoclaved and stored at RT. Before use,
solution was diluted to 1x with ddH2O.
2.2.5 ELISA Buffers Blocking Buffer
500 ml 1x PBS 25 g BSA (5%)
250 μl Tween20 (0,025%)
Mixture was stirred until fully homogenized and stored in -20 °C.
T-cell Buffer
500 ml 1x PBS 25 ml FBS (5%)
250 μl Tween20 (0,025%)
Mixture was stirred until fully homogenized and stored in -20 °C.
Wash Buffer
500 ml 10x PBS 2.5 ml Tween20 4.5 lt ddH2O
27
10X PBS (Phosphate Buffered Saline)
80 g NaCl 2 g KCl
8,01 g Na2HPO4 . 2H2O
2 g KH2PO4
1 lt ddH2O
pH of the solution was adjusted to 6.8 and autoclaved. It was stored at RT.
2.3 Methods
2.3.1 Maintenance of Cell Lines 2.3.1.1 MEG-01
MEG-01 (ATCC®, CRL-2021) is a human bone marrow megakaryoblast cell line. Cells were sustained in a RPMI1640 media with 10% regular FBS. Cells cultured for EV isolation were maintained in media with ultra-centrifuged FBS. These half adherent half suspension cells were subcultured when they reach 90% confluence with fresh media following scraping. Cells collected at 300 g with 5 min centrifugation were seeded on appropriate concentration back to new flasks.
2.3.1.2 THP-1
THP-1 (ATCC®, TIB-202) is a human peripheral blood monocyte cell line. Subcultures of this suspension cells were maintained with addition of RMI1640 media with 10% regular FBS or with replacement of media after centrifugation at 150 g for 5 min. Subculturing was done every 2-3 days and cell concentration was kept between 3 x 10⁵- 9 x 10⁵ viable cells/ml.
2.3.2 Cryopreservation and Thawing of Cells
Cryotubes taken from liquid nitrogen were immediately put in water bath, which was pre-heated to 37 °C. After the ice in the vials melted, cells were transferred into a 15 ml falcon tube having 9 ml of the preferred media. Then, the falcon was centrifuged at 300 g for 5 min. Supernatant containing DMSO was aspirated and the cell pellet
28
was resuspended with fresh complete media. Cells were seeded in preferred culture plate and placed into the incubator, which was set for 37 °C with 5% CO2
maintenance.
Cells reached around 60-80% confluency and 80-90% viability could be frozen. Cells were collected with a suitable method and pelleted with centrifugation. Then the cell pellet was resuspended in 10% DMSO in FBS and transferred into cryovials labeled beforehand. Cryovials were placed in Ms. Frosty Freezing Container and placed to -80 °C fridges. 24 h later cells were transferred into liquid nitrogen in order to store them for longer periods of time.
2.3.3 Cell Counting 2.3.3.1 Hemocytometer
After the cell lines and primary cells were washed and pelleted and resuspended in 1-10 ml of fresh media. 1-10 μl from cells were mixed with 1-10 μl Trypan Blue to distinguish live and dead cells. 10 μl from this suspension were loaded on hemocytometer and the number of cells was determined by counting under light microscope. Then the total cell number was calculated with the help of counted cell number and dilution factor.
2.3.3.2 Flow Cytometer
After the suspension cell lines and primary cells were washed and pelleted and resuspended in 1-10 ml of fresh media. Aliquots taken from cell line suspensions were directly counted on flow cytometer. With the help of total count in the live cell gated area and dilution factor, total cell number was determined. For primary cells, 20 μl of cell suspension was mixed with10 ml Isoton II Diluent buffer and 2-3 drops of ZAP-OGLOBIN II Lytic Reagent was added to lyse red blood cells. Following gentle tilting of the vial up and down for 5-6 times, cells were then counted on the flow cytometer. Live cells were gated, apoptotic cells or cell clusters were ignored. Again with the help of total count in the gated area and dilution factor, total cell number was determined.
29
2.3.4 PBMC Isolation
Blood samples were collected into BD vacutainers with EDTA and isolations were done within 30 min. 9 ml whole blood was slowly transferred into a 15 ml falcon having 6 ml histopaque. Samples were centrifuged at 300 g for 30 min with no brake. Plasma layer at the top was removed and the buffy coat at the middle containing PBMCs were transferred to new 50 ml falcon avoiding contamination from other layers. 2% FBS RPMI medium was added till reaching total volume of 50 ml and mixture was centrifuged at 300 g for 10 min. Then, supernatant was discarded without disturbing the pellet. Pellet was washed again, counted in flow cytometer in isotonic solution and adjusted to certain concentration depending on the intended experiments.
2.3.5 Platelet Isolation and Storage
Platelet isolation were done from whole blood samples of healthy donors. Bloods were collected into BD vacutainers with EDTA and isolations were done within 30 min. Whole blood was transferred into a 15 ml falcon having 1/10 volume of ACD buffer. PRP was isolated by centrifugation at 900 g for 5 min with no brake. PRP was transferred into a new 15 ml falcon carefully. Platelets were collected with 15 min centrifugation at 1700 g. Platelet poor plasma were discarded and platelets were washed with 1 ml platelet wash buffer gently without disrupting the pellet. They were counted in flow cytometer and frozen in 5% DMSO in FBS until further use.
Platelet isolation were also done from MEG-01 cell line. Cells grown for 3 days were collected by scraping. Cells were discarded after centrifugation at 300 g for 5 min. Remaining cell debris was discarded at 500 g for 5 min and then platelets were collected at 1900 g for 15 min.
2.3.6 Platelet activation and PMP Isolation
Thawed platelets were collected by centrifugation at 1700 g for 15 min. Platelets were incubated with 50 μM TRAP6 in 500 μl RPMI1640 filtered through 0.2 μm for 30 min at 37 °C. 5 ml RPMI1640 filtered through 0.2 μm filter were added and inactive platelets were collected with centrifugation at 1700 g for 15 min. Supernatant containing PMPs were transferred into ultracentrifuge tubes and volume was adjusted
30
with sterile PBS. PMPs were collected from the bottom after 30.000 g for 45 min and resuspended in 200-400 μl of sterile PBS.
2.3.7 Exosome and MP Isolation
Cells cultured for MP isolation were kept in media with FBS that is ultra-centrifuged overnight at 28,000 g. Supernatant of cells were collected when cells reach ~80% confluency. Cells were pelleted first at 300 g for 5 min, cell-free supernatant was taken. Then to get rid of any cell debris supernatant was centrifuged at 1500 g for 10 min and stored at -80 °C after snap-freezing in liquid nitrogen until the day before isolation. One day before EV isolation, supernatants were put on +4 °C overnight for slow thawing. Isolations were done using either 15 or 30 ml sterile tubes. Supernatants were loaded into tubes and placed inside the ultracentrifuge tubes cleaned with 70% EtOH. The lids were closed and tubes were placed carefully into rotor and then rotor to the ultracentrifuge. In order to discard any remaining contaminants, samples were centrifuged at 10,000 g for 10min. Supernatants were taken into new tubes without touching to the bottom and samples were centrifuged at 30,000 g for 30 min to get MPs. After this step the 2-3 ml at the bottom of the tube was taken for MP and top portion was taken for exosome isolation if desired. MP portion was mixed well and sterile PBS was added for washing the MP pellet. To collect MPs, samples were centrifuged at 30,000 g for 45 min and supernatant was aspirated without touching to the MP pellet at the bottom. MPs were resuspended in 200-500 μl of sterile PBS and snap-frozen in liquid nitrogen and stored at -80 °C for further use.
2.3.8 BCA and Micro BCA Protein Assay
BCA and Micro BCA protein assays were used to assess protein concentration of EVs and other samples. Both assays were done according to the manufacturer’s protocol. Basically, BSA standards were prepared at different concentrations. Working reagents were prepared according to the kit’s manual. Then suggested amount of working reagent plus suggested amount of standards were added on each well of micro-plates. Samples were also added on working reagent at the same of volume of standards. Micro-plates were incubated at 37 °C for 30 min for BCA and 2 h for micro BCA assay. After plates were cooled to RT, the absorbance of samples were
31
measured at 562 nm by spectrophotometer (Synergy HT). The concentration of samples was determined by BSA standard curve.
2.3.9 Cargo Loading to Extracellular Vesicles
MPs and exosomes were mixed with desired amount of TLR ligands in 1.2 ml tubes. If there are more than one sample, all samples’ volumes were equalized by addition of sterile PBS. Immediately after mixing ligands with EVs, the tubes were covered with parafilms and holes were opened on top. Mixture was frozen in liquid nitrogen and placed in freeze-drier for overnight lyophilization. For reconstitution of the powdered samples, sterile water in 1/10 of initial mixture volume was added. Samples were vortexed for ~15 seconds every 2 min for 20 min Then the same of volume of sterile PBS was added and samples were incubated for 10 min at RT. After the incubation, samples were vortexed for ~15 seconds and they were ready for further use in treatments.
2.3.10 Flow Cytometry 2.3.10.1 Fixation of Cells
Cells were collected by 5min centrifugation at 300 g. Supernatant was aspirated and cells were further washed with PBS. 50 μl Fixation Medium A per 1x10⁶ cells were added on pelleted cells while vortexing and cells were incubated at RT for 15 min. 20 volumes of PBS-BSA-Na-Azide buffer was added on cells to wash and fixed cells were centrifuged at 500 g for 5 min. Cells were resuspended in 100 μl PBS-BSA-Na-Azide buffer, directly stained or stored at +4 °C maximum for a week.
2.3.10.2 Surface Marker Staining of Cells
0.1 μg of staining antibodies were added on 1x10⁶ fixed cells in 100 μl
PBS-BSA-Na-Azide buffer. Cells were incubated 30 min at RT and dark. 2 ml PBS-BSA-Na-PBS-BSA-Na-Azide buffer was added to wash and cells were collected at 500 g for 5 min. Then cells were resuspended in PBS and analyzed in flow cytometer.
32
2.3.10.3 Intracellular Cytokine Staining
For detection of intracellular cytokines, cells were treated with Brefeldin-A 6 h before the end of the incubation. After Brefeldin-A treatment, cells were collected with centrifugation at 300 g for 5 min and fixed with Fixation Medium A for 15 min at RT. Fixed cells were washed with PBS-BSA-Na-Azide buffer containing 0.3% saponin and centrifuged at 500 g for 5 min. Cells were resuspended in Permeabilization Medium B for permeabilization and at the same time, 0.1 μg of staining antibodies were added per on 1x10⁶ cells in 100 μl. Staining was done at RT and dark for 30
min. 2ml PBS-BSA-Na-Azide buffer was added to wash and cells were collected in 5 min at 500 g. Then cells were resuspended in PBS and analyzed in flow cytometer.
2.3.10.4 Surface Marker Staining of EVs with Latex Beads
For catching EVs, latex beads were coated with monoclonal antibodies. 5 μl of latex beads were taken from stock, washed with PBS and collected at 12,000 g for 10 min. 5 μg antibody of interest were added on beads and volume was completed to 500 μl with PBS in an eppendorf tube. Samples were incubated overnight on rotator at RT. Then antibody conjugated beads were centrifuged at 12,000 g for 10 min. They were blocked with 5% BSA in PBS again on rotator and RT for 5 h. Beads were collected with centrifugation and resuspended in 50 μl 1% BSA in PBS. They were stored at +4 °C until further use. Before analysis, 1 μl of antibody conjugated beads were mixed with 1 μg of EVs and volume was completed to 500 μl with PBS in an eppendorf tube. Then samples were incubated overnight on rotator at RT and EV captured latex beads were obtained with centrifugation. They were stained with staining antibodies and analyzed in flow cytometer.
2.3.11 SP-DiOC Staining of PMPs
PMPs were stained with SP-DiOC to analyze cellular internalization of the vesicles. PMPs dissolved in sterile PBS were incubated with dye at 1 μM concentration for 30 min at 37 °C. After incubation, vesicles were washed with PBS once in order to remove the unbound dye and collected by ultracentrifugation.
33
2.3.12 Binding & Uptake and Internalization Assays
This assays were done by using SP-DiOC stained microparticles. Stained MPs can either bind to the surface of the cells or be internalized. PMA activated THP-1 macrophages were cells were co-incubated with stained MPs. Cells were collected at different time points and directly counted on flow cytometer to measure binding & uptake. However, to determine the proportion of internalized vesicles, extracellular fluorescence signal was quenched with addition of trypan blue (0.01% final concentration) and then cells were counted again on flow cytometer.
2.3.13 Analysis of PMP Localization with Confocal Microscopy
THP1 cells were seeded on coverslips placed inside 6-well cell culture plates. SP-DiOC stained PMPs were co-incubated with cells for 4 h. After co-incubation, cells were washed twice with PBS and fixed by addition of 150 μl Fixation Medium A. Fixation was done at RT for 15 min. Then cells were washed twice with PBS and for late endosome visualization Transferrin-red dye was added in 200 μl. It was incubated for 30 min at 37 °C. Cells were washed again and visualized under confocal microscope. For visualization of early endosome, lysotracker-red was directly added on washed cells without fixation. It was incubated for 30 min at +4 °C, washed and visualized under confocal microscope. Images taken from confocal microscope were analyzed in ImageJ.
2.3.14 Determination of Gene Expression 2.3.14.1 Total RNA Isolation
Cells were collected and centrifuged at 300 g for 5 min at +4 °C. Supernatants were gently discarded without disrupting the pellet and cells were extensively mixed and lysed with 1 ml TRIzol. Cell lysates were transferred into eppendorf tubes. At this step, samples could be stored at -80 °C. Directly or after thawing, samples were handled at +4 °C all the time. 200 μl chloroform was added into each 1 ml TRIzol containing tubes and shaken vigorously for 15 sec and incubated at RT for 3 min. Samples were centrifuged at 13,200 rpm for 17 min. Subsequently, the clear upper aqueous phase was transferred into a new eppendorf tube and total RNA was precipitated by adding 500 μl of isopropanol, gently inverted up-down for proper
![Figure 1.1: Cellular localization, PAMPs, adaptor molecules and signaling pathways of TLRs [20]](https://thumb-eu.123doks.com/thumbv2/9libnet/5951814.124157/25.892.162.781.311.839/figure-cellular-localization-pamps-adaptor-molecules-signaling-pathways.webp)
![Figure 1.2: Mechanism of CpG ODNs to facilitate immune responses [28].](https://thumb-eu.123doks.com/thumbv2/9libnet/5951814.124157/27.892.171.597.362.819/figure-mechanism-cpg-odns-facilitate-immune-responses.webp)
![Figure 1.5: Different type of extracellular vesicles [76].](https://thumb-eu.123doks.com/thumbv2/9libnet/5951814.124157/34.892.164.782.552.801/figure-different-type-extracellular-vesicles.webp)
![Figure 1.6: Mechanism of PMP generation from platelets [88].](https://thumb-eu.123doks.com/thumbv2/9libnet/5951814.124157/36.892.164.784.186.517/figure-mechanism-pmp-generation-platelets.webp)