NETWORK DESIGN PROBLEMS AND
VALUE OF CONTROL MECHANISMS IN
POWER SYSTEMS
a dissertation submitted to
the graduate school of engineering and science
of bilkent university
in partial fulfillment of the requirements for
the degree of
doctor of philosophy
in
industrial engineering
By
Meltem Peker Sarhan
May, 2019
NETWORK DESIGN PROBLEMS AND VALUE OF CONTROL MECHANISMS IN POWER SYSTEMS
By Meltem Peker Sarhan May, 2019
We certify that we have read this dissertation and that in our opinion it is fully adequate, in scope and in quality, as a dissertation for the degree of Doctor of Philosophy.
Bahar Yeti¸s (Advisor)
Ay¸se Selin Kocaman (Co-Advisor)
Oya Kara¸san
Se¸cil Sava¸saneril T¨ufekci
Nesim Kohen Erkip
Murat G¨ol
Approved for the Graduate School of Engineering and Science:
Ezhan Kara¸san
ABSTRACT
NETWORK DESIGN PROBLEMS AND VALUE OF
CONTROL MECHANISMS IN POWER SYSTEMS
Meltem Peker Sarhan Ph.D. in Industrial Engineering
Advisor: Bahar Yeti¸s Co-Advisor: Ay¸se Selin Kocaman
May, 2019
Power systems planning and operations is one of the most challenging prob-lems in energy field due to its complex, large-scale and nonlinear nature. Operat-ing power systems with uncertainties and disturbances such as failure of system components increases complexity and causes difficulties in sustaining a supply-demand balance in power systems without jeopardizing grid reliability. To handle with the uncertainties and operate power systems without endangering grid re-liability, utilities and system operators implement various control mechanisms such as energy storage, transmission switching, renewable energy curtailment and demand-side management. In this thesis, we first propose a multi-period mathematical programming model to discuss the effect of transmission switch-ing decisions on power systems expansion plannswitch-ing problems. We then explore the value of control mechanisms for integrating renewable energy sources into power systems. We develop a two-stage stochastic programming model that co-optimizes investment decisions and transmission switching operations. Later, we analyze the effect of demand-side management programs on peak load manage-ment. We provide a conceptual framework for quantifying the incentives paid to the consumers to reshape their load profiles while taking hourly electrical power generation costs as reference points. Finally, we study reliability aspect of the power system planning and consider unexpected failures of components. We pro-vide a two-stage stochastic programming model and discuss value of transmission switching on grid reliability.
Keywords: Generation and transmission expansion planning, Control mecha-nisms, Transmission switching, Reliability.
¨
OZET
ELEKTR˙IK G ¨
UC
¸ S˙ISTEMLER˙INDE A ˘
G TASARIMI VE
KONTROL MEKAN˙IZMALARININ ¨
ONEM˙I
Meltem Peker Sarhan End¨ustri M¨uhendisli˘gi, Doktora
Tez Danı¸smanı: Bahar Yeti¸s
˙Ikinci Tez Danı¸smanı: Ay¸se Selin Kocaman Mayıs, 2019
G¨u¸c sistemleri planlaması ve operasyonları; karma¸sık, b¨uy¨uk ¨ol¸cekli ve do˘grusal olmayan do˘gası nedeniyle enerji alanındaki zor problemlerden biridir. Yenilenebilir ¨uretimin belirsizli˘gi, arz-talep tahmin hataları ve ¨ong¨or¨ulemeyen arızalar gibi nedenlerle elektrik g¨u¸c sistemi operasyonları daha karma¸sık hale gelmektedir. Bu durumlar, sistemlerin kararlılı˘gını tehlikeye sokmakta ve arz-talep dengesinin sa˘glanmasını zorla¸stırmaktadır. Bu olayların olu¸smasını en-gellemek ya da etkilerini azaltmak i¸cin enerji depolama sistemleri, iletim hattı a¸cma/kapama, yenilenebilir enerji ¨uretiminin kısıtlanması ve talep tarafı katılımı gibi ¸ce¸sitli kontrol mekanizmaları uygulanabilmektedir. Bu tezde ilk olarak iletim hattı a¸cma/kapama kararlarının g¨u¸c sistemleri geni¸sleme planlama problemlerine etkisini incelemek amacıyla ¸cok d¨onemli bir matematiksel programlama modeli ¨
onerilmi¸stir. Daha sonra, bahsedilen kontrol mekanizmalarının yenilenebilir enerji kaynaklarının elektrik enerjisi ¨uretiminde kullanılmasındaki de˘geri ara¸stırılmı¸stır. Bu ama¸cla, yeni yatırım ve iletim hattı a¸cma/kapama kararlarını birlikte ele alan, di˘ger kontrol mekanizmalarıyla ilgili kısıtları da i¸ceren iki-a¸samalı bir stokastik programlama modeli geli¸stirilmi¸stir. Tezin bir sonraki b¨ol¨um¨unde talep tarafı katılımı programlarının pik talep y¨onetimine etkisi incelenmi¸stir. Saatlik elektrik enerjisi ¨uretim maliyetlerini referans noktası alarak, t¨uketicilerin y¨uk profillerini de˘gi¸stirmeleri i¸cin ¨odenecek te¸svikleri belirlemek amacıyla kavramsal bir ¸cer¸ceve sunulmu¸stur. Son b¨ol¨umde, g¨u¸c sistemlerindeki ¨ong¨or¨ulemeyen arızaları ele alan ve g¨uvenilirlik kısıtlarını i¸ceren g¨u¸c sistemleri planlama problemi incelenmi¸stir. Bu problem i¸cin iki-a¸samalı stokastik bir programlama modeli sunulmu¸s ve ile-tim hattı a¸cma/kapama kontrol mekanizmasının ¸sebeke g¨uvenilirli˘gi konusundaki de˘geri ara¸stırılmı¸stır.
Anahtar s¨ozc¨ukler : Uretim ve iletim geni¸sleme planlaması, Kontrol mekaniz-¨ maları, ˙Iletim hattı a¸cma/kapama, G¨uvenilirlik.
Acknowledgement
I would like to express my deep and sincere gratitude to my advisors Prof. Bahar Yeti¸s Kara and Asst. Prof. Ay¸se Selin Kocaman for their support and guidance throughout my Ph.D. study. I would like to thank them for their in-valuable advices and always being ready to provide help with everlasting patience and interest.
I am grateful to the members of my thesis committee Prof. Murat K¨oksalan and Prof. Oya Ekin Kara¸san for devoting their valuable time for reading each part of this thesis. Their comments and suggestions were of great importance in enriching the quality of this thesis. I also would like to thank to Prof. Nesim Kohen Erkip, Assoc. Prof. Se¸cil Sava¸saneril T¨ufekci and Assoc. Prof. Murat G¨ol for kindly accepting to be a member of my examination committee and for their valuable suggestions.
I would like to thank our department chair Prof. Selim Akt¨urk for giving me the opportunity to teach courses during my last year of Ph.D. study. I am always proud of being a member of Department of Industrial Engineering in Bilkent University and I would like to thank each member of the department.
I am grateful to Gizem ¨Ozbaygın, Okan D¨ukkancı, ˙Irfan Mahmuto˘gulları, Nihal Berkta¸s, Halil ˙Ibrahim Bayrak, Kamyar Kargar, ¨Ozge S¸afak, Halenur S¸ahin and Bengisu Sert for sharing good times at Bilkent during my graduate study. I also would like to thank to Engin ˙Ilseven for his discussions during this thesis. I keep my special thanks to Ece and Tayfun Filci, Ay¸se and Muharrem Keskin, Eda and S¸¨ukr¨u S¸ahin, and Esra Duygu Durmaz. I feel very lucky to have so many great people around me. Life would be cheerless and gloomy without them.
I would like to thank T ¨UB˙ITAK for financial support by its program 2211 during my graduate study.
I want to express my special thanks to my mother, father and brother for their endless support and love throughout my life. I also would like to thank all members of my new “Sarhan” family. Last but not least, I thank to my beloved husband, ¨Ozg¨ur. Without his encouragement, trust and patience, this would not be possible. I cannot thank him enough for his moral support.
Contents
1 Introduction 2
2 General Definitions and Related Literature 9
2.1 Subproblems of Power System Expansion Planning . . . 9
2.2 Control Mechanisms . . . 12
2.2.1 Energy Storage Systems (ESS) . . . 12
2.2.2 Transmission Switching (TS) . . . 13
2.2.3 Renewable Energy Curtailment (REC) . . . 14
2.2.4 Demand-Side Management (DSM) . . . 15
2.3 Reliability Criterion . . . 17
3 Substation Location and Transmission Network Expansion Prob-lem for Power Systems 20 3.1 Problem Definition and Motivation . . . 21
3.2 Problem Formulation and Solution Approaches . . . 26
3.2.1 Mathematical Programming Model . . . 27
3.2.2 Solution Approaches . . . 33
3.3 Computational Study . . . 36
3.3.1 IEEE 24-bus Power System . . . 37
3.3.2 IEEE 118-bus Power System . . . 43
3.4 Conclusion . . . 46
4 Benefits of Transmission Switching and Energy Storage in Power Systems with High Renewable Energy Penetration 48 4.1 Problem Definition and Mathematical Formulation . . . 49
CONTENTS vii
4.2 Computational Study . . . 55
4.2.1 Data . . . 55
4.2.2 Computational Analysis . . . 56
4.3 Conclusion . . . 69
5 Assessing the Value of Demand Flexibility for Peak Load Man-agement 71 5.1 Problem Definition and Mathematical Formulation . . . 72
5.2 Application on the Turkish Power System . . . 76
5.2.1 Base Scenario . . . 78
5.2.2 Effect of U . . . 80
5.2.3 Effect of M . . . 82
5.2.4 Effect of Available Capacity of Peaking Power Plants . . . 83
5.2.5 Effect of Fixed Incentives . . . 84
5.3 Conclusion . . . 86
6 A Two-Stage Stochastic Programming Approach for Reliability Constrained Power System Expansion Planning 87 6.1 Problem Formulation and Solution Methodology . . . 88
6.1.1 Mathematical Model . . . 89
6.1.2 A Scenario Reduction Based Solution Methodology . . . . 95
6.2 Computational Study . . . 98
6.2.1 IEEE 24-bus Power System . . . 98
6.2.2 IEEE 118-bus Power System . . . 106
6.2.3 Turkish Power System . . . 108
6.3 Extensions and Discussions . . . 112
6.3.1 Multi-stage Expansion Planning . . . 112
6.3.2 Demand Uncertainty . . . 114
6.4 Conclusion . . . 117
7 Conclusion and Future Work 119
A Data in Chapter 3 138
List of Figures
1.1 Illustration of demand response programs a) An illustrative load
profile b) Effect of load-shedding c) Effect of load-shifting. . . 3
1.2 An illustrative example for transmission switching. . . 5
2.1 A schematic representation of electricity value chain. . . 10
3.1 (a) Result of GTEP (b) Result of GSTEP (c) Result of GSTEP for α = 0.05 (d) Result of GSTEP for α = 0.3. . . 24
3.2 (a) Result of GTEP with adapted transmission line costs (b) Re-sult of GSTEP with original transmission line costs (c) ReRe-sult of GSTEP with adapted transmission line costs. . . 26
3.3 Flow chart of the sequential approach. . . 34
3.4 Flow chart of the time-based approach. . . 36
3.5 Load-duration curve. . . 37
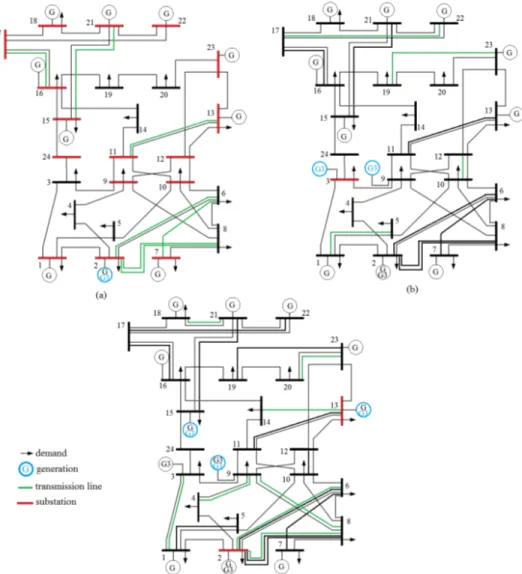
3.6 Optimum solution of the problem for the IEEE 24-bus power sys-tem (a) Time period 1 (b) Time period 2 (c) Time period 3. . . . 39
4.1 Modified IEEE 24-bus power system. . . 57
4.2 Total system cost a) Base case b) ESS case c) ESS-TS case and Top Views for d) Base case e) ESS case f) ESS-TS case. . . 59
4.3 Visual representation of the effect of TS on the total system cost (%). . . 60
4.4 Cost difference in the objective function components for the ESS case and the ESS-TS case. . . 62
4.5 Effect of TS on ESS sizing with (pls, prec)=(0.2, :) a) energy ca-pacity (in MWh) and b) power rating (in MW). . . 64
LIST OF FIGURES ix
4.6 Effect of TS on ESS sizing with (pls, prec)=(:, 0.4) a) energy
capac-ity (in MWh) and b) power rating (in MW). . . 65 4.7 Effect of TS on ESS siting and energy capacity (in MWh) for
(pls, prec)=(0.2, :). . . . 66
4.8 Effect of TS on ESS siting and power rating (in MW) for (pls, prec)=(0.2, :). . . 66 4.9 Effect of TS on ESS siting and energy capacity (in MWh) for
(pls, prec)=(:, 0.4). . . . 67
4.10 Effect of TS on ESS siting and power rating (in MW) for (pls, prec)=(:, 0.4). . . . 67
4.11 Effect of TS on REC and LS with a $148.741M budget for the total system cost. . . 69 5.1 An illustrative example for the problem. . . 72 5.2 Normalized load-duration curves observed between 2012-2016. . . 77 5.3 Monthly difference from the peak demand. . . 77 5.4 Daily variation of consumption for two sample days (a) July 30,
2015 (b) December 17, 2015. . . 78 5.5 Illustration of solutions (Each color represents a unique solution). 79 5.6 (a) Total generation amount (b) Total shifted load (c) Total shed
load for Base Scenario. . . 80 5.7 (a) Illustration of solutions for different U values (a) U = 250
MWh (b) U = 1, 000 MWh (c) U = 2, 000 MWh. . . 81 5.8 (a) Illustration of solutions for different M values (a) M = 1 (b)
M = 3. . . 83 5.9 (a) Illustration of solutions for different ratio of total avilable
sup-ply of peaking power plants to the total available supsup-ply (a) 5% (b) 10% (c) 15%. . . 85 5.10 (a) Illustration of solutions for (a) time-dependent incentives (b)
fixed incentives. . . 85 6.1 Flow chart of the proposed scenario reduction based solution
methodology (SRB). . . 99 6.2 Optimal solutions of CD-TS, PSC-TS and without reliability. . . . 101
LIST OF FIGURES x
6.3 Value of adding expected operational cost to (a) CD-TS (b) PSC-TS.104 6.4 Substations and lines on the 380-kV transmission network in Turkey.109 6.5 Power island model. . . 110 6.6 (a) Installed lines (represented by bold lines) (a) when switching
is allowed only on the new lines (b) when switching is allowed on all the lines. . . 112 B.1 ESS locations and energy capacities (MWh) for the ESS case. . . 142 B.2 ESS locations and energy capacities (Mwh) for the ESS-TS case. . 143 B.3 ESS locations and power ratings (MW) for the ESS case. . . 144 B.4 ESS locations and power ratings (MW) for the ESS-TS case. . . . 145
List of Tables
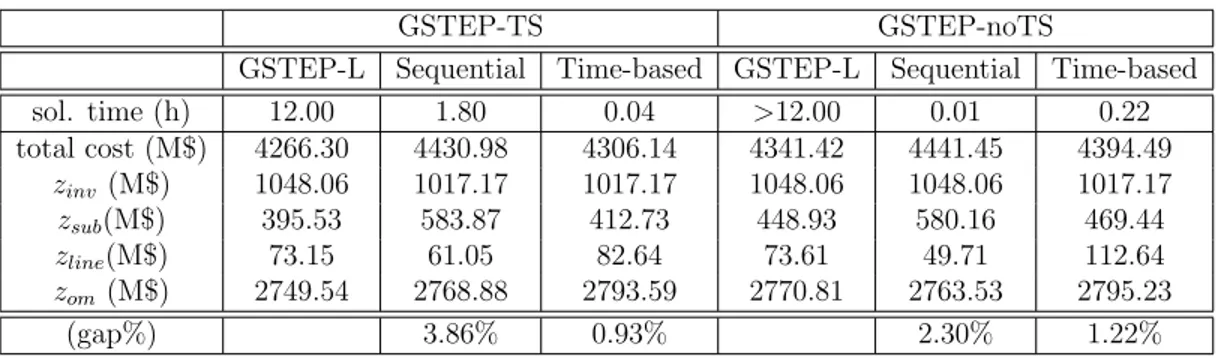
2.1 Comparison of the literature . . . 17 3.1 Results of GTEP and GSTEP for different α values . . . 25 3.2 Comparison of cases GSTEP-TS and GSTEP-noTS for three
ap-proaches on the IEEE 24-bus power system . . . 41 3.3 Installed generation and substation units for GSTEP-TS and
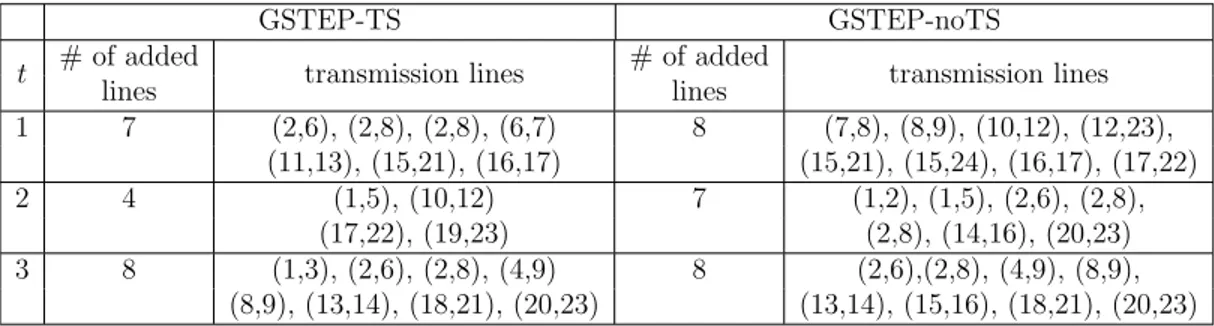
GSTEP-noTS on the IEEE 24-bus power system . . . 42 3.4 Installed number of lines and corridors for GSTEP-TS and
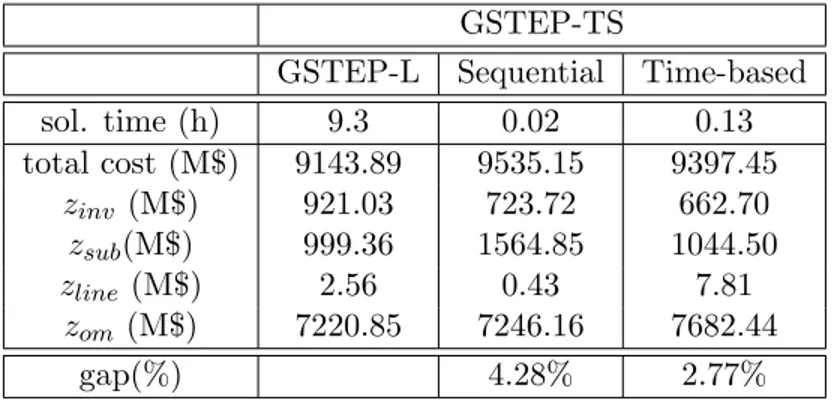
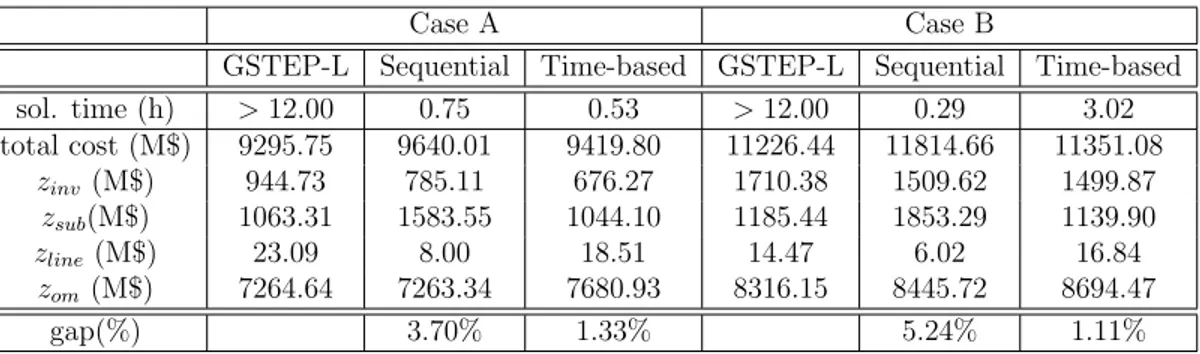
GSTEP-noTS on the IEEE 24-bus power system . . . 42 3.5 Comparison of the three approaches on the IEEE 118-bus power
system . . . 44 3.6 Comparison of cases for the three approaches on modified versions
of the IEEE 118-bus power system . . . 46 4.1 Effect of TS on the total system cost (%) . . . 60 4.2 Number of storage units for the ESS case and the ESS-TS case . . 63 4.3 Savings in ESS sizes due to TS (%) . . . 64 5.1 Comparison of cases with different U . . . 82 5.2 Comparison of cases with different M . . . 84 6.1 Value of two-stage stochastic programming on the IEEE 24-bus
power system . . . 100 6.2 Installed and switched lines in the solutions of CD-TS and PSC-TS
on the IEEE 24-bus power system . . . 103 6.3 Installed and switched lines in the solutions of CD-TS and CD-TS
LIST OF TABLES xii
6.4 Solution times of the model and the solution methodology on the
IEEE 24-bus power system . . . 106
6.5 Results for CD-TS and SRB on the IEEE 118-bus power system . 107 6.6 Results for the IEEE-118 bus power system for two cases . . . 108
6.7 Summary of the Turkish power system data . . . 108
6.8 Characteristics of Turkish power system data . . . 109
6.9 Characteristics of the generation technologies . . . 110
6.10 Results for the 380-kV Turkish transmission network for two cases 111 6.11 Results of CD-TS and SRB on the IEEE 24-bus power system for multi stage expansion . . . 114
6.12 Results for the 380-kV Turkish transmission network for multi stage expansion . . . 115
6.13 Results of CD-TS, PSC-TS and SRB on the IEEE 24-bus power system with demand uncertainty . . . 116
6.14 Results for the 380-kV Turkish transmission network with demand uncertainty . . . 117
A.1 Demand of 6-bus power system . . . 138
A.2 Characteristics of lines for 6-bus power system . . . 138
A.3 Characteristics of available line types for 6-bus power system . . . 139
A.4 Characteristics of available generation types . . . 139
A.5 Characteristics of available substations types . . . 139
A.6 Characteristics of transmission lines on the IEEE 24-bus power system . . . 140
B.1 ESS locations with maximum energy capacity common to the ESS and ESS-TS cases . . . 141
B.2 ESS locations with maximum power rating common to the ESS and ESS-TS cases . . . 141
Abbreviations and Acronyms
DC: Direct Current
CD-TS: Contingency-dependent Transmission Switching DEP: Distribution Expansion Planning
DR: Demand Response
DSM: Demand-side Management ESS: Energy Storage System FOR: Forced Outage Rate
GEP: Generation Expansion Planning
GSTEP:Generation, Substation and Transmission Expansion Planning GTEP: Generation and Transmission Expansion Planning
LS: Load-shedding LSHF: Load-shifting
MILP: Mixed-integer Linear Programming
PSC-TS: Preventive Security Constrained Transmission Switching
R-GTEP: Reliability Constrained Generation and Transmission Expansion Plan-ning
REC: Renewable Energy Curtailment RES: Renewable Energy Source SEP: Substation Expansion Planning
STEP: Substation and Transmission Expansion Planning TEP: Transmission Expansion Planning
Chapter 1
Introduction
Power system planning is a decision making process that determines locations and sizes of power system components and time of building them. The main aim of this process is to design systems to generate and transmit sufficient and continuous electrical power to the end-users in a cost-effective way. Designing power systems and determining power system operations are considered among the challenging problems in energy field due to its complex, large-scale and non-linear nature. Moreover, operating power systems with uncertainties and distur-bances such as failure of components increases complexity and causes difficulties in sustaining a supply-demand balance in power systems without jeopardizing grid reliability. Thus, to withstand the uncertainties and maintain security of grids during disturbances, the power system is expected to be flexible enough.
To increase flexibility in the power systems and operate them without en-dangering reliability, utilities can implement various control mechanisms, such as energy storage systems (ESSes), demand-side management (DSM), renewable energy curtailment (REC) and transmission switching (TS). ESSes are the most effective solutions for cleaner energy sources in electricity generation [1]. These systems smooth the intermittency and variability of renewable energy sources (RES) by storing electrical energy generated at off-peak hours to use at peak
hours. These systems can increase utilization of RES, and thus a substantial de-crease in generation from non-renewable energy sources can be achieved. More-over, by storing energy at off-peak hours, ESSes reduce the need for peaking power plants that are generally used at peak hours and decrease the total oper-ating cost to meet electricity demand of consumers and maintain supply-demand balance.
Demand-side management (DSM) refers to a group of activities to increase the overall effciency of power systems including generation, transmission, distribution and consumption. Demand response (DR) is one of the main tools of DSM and reshapes consumers’ electricity consumption or their load profiles by either load-shedding (LS) or load-shifting (LSHF) implementations. Figure 1.1a depicts an illustrative load profile. LS reduces energy consumption at peak periods (Figure 1.1b) whereas LSHF implementation shifts energy consumption from peak periods to off-peak periods (Figure 1.1c). The new load profiles after shedding and shifting consumption is presented by blue dotted lines. Efficient DSM activities can reduce operating costs in the systems, increase grid reliability and decrease greenhouse gas emissions. By rescheduling load profiles, DR programs can also reduce need for peaking power plants [2].
Figure 1.1: Illustration of demand response programs a) An illustrative load profile b) Effect of load-shedding c) Effect of load-shifting.
Renewable energy curtailment (REC) is one of the control mechanisms to maintain system energy balance and has been utilized since the beginning of the electric power industry [3]. REC is defined as reducing generation from renewable sources generally because of transmission congestion in the power systems or capacity of transmission lines. Curtailment generation from renewable sources
can also be used during low load periods or to satisfy technical and operational constraints such as maintaining system voltage level, frequency requirements or minimum generation requirements from thermal sources [4].
Transmission switching (TS) is another control mechanism and identifies the branches that should be taken out of service to increase the utilization of the network [5]. Although increasing efficiency of the grid by switching (or taking out of service) branches is a counter-intuitive phenomenon, which is one of the Braess’s paradoxes seen in transportation networks [6], adding even a zero-cost line may increase congestion in the power systems, and thus reduces utilization of the grid.
In any power systems, flows on all lines should be in proportion to their elec-trical characteristics [7]. Equation (1.1) is a Direct current (DC) approximation of power flow model and should be satisfied for all existing lines, A, in the system. ϕij is a parameter that shows the susceptance (one of the electrical
characteris-tics) of line {i, j}, fij and θi represent the flow on the line {i, j} and voltage of
the node i, respectively.
fij = ϕij(θi− θj) ∀{i, j} ∈ A (1.1)
To illustrate the benefits of TS operations, we utilize a 3-node (or referred to as 3-bus) system with a 300 MW generation unit at node 1 and 300 MW load (or demand) at node 3 (Figure 1.2a). We assume that lines {1,2}, {2,3} and {1,3} have the same electrical characteristics and capacities of them are 300 MW, 300 MW and 150 MW, respectively. To satisfy Equation (1.1), the solution should be as in Figure 1.2b. Since capacity of line {1,3} is less than 200 MW, the solution in Figure 1.2b is infeasible and the demand at node 3 cannot be met. Thus, in this case, the system operator should consider adding new lines and/or generation units to maintain supply-demand balance. However, if TS operation is utilized in this system and if line {1,3} is switched (or opened), then the solution turns out to be feasible and 300 MW can be transmitted as given in Figure 1.2c without requiring any new investments.
(a) (b) (c)
Figure 1.2: An illustrative example for transmission switching.
In this thesis, we consider challenging problems in energy field and use oper-ations research techniques to explore the value of control mechanisms explained above in power system planning and operations. We particularly discuss the effects of control mechanisms on network design and value of them for dealing with difficulties in sustaining energy balance and grid reliability. Mathematical tools and operations research techniques for energy problems have been utilized in the literature (e.g. for generation plant location and for energy distribution such as heating, electricity demand [8]) and there is an ever-growing need for the application of operations research techniques to overcome these challenging prob-lems since uncertainties and disturbances increase complexity of the probprob-lems. In this thesis, we define problems in energy field from operations research point of view. For the problems we discuss in the following chapters, we present non-linear mathematical programming formulations and use non-linearization techniques to provide linear versions of them. We also provide new solution approaches us-ing operations research techniques and test both models and solution approaches on different datasets such as IEEE 6-bus (or 6-node), 24-bus (or 24-node) and 118-bus (or 118-node) power systems.
The rest of thesis is organized as follows. Chapter 2 provides general defini-tions and summarizes the related literature on power system expansion planning problems, control mechanisms and grid reliability.
Chapter 3 explores the value of co-optimizing subproblems of power system expansion planning such as generation, transmission and substation expansion planning problems for a long-term planning horizon. In the related literature,
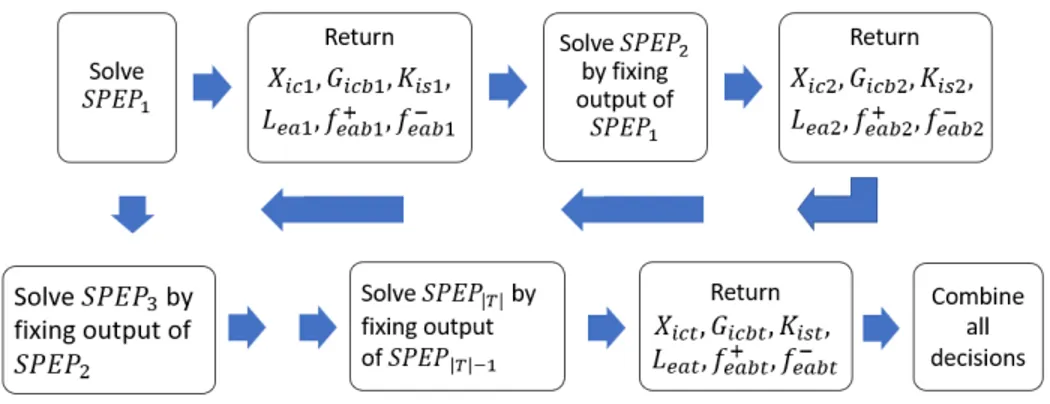
investment cost of substations are either ignored or considered as part of the investment cost of generation units and/or transmission lines. In Chapter 3, we first show that considering investment cost of substations and determining lo-cation and size of them can considerably change the network design. We then propose a mixed integer linear programming model (MILP) for a multi-period power system planning problem considering transmission switching (TS) opera-tions in order to find the least costly expansion plan. A solution methodology, in which we decompose our integrated multi-period problem into a set of single period problems as many as the number of expansion periods, is also presented to overcome the computational challenge of the proposed model. The results show that the proposed solution approach yields near optimal solutions in minutes.
In Chapter 4, we discuss value of control mechanisms to handle the variability of RES in a power system with a high renewable energy penetration for a target year. Since TS is a common practice in power systems to increase transfer ca-pacity of the grids [9], the beneficial impact of TS is discussed in many studies (e.g. [9, 10]). However, to the best of our knowledge, there is no study that discusses value of TS on both storage siting and sizing decisions. In this chapter, we introduce a two-stage stochastic programming model that co-optimizes TS operations, and transmission and storage investments (i.e. storage locations and sizes) subject to limitations on load-shedding (LS) and renewable energy curtail-ment (REC) amounts. We discuss the effect of TS on the total investcurtail-ment and operational costs, siting and sizing decisions of ESSes, and LS and REC mech-anisms. Using these analyses, we precisely characterize the joint benefits of TS and ESSes. The results obtained with different scenarios provide insights about the role of storage units for different limits of LS and REC control mechanisms.
In the literature, most studies include penalty costs (or can be considered as incentive payments) for demand response (DR) programs and/or REC policies to compensate for their impacts on quality of life and revenue losses from renewable energy generators. However, if these penalty costs are not well defined, opera-tional and/or tactical plans may be affected. Thus, in Chapter 4, instead of using monetary values for LS and REC, we limit LS and REC amounts and examine the effects of these limits on the solutions.
Motivated from the explanation above related to the effect of penalty costs on the plans, in Chapter 5, we discuss DR programs and develop a conceptual framework in the macro level for quantifying the incentive paid to the consumers to reduce or shift their energy consumptions. A MILP model that considers load-shifting (LSHF) and load-shedding (LS) programs as an alternative to deploying generation from peaking power plants that generally have high operational costs is presented. The model minimizes total operating cost associated with deploying generation from peaking power plants and incentives paid to consumers for LSHF and LS programs for one year. An analysis has been performed to identify the break-even ratios between the costs of LSHF, LS and operating peaking power plants for the alternative DR policies while taking hourly costs of operating peak-ing power plants as reference points. In this chapter, we characterize break-even points for the incentives using a real data from the Turkish power system and analyze the effects of key parameters (e.g maximum load that can be shifted in one day and different incentive payment policies) of our model on the solutions.
Chapter 6 discusses the reliability aspect of the power system expansion plan-ning problem where reliability is defined as the ability to withstand disturbances arising from outage of generation units and/or transmission lines [11]. The prob-lem determines the new investments to guarantee that the system remains fea-sible (whole system load can still be met) after outage of generation units or transmission lines for a target year. Related literature plans the new invest-ments by considering only the feasibility of the power system after outage of the components and disregard the outcomes (e.g. operational costs) during these contingency states. In this chapter, we present a two-stage stochastic program-ming model for the problem that considers each outage of a line as single sce-nario with a certain probability of happening. We then include the operational costs for each contingency (or scenario) in the objective function in the expected form. Since the role of randomness in outages in the power system expansion planning can be more prominent especially when TS is considered, we introduce contingency-dependent TS as recourse actions of our two-stage stochastic model that calculates the expected operational cost in a more accurate manner. We also propose a solution methodology with a filtering technique that aggregates
scenarios and reduces number of scenarios in consideration. The results of the model and solution methodology show that the proposed solution method finds results in significantly shorter solution times compared to the solution times of the model.
In this chapter, we also introduce a real-world data set to the literature for the 380-kV Turkish transmission network, which is published in Mendeley Data1 and
present our results for this data set. This thesis concludes with final remarks, future research directions and discussion on possible extensions.
1Peker, Meltem; Kocaman, Ayse Selin; Kara, Bahar (2018), ”A real data set for a 116-node
Chapter 2
General Definitions and Related
Literature
In this chapter, the following three sections provide detailed definitions of given concepts in Chapter 1, and summarize the literature on subproblems of power system expansion planning, control mechanisms and reliability criterion, respec-tively.
2.1
Subproblems of Power System Expansion
Planning
For many years, power system expansion planning problems attract researchers mainly due to the challenge of their nonlinear and complex nature. Studies that focus on finding the least cost (or the best possible) solution for the problem differ from each other by the assumptions or the level of decomposition that they use in their solution approaches to ease the complexity of the problem. Dividing the power expansion planning problem into subproblems and trying to solve these easier subproblems sequentially is a widely used approach in the literature [7]. These subproblems include problems of generation expansion planning (GEP),
transmission expansion planning (TEP), distribution expansion planning (DEP) and substation expansion planning (SEP).
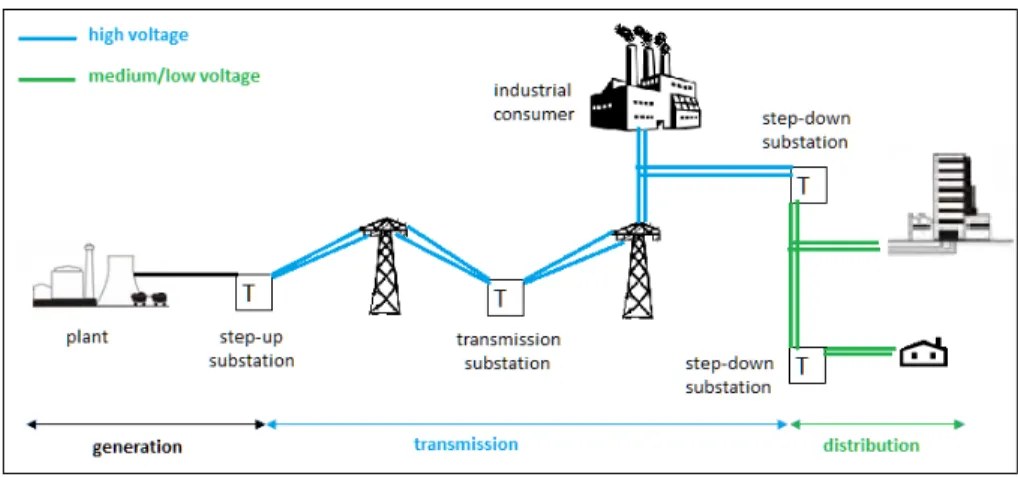
GEP deals with the expansion capacity of generation units while minimizing investment and operating cost to satisfy the load. TEP addresses the problem of determining the optimal configuration of the network in order to meet demand over the planning horizon while satisfying economical, technical and reliability constraints. DEP is similar to the TEP and it aims to find the optimal config-uration of the network for the distribution phase of the electricity value chain. Lastly, SEP addresses the problem of optimal sizing, sitting and allocating new substations and expanding the capacity of existing substations. Depending on the level of decomposition, different types of substations, such as generation (step-up), transmission and distribution (step-down) substations are also considered in the expansion planning problems [12] (Figure 2.1).
Figure 2.1: A schematic representation of electricity value chain.
Although there are some papers that only focus on GEP [13]-[18] and TEP [19]-[22] problems, in the literature, there are also studies which consider transmission and generation as inseparable components of the power systems [23]. Generation and transmission expansion planning (GTEP) problem simultaneously optimizes the decisions related to generation plants and transmission network. In [24] and [25], a single period GTEP problem and in [26], a multi-period GTEP problem are considered. Multi-period GTEP problem are discussed in many studies with different extensions such as including demand-side management [23], renewable
energy sources [27] and greenhouse gas emissions [28]. Since long-term power system expansion planning problems are complex, some researchers work on im-proving computational quality of the problem (e.g. [29]).
SEP problems are generally studied within the context of DEP problem once the generation requirements are known [30]. There are a limited number of papers that study substation and transmission expansion planning (STEP) problems simultaneously. In [31], a single period STEP problem is studied and the locations of substations, their connections to demand points as well as the lines between substations are determined. An algorithm that decomposes the problem into investment and feasibility-check subproblems is also proposed in [31]. In [32], a scenario-based stochastic STEP problem for a single period is discussed. The model in [32] finds new substations and transmission lines, and determines the generation amounts only at prescribed generation plants. Problems similar to SEP and STEP are also studied in DEP for determining locations of distribution substations and connection of demand nodes to the substations lines as in [33]-[36].
In the GTEP problems, decisions related to substation locations are not in-cluded. Similarly, in the STEP problems, generation expansion decisions (i.e. locations and sizes) are not included to the problem. To the best of our knowl-edge, there is no study that considers the expansion planning of substations in the GTEP problems. With the aim of filling this gap in the literature, in Chapter 3, we present an integrated generation, substation and transmission expansion planning problem (GSTEP) and show value of considering substation decisions explicitly in the power system expansion planning problem. We also note that in power system expansion planning problems, most studies focus on cost mini-mization as we do in Chapter 3. For real-life applications, there might be other considerations (e.g. social and environmental) that affect decisions of substation units’ expansion planning and for more information about these factors, we refer the reader to [37]-[39].
2.2
Control Mechanisms
Increasing concerns about the environment and energy security reveal the neces-sity of using clean and sustainable energy resources in electricity generation. To encourage new investments in order to use more renewable energy sources (RES), utilities implement policies such as feed-in tariffs, carbon taxes and/or renewable portfolio standards [40], and as a result, a 19% share of RES in meeting world electricity demand in 2000 increased to 24% in 2016 [41]. Improvements such as this help reduce carbon emissions and dependence on fossil fuels. However, increased penetration of RES can lead to high variability and uncertainty in elec-tricity generation as these sources are intermittent and dependent on atmospheric conditions and spatial locations. Low predictability and variability of electricity generation from RES can cause difficulties in sustaining a supply-demand balance and/or power frequency in a grid, and thus can impose new challenges around power system reliability and stability. To continue utilizing these clean sources without endangering power system reliability, utilities implement various con-trol mechanisms such as energy storage systems (ESSes), transmission switching (TS), renewable energy curtailment (REC) and demand-side management (DSM). These control mechanisms are detailed in the following subsections.
2.2.1
Energy Storage Systems (ESS)
Energy storage systems are the most effective solutions for integrating RES in electricity generation. These systems store electrical energy generated at off-peak hours to use at peak hours. Thus, they smooth the intermittency of RES and increase generation from RES and decrease greenhouse gas emissions.
The value of ESSes has been increasingly discussed in the literature from dif-ferent perspectives. Most studies focus on system operation and determine the ESS’ state of charge for each time period [42]. In these studies, given the locations and sizes of the storage units, the aim is to maximize profit by bidding/selling operations in energy markets. However, these studies ignore the effect of ESS
locations and sizes (e.g. [43]). To address this deficiency, other studies consider ESS locations and operations simultaneously for multi-stage [44], robust [45] and long-term [46] planning problems. There are also a few papers that optimize only ESS sizes under demand and generation uncertainties [47].
To fully reveal the benefits of ESSes, their siting and sizing decisions should be considered simultaneously during the planning stage; however, only few pa-pers focus on this co-optimization process. A three-stage heuristic algorithm to solve the co-optimized problem is proposed in [42]. Effect of different technology types, such as pumped storage hydro, compressed-air energy storage, lithium ion batteries and fly-wheel energy storage on sizing ESSes are analyzed in [48]. In [49], the effect of REC penalty costs and the capital costs of storage units on optimal ESS locations and sizes are discussed. In [50], the value of co-optimizing ESS and GTEP considering renewable portfolio standards is assessed. The effect of limiting budget for investing storages on ESS locations are discussed in [51]. A long-term planning problem considering battery lifetime and degradation are examined in [52].
2.2.2
Transmission Switching (TS)
Transmission switching is another control mechanism that adds flexibility to the grid and a common practice in power systems to increase transfer capacity of the system [9]. Beneficial impacts of TS on power systems planning and operations has been demonstrated in academic studies as well as industrial applications such as for the California and New England independent system operators in [53] and for the PJM system in [54, 55]. The value of TS is also discussed for theoretical examples. The first mathematical programming model considering TS is provided in the context of TEP problem in [56]. Later, the effect of TS on GTEP problem is presented in [57] and by limiting number of switchable lines, the solutions for different cases are compared. The benefits of TS are also discussed in many studies from perspectives such as reliability [5, 9] and economic efficiency [10]. The value of TS in reliability will be detailed in Chapter 2.3.
There are a few studies that discuss the effect of TS on RES penetration. The value of TS on wind power penetration levels and line capacity expansion plans are discussed in [58]. The effect of TS on total system cost and utilization of wind power, considering the uncertainty of wind power generation are presented in [59]. In [60], a linearized Alternative Current (AC) model is developed to analyze benefits of TS operations on RES utilization. However, none of these studies includes storages. To the best of our knowledge, only a few papers simultaneously consider TS operations and ESS investment planning. In [61] and [62], TS and storage operations are considered simultaneously in a unit commitment problem without allowing new investments. In [63], a model for an investment planning problem including TS operations is proposed to find out the locations of new transmission lines and storages.
2.2.3
Renewable Energy Curtailment (REC)
Renewable energy curtailment is also used to handle RES variability. With an increase in RES penetration, a significant amount of renewable energy could be curtailed due to technical and operational reasons to maintain system voltage and frequency levels or to satisfy minimum generation requirements from thermal sources [4]. However, by lowering RES supply, the benefits of using clean sources and revenues from renewable generators are reduced. Moreover, REC can be considered as a significant waste, especially for countries that have renewable energy targets (such as Australia, Turkey, Brazil and Ireland [64, 65]). Therefore, to promote new investments in sustainable energy, in some real markets, revenue losses from renewable energy generators are sometimes compensated for in some contracts/policies [66, 67]. For this compensation, in [45, 52, 60, 62] a penalty cost for curtailing generation from RES is considered. The effect of penalty cost for REC on the optimal location and size of storages are discussed in [49].
2.2.4
Demand-Side Management (DSM)
Demand-side management refers to a group of activities to increase the overall efficiency in the power system. Demand response (DR) is one of the main tools of DSM and increases demand flexibility in the system, and thus reduces capacity requirements. DR programs help utilities reduce demand at peak hours by either shifting or curtailing load [2]. Efficient implementation of DR may also reduce the need for peaking power plants and/or under-utilized electrical infrastructures, which can have high investment and operational costs. Since reducing demand intentionally by load-shifting (LSHF) and/or load-shedding (LS) programs affects quality of life, incentive payments, which is also referred to as penalty cost or value of loss load, are generally considered to compensate for the impact on life quality [1].
The value of DR applications has been discussed in the literature from different perspectives. Effect of DR on power systems for managing generation uncertainty and outages is analyzed in [68]. In [69], it is discussed that demand flexibility can increase prices in the systems with high wind power production. In [70], benefits of DR together with storage and distributed generation on capital investments are evaluated. Demand flexibility is analyzed in terms of decreasing wind curtailment in [71] and determining market clearing prices with multiple consumer groups in [72]. The effect of DR is also analyzed in different problems such as unit commitment [73] and expansion planning [74].
In the macro level, benefits of having flexible demands are analyzed for different power systems such as in the U.K [75], German [76] and China [77]. The potential economic impact of having flexible demand and renewable sources are presented for the Spanish electricity market in [78] and for the German power system in [79]. The existing programs at different independent system operators in the U.S. are summarized and limitations for participation of DR to these systems are explained in [80]. DR in the of context of integrated strategic resource planning is discussed for the power system of China to reduce carbon emission and increase renewable energy utilization [81].
Although the value of DR programs has been demonstrated in both theoreti-cal examples and real power systems, the success of DR programs highly depends on consumers’ acceptance and willingness to participate in DR programs. Con-sumers’ behaviors and perceptions on DR programs have also been discussed in the literature. Distrust of utility and seeing no need for the programs are re-ported as crucial factors for unwillingness to participate in DR programs [82]. Psychological factors that shape consumer behavior in regard to electricity prices are also examined in [83]. The authors note that insights from psychology and behavioural economics could be utilized to find appropriate DR programs.
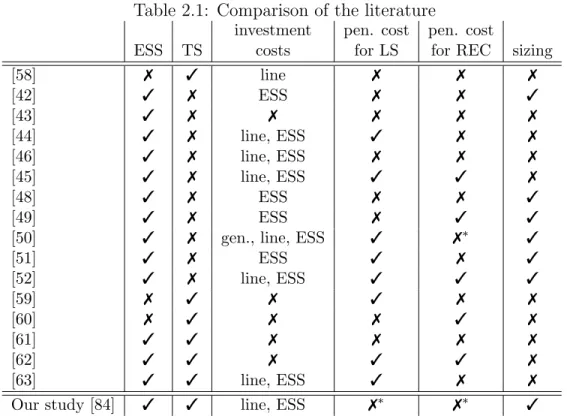
In Chapter 4, we discuss value of co-optimizing TS operations, and transmis-sion and storage investments (i.e. ESS locations and sizes) subject to limitations on LS and REC amounts. As presented in Table 2.1, except for our study, there is no paper that considers TS operations, transmission and ESS investments de-cisions simultaneously. In Chapter 4, we fill a gap in the literature by proposing a model and analyzing the value of TS on ESS siting and sizing decisions alike. We present that TS can be a more efficient and cheaper solution compared to building new lines or more expensive ESSes. Therefore, considering TS in power system strategic and/or operational planning leads to higher social welfare by decreasing overall costs, enhancing quality of life and utilizing cleaner sources in electricity generation.
As presented in Table 2.1, most papers include penalty costs for LS and/or REC policies to compensate for their impacts on quality of life and revenue losses from renewable energy generators. However, we note that operational and/or tactical plans may be affected if these penalty costs are not well defined. More-over, the impact of the cost parameters might be more prominent if both are considered in the planning phase, as used in the problem discussed in Chapter 4. Therefore, instead of using monetary values for LS and REC, we limit LS and REC amounts and examine the effects of these limits on the solutions.
In Chapter 5, we analyze DR programs and develop a conceptual framework for quantifying the incentives payments for LSHF and LS applications. To the best of our knowledge, there is no study that identifies the break-even ratios
Table 2.1: Comparison of the literature
investment pen. cost pen. cost
ESS TS costs for LS for REC sizing
[58] 7 3 line 7 7 7 [42] 3 7 ESS 7 7 3 [43] 3 7 7 7 7 7 [44] 3 7 line, ESS 3 7 7 [46] 3 7 line, ESS 7 7 7 [45] 3 7 line, ESS 3 3 7 [48] 3 7 ESS 7 7 3 [49] 3 7 ESS 7 3 3
[50] 3 7 gen., line, ESS 3 7∗ 3
[51] 3 7 ESS 3 7 3 [52] 3 7 line, ESS 3 3 3 [59] 7 3 7 3 7 7 [60] 7 3 7 7 3 7 [61] 3 3 7 7 7 7 [62] 3 3 7 3 3 7 [63] 3 3 line, ESS 3 7 7
Our study [84] 3 3 line, ESS 7∗ 7∗ 3
7∗ instead of using penalty cost, the values are limited by various upper bounds.
between the costs of LSHF, LS and operating peaking power plants that would result in alternative DR policies. In this direction, we propose a MILP model that considers DR programs as alternatives to using peaking power plants while considering hourly generation costs of peaking power plants as reference points. Using an extensive computational study, we assess incentive payments and find out break-even points using a real data from the Turkish power system. We also analyze effect of key parameters of the proposed model on the incentive payments.
2.3
Reliability Criterion
Reliability constrained generation and transmission expansion planning (R-GTEP), another problem commonly studied in literature, defines reliability as the ability to withstand disturbances arising from outage of generation units or transmission lines [11]. This problem determines the new investments to guar-antee that the system remains feasible in case of component breakdowns. Most
of the studies that consider reliability criteria plan new investments based on only the feasibility of the power system after a line or generator contingency and ignore the outcomes during the contingency states [85]-[90]. As the probabilis-tic realizations of outages are customarily overlooked, the effect of randomness in contingencies on the investment plans and the cost of the expansion plans are usu-ally disregarded. Some papers partiusu-ally consider the probabilistic realization of outages by considering loss of load probability and/or expected energy not served [91]-[94] or risk-based decision-making process [95, 96]. Although these papers consider the effect of randomness in contingencies on the investment costs, they still overlook the effect of probabilistic nature of contingencies on the operational costs. Reliability of power system has been also discussed considering different sources of uncertainties such as uncertainty in generation or consumer behavior of electricity price [97]-[99]. However, these studies also do not explicitly include the operational costs during the contingency states.
Beneficial impact of TS on the reliability are demonstrated in [10, 100, 101]. In [10], the value of a seasonal transmission switching on the total cost and reliability level of the power system is discussed. In [100], TS and N-1 reliabil-ity criterion2 are considered simultaneously. In [101], the effect of TS on the
power system is analyzed and the monetary value of expected energy not served (EENS) for the solutions are calculated and the effect of TS on EENS is dis-cussed. However, in these studies the status of transmission lines are determined before observing the contingencies and network topology is designed to satisfy the whole system load after any contingency without requiring operator control on generators. This approach is referred to as preventive security constrained transmission switching [101], and ignores the probabilistic nature of outages and the expected operational costs during the contingencies. Therefore, the overall costs of the investment planning projects are underestimated. Although having a single network topology for all time periods is extremely unlikely due to uncer-tainties [53], system operators have flexibility to monitor and change the status of the transmission lines after a contingency. For this purpose, we introduce a new transmission switching concept, contingency-dependent TS, which entails the
2A power system that satisfies N-1 reliability criterion remains feasible after outage of a
definition of transmission switching decisions based on each contingency.
In Chapter 6, we propose a two-stage stochastic programming model for the R-GTEP problem that includes expected operational cost during the contingen-cies, an aspect that has been overlooked in the literature which can affect the investment plans. We calculate expected operational costs in a more accurate manner by utilizing the proposed contingency-dependent TS concept. To over-come computational burden of the R-GTEP problem different approaches such as determining a short list of the candidate lines [86, 87], line outage distribution factors method [88, 89], worst case analysis [90] and umbrella constraint discov-ery technique [102, 103] are used in the literature. In this chapter, we utilize a filtering approach to find the critical contingencies. Thus, by using the filtering approach, we reduce the computational challenge of the two-stage stochastic pro-gramming model and find the optimal or near-optimal solutions for the original problem that satisfies the N-1 reliability criterion.
Chapter 3
Substation Location and
Transmission Network Expansion
Problem for Power Systems
This chapter discusses subproblems of power system expansion planning and ex-plores the value of co-optimizing these subproblems. We first demonstrate the economic value of incorporating substation decisions to the generation and trans-mission expansion planning problem for a long-term planning horizon. We then provide an integrated model including generation, substation and transmission components of the power system to find the least cost network by determining the locations and sizes of these components simultaneously. We also propose a solution methodology, in which we decompose the multi-period problem into several single-period problems that are solved sequentially to overcome the com-putational challenge of the proposed model. The model and solution method are tested on the IEEE 24-bus and 118-bus power systems.
The organization of this chapter is as follows: In Section 3.1 we explain our problem and present the value of adding substation decisions to the Generation and Transmission Expansion Planning (GTEP) problem on a small sized instance. Section 3.2 provides the mathematical model and solution approaches for the
problem. We show and discuss the results of the proposed model in Section 3.3. We also compare the results of the proposed solution approach with the solutions that are obtained by sequentially solving the subproblems. This chapter concludes with Section 3.4. The results of this chapter are currently under second revision in Networks and Spatial Economics.
3.1
Problem Definition and Motivation
In the literature, different types of substations are considered in the expansion planning problems depending on the level of decomposition of the problem, such as generation (step-up), transmission and distribution (step-down) substations [12]. However, in GTEP problems, substation components, which can be used to increase/decrease the voltage of the power at critical locations or re-route the power flow, are not explicitly included. A central planner might consider investment cost of a step-up substation as a portion of the investment cost of a generation plant, since a generator is always connected to the grid through a step-up substation. Similarly, the planner might also consider the investment cost of transmission and step-down substations as a part of the investment cost of lines. However, with these approaches capacity planning of the substations might not be correctly determined as they are calculated independently from the rest of the grid. The substations’ capacities might depend on the total generation amount of the plants that are connected to the substations or power flows sent through step-up and/or transmission substations. Thus, investment cost of the substations may not be included correctly to the expansion plan and might underestimate or overestimate the real cost in the power system. Moreover, without including decisions related to substations’ locations and capacities to the GTEP problem, a different network configuration and a different expansion plan for the system components might be obtained.
An integrated model for the expansion planning is necessitated and we dis-cuss an integrated generation, substation and transmission expansion planning (GSTEP) problem in this chapter. Given the demand of nodes and possible
generation amounts from different source types, the model finds optimal siting, sizing and timing of system components (generation plants, substation units and lines) in order to fulfill power demand in a multi-period planning horizon. The model minimizes total investment and operational costs and determines power generation amounts, power flows and flow directions on the transmission lines considering transmission switching option.
To motivate the problem and discuss the value of including substations deci-sions in GTEP problem, we first provide a real-life example for the North Ameri-can power grid. We then present an example using a 6-bus network and compare the optimal results with and without substation decisions. In [12], the North American power grid which includes generation plants, major substations and transmission lines is explained. In the North American power grid, the authors identified 14,099 nodes as substations for the North American power system. Substations that have a single high-voltage transmission line are referred to as distribution substation, and that are located at a source of power are referred to as step-up substations. The remaining ones are classified as transmission sub-stations. In [12], 1633 of 14,099 nodes are distinguished as step-up substations, 2179 nodes are referred to as distribution substations and the remaining ones are labeled as transmission substations. In such a large power system, ignoring in-vestment costs of substations or considering as a part of inin-vestment cost of other components may underestimate or overestimate the total costs and may result with a different network structure. We note here that, in our problem setting, we utilize the same assumptions for the types of substations as in [12]. As we detail in Section 3.2, if a generation plant is built, then we require a step-up substation at the same node and if there is a node at an intersection point of more than two lines, then we also require a transmission substation at that node.
In the following example, we discuss the value of explicitly modeling substa-tions in the problem by comparing the optimal solusubsta-tions of GTEP and GSTEP obtained through a mathematical model presented in Section 3.2. We show that including substation decisions affects the network structure, changes the substa-tions’ locations and decreases the total cost on a 6-bus power system. Although the following is an example for a greenfield investment planning (i.e. there is
no existing infrastructure in the system), the same discussions are also valid for brownfield investments (i.e. there are existing generators, substations and lines) as presented later in Section 3.3.
For this example, demand of buses and candidate lines are adapted from [104] and provided in Appendix Tables A.1 and A.2. Load of buses is taken as 1/4 of the loads given in [104] and bus 6 is also considered as a demand node with 10 MW load. In addition to the transmission line type with 100 MW capacity given in [104], we include one more transmission line type with 50 MW capacity (Appendix, Table A.3). Three types of generation plants and five type of sub-stations are considered for both step-up and transmission subsub-stations, and the characteristics of them are given in Appendix, Tables A.4 and A.5, respectively.
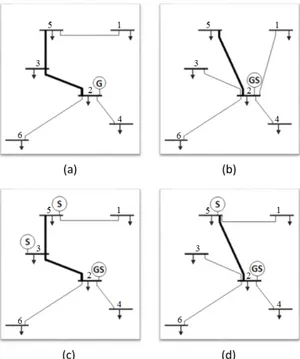
Figure 3.1a and Figure 3.1b present the optimal networks resulting from GTEP and GSTEP problems, respectively. In the GTEP output, one generation plant at node 2, and 5 transmission lines are built with the total cost of $229.64M (Figure 3.1a). Thick lines have 100 MW capacity whereas the other lines have 50 MW capacity. Although it is not explicitly modeled in GTEP problem, there should be 3 substations: one for step-up substation at node 2 in order to connect generation plant to the grid and two for transmission substations at nodes 3 and 5, which are required to change the line type or to re-increase voltage of power in order to decrease power loss due to long distances between the nodes or to re-route power flow. We calculate the required capacities with respect to the generation amount and power flows on the lines. Using Table A.5 in Appendix, we then calculate the investment costs of substations and it is equal to $31.44M. When the costs of substations are added to the optimal cost of the GTEP, which is $229.64M, the overall cost turns out to be $261.08M. In the GSTEP solution, with the same parameter setting, we obtain a star network solution (Figure 3.1b), i.e. power is directly sent to all the demand nodes from generation plant at node 2. In this case, we have only one substation at node 2 and 5 transmission lines, and the optimal cost of GSTEP is equal to $247.82M. Hence, for this example, by including decisions related to substations, we decrease the total cost of the power system by $13.26M and by 5.07%.
One can question the effect of the investment cost of substations to the network structure and to the total cost of the power system. In order to analyze this effect, we come up with a parametric analysis by multiplying investment cost of substations with a factor, α. Figure 3.1c and Figure 3.1d present the optimal networks for GSTEP problem when investment cost of substations are multiplied by α=0.05, 0.3, respectively. Table 3.1 shows the results of all instances with the cost distribution in terms of investment costs of generation, substation, lines, and operation and maintenance (O&M) cost for both GTEP and GSTEP problems for α =0.05, 0.3 and 1.0 where α =1.0 corresponds to the original investment cost of substations. Under the columns GTEP, the values given in bold show the calculated substation cost depending on α.
Figure 3.1: (a) Result of GTEP (b) Result of GSTEP (c) Result of GSTEP for α = 0.05 (d) Result of GSTEP for α = 0.3.
When the investment cost of substations is small, (i.e. α = 0.05), the optimal solution of GSTEP is the same as GTEP (Figure 3.1a and Figure 3.1c). That is, the output of the formulation where investment cost of substations are ignored (GTEP) is the same with the one where they are explicitly considered (GSTEP). When α = 0.3, in the optimal result, there exist only two substations at nodes 2 and 5, and 5 transmission lines with only one of them being 100 MW capacity
(Figure 3.1d). Thus, even when α = 0.3, beside the locations of substations, the capacity of the components in the network also changes. For this case, the total cost of GTEP (after adding substation costs) is 0.86% higher than the total cost of GSTEP. When α = 1.0, value of integrating substation to the problem is more obvious since total cost of GTEP is 5.35% higher than the total cost of GSTEP.
Table 3.1: Results of GTEP and GSTEP for different α values
α=0.05 α=0.3 α=1.0
GTEP GSTEP GTEP GSTEP GTEP GSTEP
total cost(M$) 231.21 231.21 239.07 237.04 261.08 247.82 generation inv. cost (M$) 180.00 180.00 180.00 180.00 180.00 180.00 line inv. cost (M$) 22.56 22.56 22.56 23.28 22.56 26.16
O&M cost (M$) 27.08 27.08 27.08 26.80 27.08 26.73 substation inv. cost (M$) 1.57 1.57 9.43 6.95 31.44 14.92
A similar analysis is also made by multiplying the investment cost of trans-mission lines by 3.0 and Figure 3.2 presents the optimal networks resulting from GTEP and GSTEP problems for the original and adapted cost of transmission lines. The network obtained from GTEP remains the same when the investment cost of transmission lines is increased (Figure 3.2a). However, even in a small net-work, the network obtained from GSTEP changes significantly as the investment cost of the lines is increased. When cost of transmission lines are at their original values, there are one generation unit, one step-up substation and 5 transmission lines with only one of them being 100 MW capacity (Figure 3.2b). But, as the cost increases, the optimal solution of GSTEP changes and two generation units and two step-up substations are built at nodes 2 and 5 (Figure 3.2c). In this case, four transmission lines are built with 50 MW capacity.
From these examples, we can conclude that substation decisions should be included into the GTEP problem and, central planner should co-optimize genera-tion, transmission and substation expansion planning problems since considering substation decisions may decrease the total cost in the power system (Table 3.1) and also change the network structure and expansion plans substantially (Fig 3.2). Hence, in this chapter, we aim to provide an integrated model including
Figure 3.2: (a) Result of GTEP with adapted transmission line costs (b) Result of GSTEP with original transmission line costs (c) Result of GSTEP with adapted transmission line costs.
generation, substation and transmission components of the power system to find the least cost network by determining the locations and sizes of these components simultaneously. We can also get some insights about the changes in the optimal solutions with respect to the investment costs of substations. We can see that depending on the ratio between the substation cost and the costs of other system components, the optimal cost and optimal expansion plans of the systems can be highly different and our analysis can also help find these break-even ratios that would result in significant investment differences. We also note here that, in some cases, adding more equipment such as transformers to an existing substation site might be enough for expansion planning instead of building a new substation site. As shown in the examples above, central planner can consider alternative investment costs for upgrading the existing system and obtain an expansion plan with reinforcing the capacity of substations.
3.2
Problem Formulation and Solution
Ap-proaches
In this chapter, we consider Direct Current (DC) power flow model, an approx-imation of Alternative Current (AC) power model, and a single load scenario as in [23, 24, 26, 27, 105]. We determine a sufficient number of operating conditions and divide each time period into a set of load blocks to consider variability of
demand within the time period [57, 106]. As in [27], we also assume that a prede-termined ratio of the transferred power is lost due to line resistance and the ratio depends on line types. As we explain in Section 3.1, a new generation plant is always connected to the grid through a step-up substation. Thus, we guarantee that there is an existing step-up substation or a new step-up substation built at the same node with the new plant. We also explain that there should be a trans-mission substation if there is a node at an intersection point of more than two lines to transmit power to other demand nodes or other substations. Hence, in our model we also guarantee that the nodes at an intersection point has a trans-mission substation in order to transform/re-increase the voltage level or reroute the power flow. For brevity, throughout this chapter, we refer a node that has just substations as substation node, a node that has substation and generation units as generation node and the remaining nodes (which have no generation and substation units) as demand node.
3.2.1
Mathematical Programming Model
We use the following notation for the mathematical programming model. Let G = (N, E) be a graph where N is the node set for demand nodes and candidate nodes for locating generation plants, substation units; and E is the candidate corridors for building transmission lines. We note that substations are only dif-ferentiated with respect to their capacities (as in Appendix, Table A.5). In this chapter, our planning horizon is for T periods and each time bucket has T I years. Since GSTEP problem is for a long-term planning horizon, this problem can be considered for strategic planning.
• Sets (Indices)
N set of all nodes (i and j)
E set of corridors (e = {i, j})
Ψ+(e) sending-end bus of corridor e
Ψ−(e) receiving-end bus of corridor e
A set of line types (a)
C set of generation technologies (c)
S set of substations (s)
B set of load blocks (b)
T set of periods (t)
• Parameters
Dibt demand of node i at load block b
CapGict generation capacity in node i from source type c at period t (MW)
CapLa capacity of transmission line
type a (MW)
CapSs capacity of substation type s (MVA)
le distance of corridor e (km)
r discount rate
cinvc investment cost of source type c ($)
comc operation&maintenance cost of
source type c ($/MWh)
clinea investment cost of transmission line
type a ($/km)
ϕea susceptance of line type a of
corridor e (p.u.)
T I number of years in each period
efa transmission loss on the line type a
per unit flow
csubs investment cost of substation type s ($)
durbt duration of load block b at period t (h)
• Decision Variables
Xict 1 if source type c is built
at node i at period t, 0 o.w.
Gicbt generation amount in node i from
source type c at load block b at period t
Kist 1 if substation type s is built at
node i at period t, 0 o.w.
Kit 1 if at least one substation exists
at node i at period t, 0 o.w.
θibt voltage angle of node i at load block b
at period t
Leat 1 if line type a exists at corridor e
at period t, 0 o.w.
Zeabt 1 if line type a at corridor e is closed
at load block b at period t, 0 o.w.
feabt flow on line type a at corridor e at load
block b at period t
The proposed model for GSTEP is as follows. The objective function (3.1) min-imizes net present value of total cost; the first three terms are for the investment costs of generation plants, substation units and transmission lines, respectively. The last term calculates the total operational cost during the planning horizon. The function κ(r,TI)=(1 + r)(1 − (1 + r)−T I)/r is to calculate the present value of annual cost that has T I years in each time period with interest rate r [107]. We remark here that, the cost of losses is not explicitly modeled in the objec-tive function since total generation in the system is equal to total demand and power losses, and losses are inherently included within the operational cost (zom)
min zinv+ zsub+ zline+ zom (3.1) zinv = X t∈T (1 + r)−TI(t−1)X i∈N X c∈C cinvc Xict zsub= X t∈T (1 + r)−TI(t−1)X i∈N X s∈S csubs Kist zline= X t∈T (1 + r)−TI(t−1)X e∈E X a∈A
clinea le(Leat− Leat-1)
zom = X t∈T (1 + r)−TI(t−1)κ(r,TI)X i∈N X c∈C X b∈B comc durbtGicbt
• Power Balance Constraint:
X c∈C Gicbt+ X e∈E|Ψ−(e)=i X a∈A feabt− X e∈E|Ψ+(e)=i X a∈A (1 + efa)feabt= Dibt ∀i ∈ N, b ∈ B, t ∈ T (3.2)
Constraint (3.2) provides the power balance, that is equivalent to Kirchhoff’s first law and implies conservation of the power at each node (after adding losses on the transmission lines for the transferred power) for each time period.
• Generation Dispatch Constraints:
Gicbt≤
X
t0∈T :t0≤t
CapGict0Xict0 ∀i ∈ N, c ∈ C, b ∈ B, t ∈ T (3.3)
X i∈N Dibt ≤ X i∈N X c∈C X t0∈T :t0≤t
CapGict0Xict0 ∀b ∈ B, t ∈ T (3.4)
Constraint (3.3) states that generation amount in node i, at load block b, at period t cannot exceed the possible generation amount that could be produced from all of the generation units located at node i until time period t. Constraint (3.4) guarantees that the total generation capacity is greater than the total de-mand in the power system for each load block and time period. We note that, Constraint (3.4) can be considered as a valid inequality and can be safely removed
from the model. However, we keep it in our model, as preliminary computational studies presented better computational quality with this constraint.
• Substation-Related Constraints: X e∈E|Ψ+(e)=i X a∈A (1 + efa)|feabt| ≤ X s∈S X t0∈T :t0≤t
CapSsKist0 ∀i ∈ N, b ∈ B, t ∈ T (3.5)
X e∈E|Ψ−(e)=i X a∈A |feabt| ≤X s∈S X t0∈T :t0≤t
CapSsKist0 + Dibt(1 − Kit)
∀i ∈ N, b ∈ B, t ∈ T (3.6) Xict ≤ Kit ∀i ∈ N, c ∈ C, t ∈ T (3.7) Kit≤ X s∈S X t0∈T :t0≤t Kist0 ∀i ∈ N, t ∈ T (3.8) Kist≤ Kit ∀i ∈ N, s ∈ S, t ∈ T (3.9) Kit-1≤ Kit ∀i ∈ N, t ∈ T (3.10)
Constraints (3.5) and (3.6) limit the total flow leaving from and entering to the substation node or generation node i with the capacity of the substations located at that node, respectively. Constraints (3.7) and (3.8) satisfy that if a generation plant is built at node i, at least one step-up substation should also be built at the same node. Constraint (3.9) guarantees that Kit should be 1 if there
is at least one substation unit at node i at period t. Constraint (3.10) couples time units for substations.
• Network Constraints:
− CapLaZeabt≤ (1 + efa)feabt≤ CapLaZeabt ∀e ∈ E, a ∈ A, b ∈ B, t ∈ T (3.11)
feabt= ϕeaZeabt(θibt− θjbt) ∀e ∈ E, a ∈ A, b ∈ B, t ∈ T (3.12)
Zeabt≤ Leat ∀e ∈ E, a ∈ A, b ∈ B, t ∈ T (3.13)
Leat-1≤ Leat ∀e ∈ E, a ∈ A, b ∈ B, t ∈ T (3.14)
Constraint (3.11) is the capacity constraint for the transmission lines. Con-straint (3.12) represents the power flow conCon-straints based upon the Kirchhoff’s