Contents lists available atScienceDirect
Ultrasonics - Sonochemistry
journal homepage:www.elsevier.com/locate/ultsonDetermination of the e
ffect of high energy ultrasound application in
tempering on
flour quality of wheat
Y. Yüksel
a,⁎∗, A. Elgün
baDepartment of Food Engineering, Engineering Faculty, Balıkesir University, Balıkesir, Turkey
bDepartment of Food Engineering, Faculty of Engineering and Natural Sciences, Istanbul Sabahattin Zaim University,İstanbul, Turkey
A R T I C L E I N F O Keywords:
Hard wheat, Bezostaya-1 Tempering Ultrasound application Milling quality Flour quality Baking quality A B S T R A C T
This research has been carried out under laboratory conditions. To determine the effect of soaking with ultra-sound application to dampen hard wheat samples at one stage in tempering process was the prior goal. In the experiments, Bezostaya-1 wheat samples in different hardness levels (45, 65 and 75%) are used as material. The milling quality and qualitative properties of theflour were investigated. Results compared with the classic tempering process which has two stages tempering for hard and semi-hard wheat at the industrial applications. Ultrasonication of the samples has been applied by a probe-type ultrasound device. Because of experimental deviations, inevitable positive effect of ultrasonic tempering had not seen in the quality parameters of milling experiments likeflour yield and energy consumption. But tempering with ultrasound application increased the speed of water intake and diffusion into the grain center. In the study, the wet gluten rates of the flour obtained by classical tempering process were 24.52% and the gluten index rate was 87.17%, while the results obtained by ultrasonic tempering were 22.70% and 93.33%, respectively. Thus it raisedflour quality a little, possibly, due to low amount but better quality gluten coming from central endosperm in theflour obtained. Other analysis results inflour showed significant differences in some values of classical and ultrasonic tempering processes. As a result of ultrasonic tempering, thefineness rate (granulation) increased from 73.27% to 79.77%, ash content decreased from 0.61% to 0.55%, Zeleny sedimentation value decreased from 25.0 mL to 23.67 mL,flour stability increased from 9.76 min to 12.06 min, water absorption 59.1% decreased from 61.28%, softening resistance increased from 400.33 BU to 504.50 BU, maximum resistance increased from 420.50 BU to 536.16 BU. In bread trials, bread volume increased from 328.3 mL to 347.3 mL, and specific volume increased from 2.39 mL / g to 2.57 mL / g. These issues have been confirmed by some analysis such as fine granulation, low ash content, high gluten index, some farinogram, and extensigram properties, andfinally better performance in bread making was observed.
1. Introduction
Considering today's needs, qualitative specifications of wheat and flour have great importance in providing quality of the final product [1–8]. Therefore, the selection of raw materials with its quality factors and milling technology applied to be looked for inflour specification. One of the important steps in milling operations is tempering which helps the separation of endosperm from the bran layers and to make easy grinding[9–11].
Tempering operation provides an increment in grinding quality and makes the physical structure of wheat kernel more suitable for grinding. Thus, optimum water level is supplied to kernel and it is rested for a while in tempering silos. The water given to wheat kernel during tempering operations, enters in, and diffused into the center of kernel
during resting time[12,13,14]. Tempering is one of the important op-erations which decrease energy consumption while increaseflour yield and especiallyflour quality in the flour milling industry[15]. There are some different factors, affecting tempering quality positively in the milling technologies. The most important ones of them are the quantity and temperature of tempering water and also the tempering time and mechanical factors like mixing, vibration and scraping[9,16–18].
Ultrasound operation is widely used in the food industry[19–41]. In grain operation, there is a highly limited application area. It can be used in drying and sieving operations[33,41–54]. It is used in malt pro-duction to decrease the soaking process and germination time[55–59]. The use of low energy in MHz range, high-frequency ultrasound and high energy, low frequency in kHz range has been subject to research and development for many years[60–67]. There are literature on the
https://doi.org/10.1016/j.ultsonch.2020.105129
Received 14 February 2020; Received in revised form 3 April 2020; Accepted 9 April 2020
⁎Corresponding author.
E-mail address:[email protected](Y. Yüksel).
Available online 13 April 2020
1350-4177/ © 2020 Elsevier B.V. All rights reserved.
fact that the ultrasound technique is used to affect enzymatic activity, to increase yield in the production of corn rice starch and to shorten steeping time steeping of legumes with the effect of cavitation [39,68–75]. There has been no source on the use of ultrasound appli-cations in tempering process offlour milling.
The effect of high and low energy sonication operation on protein structure of wheat was examined by Singh and McRat[76]using probe-type ultrasound equipment. Low energy sonication application in-creased gluten in sulfhydryl content in solution. There was a decrease in sulfhydryl groups in gluten solution during high energy sonication ap-plications. High energy sonication led to the formation of new disulfide bonds with an association of free cysteine molecules in gluten protein. In this research, it is estimated that the soaking operation with an ultrasound application can be effective in tempering operation in flour milling, as it leads to an increase in mass transfer [37,77–80]. and damage to anatomic layers of wheat kernel, increasing the endosperm and bran separation in milling effectively. Therefore, it is aimed to shorten tempering time, increase the effect of tempering operation, decrease investment, maintenance and workmanship expenses inflour milling mechanization and increase in milling quality.
2. Materials and methods 2.1. Materials
In this study, the Bezostaya-1 wheat sample at different hardness levels is used as materials, which were received from Afyonkarahisar market. At the preparation of the samples, the material cleaned from foreign material and homogenized. Sieves, having diameters between 2.25 and 3.5 mm, are used to remove the extreme sized kernels. To obtain different hardness degrees at the samples, the material was ca-librated according to the Grobecker section test, to 45, 65 and 75% kernel hardness levels. The chemical and physical properties of wheat of different hardness used in the study are given inTable 1.
In the tempering process, the water at medium hardness (120 ppm) was used for dampening. In ultrasound application, prob type GEX-600 Ultrasonic processor equipment, working at 20 kHz frequency and 600 W power was used. Trials were conducted in two steps. In thefirst step, analytic quality specifications of material were detected (Table 1) and with pretesting the optimization of operational parameters was supplied; in second steps, the studies on the effects of ultrasonication on the quality parameters were obtained. All tempering operations made away by using optimum operational parameters (100% amplitude, one minute soaking time, 24 h rest time). In this context, firstly, milling properties were determined according to the experimental design of “three kernel hardness (45, 65, and 75%), two tempering methods (classic and ultrasound applied” for two replication according to the factorial plan of“(3x2)x2”. And the all sample combinations obtained
were conditioned for 24 h and milled at standard conditions. Then the flour samples obtained were rested for 3 weeks for maturation, after-ward their physical, chemical and technological specifications were examined.
2.2. Methods
Kernel size and homogeneity, hectoliter weight (kg/hL) thousand kernel weight (g) and hardness (%) determinations were done ac-cording to Pomeranz Y (1988) and Elgün et al (2005) for three wheat samples, used as materials[14,81,82]. Color values of wheat samples, flours, and bread were measured as L*value [(0) black to (1 0 0) white], a* value [(+) red, (-) green] and b* value [(+) yellow to (-) blue], using Konika-Minolta CR-400 (Kornica Minolta Sensingg Inc, Osaka, Japan), in L*, a* and b* values[83]. Moisture, protein and ash quantity determinations were done for wheat and flour samples. The water amount was calculated with AACC 44–19 method. Protein determina-tion of these samples was conducted by the Kjeldahl method (AACC 46–12), and ash determination was performed according to ICC Stan-dard No. 104/1 method [84]. The results were given based on dry matter. Zeleny sedimentation was conducted according to AACC Method 56–60, gluten determination was conducted according to AACC 38–12 [85], falling number value was conducted according to AACC 56–816 [86]. Tempering of the samples was applied to manually cleaned wheat samples with dampening and resting operations under laboratory conditions. In dampening, the soaking method was con-ducted by waiting for wheat samples in water for a certain time. Two different soaking methods as “ultrasonic method” and “classic method” without US application were used. Within this context, wet gluten amount, gluten index, Zeleny sedimentation test, and falling number were determined[84,85,87,88]. For wet gluten amount and index test (AACC 38–12) determinations, Glutomatic-2200 wash machine and centrifuge system devices were used[89]. Farinogram specifications of flour samples, obtained according to experimental designs, were de-termined according to ICC Standard Method No 115/1, extensigram specification of them were determined according to ICC Standard Method No: 114/1[84]. Bread was made by modifying the method given by AACC 10–10[85]. The ingredients were kneaded until mature dough was obtained (Hobart N50, Canada) and rested at 30 °C and 80–90% relative humidity for 50 min and baked at 230 °C for 25 min (Arçelik, ARMD 580, Turkey). After the loaves come out of the oven and cool down, their weights and volumes were measured and after an hour they were put into polyethylene bags and sealed. For other bread spe-cifications, sealed bread in polyethylene bags was held for 24 h at room temperature. Color measurement of bread crust and the crumb was done by Hunter colorimeter, measuring L*, a* and b* values[83].
Table 1
Chemical and physical properties of wheat of different hardness.
Kernel Hardness (%) Some Chemical properties
Moisture (%) Ash (%) Protein (%)3 Zeleny sedimentation (mL) Wet gluten (%) Falling Number (s)
45 9.6 1.77 11.3 20 20.0 341
65 10.3 1.79 11.9 25 22.9 377
75 9.4 1.84 13.1 30 30.6 380
Kernel Hardness (%) Some Physical properties
Color Hectoliter weight (kg/hL) Thousand kernels weight (g) Kernel homogeneity (%)
L* a* b*
45 50.7 7.9 19.9 80.2 38.7 97.85
65 50.5 8.5 19.7 80.67 36.74 97.3
2.3. Statistical analyses
The data obtained during the experiments were subjected to var-iance analysis and the mean of statistically important main variation sources was compared with Duncan’s multiple Range Test. The results of statistical analysis were summarized in tables; statistically important interactions were discussed on figures [90]. TARIST test assessment packet (Version 4.0) computer program was used for statistical ana-lyses.
3. Experimental results
3.1. The effect of the time of soaking with ultrasound application in tempering on the milling andflour quality of wheat
The data obtained in the research subjected to analysis of variance (ANOVA) and the results important at a statistically significant level (P < 0.05) evaluated and discussed below:
3.1.1. Flour yield
The results of the analysis of variance (ANOVA) showed that“kernel hardness” and “soaking time” were significantly effective on flour yield (Table 2). While increasing kernel hardness increased theflour yield as expected, but increasing soaking time decreased the yield due to ex-cessive water derived from longer application times. Ultrasound (US) application stayed ineffective on flour yield because of experimental deviations as a result of the milling studies with small samples on lab mill and the significant two-way interactions at P < 0.01 level. Pos-sibly, the expected difference in flour yields due to effect of US appli-cation was covered by the‘‘kernel hardness × tempering method’’ and ‘‘tempering method × soaking time” interactions. In both tempering methods, 30 s soaking time with US application for the all hardness level was the most suitable time to get optimum water absorption needed for tempering.
3.1.2. Flourfineness
As seen inTable 2, under 140-µm sub sieve material of the flour samples was not significantly affected (P < 0.05) by all main variation sources. There is an increment inflour fineness together with soaking interval a little bit but not significantly (P < 0.05). Descriptively, there is a meaningful difference between both tempering methods. Ultrasonic tempering (87.30%) showedfiner flour granulation than that of classic one (84.77) as seen inTable 2.
3.1.3. Flour moisture
Flour moisture is an important factor not only for the water im-migration into the kernel but also at the immediateflour yield just after the milling operations as milling yield. As a result of ANOVA, flour moisture content was not influenced by the US tempering method
significantly (P < 0.05). The optimum moisture needed for tempering at all hardness grades, including 75%, was provided for 30 s. The higher soaking time will cause highflour moisture, but low flour yield and ash amount. It shouldn’t be ignored that high tempering water decreases flour yield together with ash amount (Table 2)[17].
3.1.4. Flour ash
Inflour milling, flour ash amount is a very important parameter for milling quality [91]. The results of ANOVA showed that all factors treated were not significantly effective on flour ash level (P < 0.05). As a result, there is no difference between the two methods in flour ash amount indicating the same tempering,flour and milling quality. Pos-sibly, the US tempering method with 30 s soaking time could give a flour with lower ash than that of classic one (Table 2).
3.1.5. Wet gluten amount and gluten index
Inflour milling and baking science, flour wet gluten amount and gluten index are very important parameters in the estimation of wheat andflour quality[46]. The results of ANOVA showed that all factors treated were not effective on both quality parameters (P < 0.05). As a result, there is no difference between the two methods in flour quality indicating at least the same tempering,flour milling performance and baking quality. As a result of the descriptive assessment, possibly the US tempering method with 30 s soaking time could give aflour with a little bit lower wet gluten but with a higher gluten index than those of classic ones (Table 2).
These results showed that hard wheat kernel samples could take up the water enough in 30 s soaking interval at only one stage in dam-pening and also not different than those of classic tempering method with two stages. There is no difference between two methods in milling performance as seen in the yield, water amount and granule size of flour. Possibly US tempering method gave a flour with finer granulation than the classic one (Table 2).
3.2. The effect of soaking with ultrasound application in the tempering of wheat on milling andflour quality
These data about the milling quality of the samples were obtained with optimum US tempering conditions with 30 s soaking time. According to the results of ANOVA, the significant main variation sources subjected to Duncan’s multiple range test (P < 0.05). The results are summarized inTable 3.
3.3. The effect of the soaking with ultrasound application in tempering of wheat on milling quality
3.3.1. Flour yield
According to ANOVA results, it is determined that kernel hardness and tempering methods have no significant effect on flour yield Table 2
The Changes of Qualitative Properties of The Flour Dampened Different Soaking Times by Classic and Ultrasonic Tempering Methods1.
Variation Flour Yield Granule Fineness2 Flour Moisture Flour Ash3 Wet Gluten Gluten index
Sources (%) (%) (%) (%) (%) (%) Kernel Hardness 45% 68.960b± 0,58 86.117a± 2,8 15.867ab± 0,37 0.569a± 0,01 24.717b± 0,6 92.917a± 3,6 65% 69.105b± 0,95 86.225a± 2,4 16.125a± 0,33 0.580a± 0,01 25.650b± 1,5 92.667a± 3,9 75% 70.280a± 0,82 85.767a± 2,5 15.708b± 0,38 0.573a± 0,01 33.650a± 1,1 83.417b± 3,8 TemperingMethod Classic 69.406a± 1,1 84.772a± 2,2 15.789a± 0,4 0.577a± 0,01 28.228a± 4,2 87.333b± 5,9 Ultrasonic 69.491a± 0,8 87.300a± 2,3 16.011a± 0,3 0.571a± 0,01 27.783a± 4,3 92.000a± 4,7 Soakig Time 30 s 69.898a± 1,2 85.425a± 2,4 15.683b± 0,3 0.569a± 0,01 28.083a± 4,5 88.250a± 5,5 45 s 69.214b± 0,8 86.425a± 3,1 15.883ab± 0,3 0.577a± 0,01 28.433a± 4,5 90.083a± 6,0 60 s 69.233b± 0,6 86.258a± 2,0 16.133a± 0,2 0.576a± 0,01 27.500a± 3,8 90.667a± 6,0
statistically (Table 3), just as thefirst study performed before (Table 2). In addition, the ultrasonic tempering method (68.38%) gave a little moreflour yield than that of ultrasonic one (67.81%). It is expected that at industrial conditions this little difference may cause a reasonable increase inflour yield.
3.3.2. Flour granulefineness
Fine granulation without starch damage of wheatflour is a good parameter that has been used to estimation of milling quality[92,93]. ANOVA results show the significant effect of the all variation sources at P < 0.05 significance. Averages of granular fineness values of the flours were compared by Duncan’s multiple range test. As seen in Table 2, kernel hardness and tempering method caused to change in the granule size offlour. Granule fineness increased together with the US application in soaking. As shown inFig. 1, according to the‘‘Kernel hardness × Tempering method“ interaction there is a positive effect of US application in tempering process with 30 s soaking. It was more effective for 45 and 65% hardness levels but not for 75%. Possibly this favorable effect is covered by the deficient tempering water or US ap-plication time used for soaking for the sample with 75% hardness.
The soaking with ultrasound application speeds up water im-migration into kernel and pixelization of the endosperm was ac-celerated. Thus, thefineness of flour was increased by US tempering and possibly,fine granulation caused to light color appearance. 3.3.3. Flour color
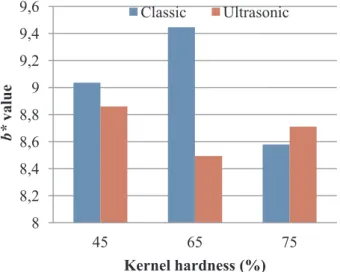
The results of ANOVA showed some good results about the effect of US application in the tempering process (P < 0.05). According to Duncan’s multiple range test results (Table 3), As kernel hardness in-creased from 45 to 65%, L* and b* values did not change siginificantly. However, at 75% kernel hardness L* and b* values decreased sig-nificantly. Redness of the flour was not significanlty affected by the kernel hardness. The decreasing trend of the redness and yellowness with the increasing of kernel hardness to 75% could cause the in-creasing offlour whiteness. (P < 0.05). Thus US application in soaking for 30 s gave theflour with more bright and white than those of classic methods (Table 3).
According to the results of ANOVA,‘‘kernel hardness × tempering method” interaction was found statistically significant (P < 0.01) on yellow color intensity (b* value) offlour. In the going of this interaction given in Fig. 2., 30 min soaking time with US application in the
Table 3 The Changes in Qualitative Properties of the Flour Obtained by Classic and Ultrasonic Tempering Methods 1. Flour Wet Gluten Zeleny Falling Variation Yield Fineness 2 Color Moisture Ash 3 Protein 4 gluten index Sedim. number Sources (%) (%) L* a* b* (%) (%) (%) (%) (%) (mL) (s) Kernel Hardness (%) 45 68.15 a± 0,75 76.83 ab ± 2,39 95.52 a± 0,56 − 0.22 a± 0,10 8.95 a± 0,20 16.52 a± 0,46 0.593 a± 0,04 8.30 c± 0,26 19.68 b± 0,67 93.00 a± 5,59 19.50 c± 0,57 346.25 b± 8,34 65 68.28 a± 0,50 71.68 b± 11,27 95.50 a± 0,31 − 0.27 a± 0,17 8.97 a± 0,55 16.56 a± 0,68 0.588 a± 0,01 8.86 b± 0,40 20.43 b± 2,94 94.75 a± 5,85 23.50 b± 1,73 376.25 a± 2,21 75 67.88 a± 0,63 81.05 a± 1,00 94.34 b± 0,69 − 0.20 a± 0,07 8.64 b± 0,14 15.64 b± 0,32 0.565 a± 0,05 11.80 a± 0,30 30.73 a± 0,25 83.00 b± 3,36 30.00 a± 0,00 381.50 a± 5,19 Tempering Method Classic 67.82 a± 0,50 73.27 a± 9,36 94.79 a± 0,63 − 0.27 a± 0,12 9.02 a± 0,40 15.88 a± 0,38 0.613 a± 0,01 9.74 a± 1,76 24.52 a± 4,90 87.17 a± 6,96 25.00 a± 4,47 365.67 a± 19,61 Ultrasonic 68.39 a± 0,59 79.77 a± 1,58 95.45 a± 0,77 − 0.18 a± 0,10 8.69 b± 0,19 16.59 a± 0,67 0.550 b± 0,02 9.57 a± 1,64 22.70 b± 6,36 93.33 a± 6,25 23.67 b± 5,08 370.33 a± 15,55 1 The means with the same letter are not signi fi cantly di ff erent (P < 0.05), 2fl our under140µ sieve, 3:Based on dry matter, 4Based on dry matter and Protein: with N*5.7
0
10
20
30
40
50
60
70
80
90
45
65
75
G
ra
nule Fineness
(%)
Kernel hardness (%)
Classic
Ultrasonic
Fig. 1. The effect of ultrasound application in tempering on granule fineness (< 140µ) offlour as a result of ‘‘Kernel hardness × Tempering method” in-teraction in granulefineness.
tempering process gave the best physical structure to the kernel with 65% hardness for the milling operation. Presumably, while the water amount is more than needed to temper the kernel with 45% hardness, it is not enough to the kernel with 75% hardness. Thesefindings showed to be a relationship between kernel hardness and soaking time with US application in tempering like the same as that in classical tempering. It is well-known that kernel hardness and resting time interval is more effective factors in the amount of water given and the resting time in-terval of the tempering process.
Together with a more effective tempering process, finer, whiter and brighterflour was obtained. There is literature information about the fact that granular and coarse-grained flours have a yellow color ap-pearance, in contrast to fine granulated ones have white and bright color[14,17,92,94,95].
3.4. The effect of ultrasound application in dampening of wheat on some chemical properties offlour
These data about theflour qualities were obtained with optimum US tempering conditions with 30 s soaking time. According to the results of ANOVA, the significant main variation sources subjected to Duncan’s comparison test (P < 0.05) and the results are summarized inTable 3. 3.4.1. Moisture amount
According to ANOVA results, it is determined that both “Kernel Hardness” and “Tempering Method” have statistically significant effect (P < 0.01) on moisture amount of flour after three weeks rest fol-lowing milling process. In the results of Duncan’s multiple range test (Table 3), it was seen that the moisture amount offlour suddenly fell in flour at 75% kernel hardness. This data may be proof of the fact that the water can't be absorbed enough and not immigrate into central en-dosperm within 24 h rest time in the tempering process. This event is also a possible cause of the poor temper of samples with 75% kernel hardness as being discussed before in milling quality. The effect of tempering method on the moisture amount of flour was shown dia-grammatically inFig. 4. It shows that the ultrasonic tempering method caused more water immigration into and to save water in endosperm also inflour versus to that of classic one. This situation shows that the water reached to central endosperm up to thin cell walls was kept inside the kernel easily. Also, the loss of water by evaporation from outer layers decreases during the rest time of the tempering process [14,16,17,93]. As a result, US application in dampening possibly will cause to better events than those of classic one in water absorption and immigration into kernel and in the tempering of wheat, not only in time
and investment saving but also an increase in milling andflour quality even though with higherflour moisture after three weeks aging time (Table 3).
3.4.2. Ash amount
Ash amount offlour plays an important role to achieve well-raised bread. In bread obtained fromflour with high ash content, the volume increase is not at the desired level.[96,97]. As the amount of ash in the flour increases, the ability to hold gas in the bread dough decreases. [96,98]. The ANOVA results showed that only“Tempering method” has statistically significant effect (P < 0.01) on ash amount of flour. The results of the Duncan test are shown inTable 3. While the average ash amount, obtained by classical tempering was 0.61%, it was decreased to 0.55% by the tempering with ultrasound application. According to this result, it could be stated that ultrasound application in the soaking phase of tempering could positively affect the tempering process by increasing temper effect and flour fineness together with its parity. As a result, at stable milling conditions, US tempering method gave better results than those of classic one, while decreasing the ash amount of
8
8,2
8,4
8,6
8,8
9
9,2
9,4
9,6
45
65
75
b*
value
Kernel hardness (%)
Classic
Ultrasonic
Fig. 2. The going of“Kernel hardness × Tempering method” interaction in b* values.
0
5
10
15
20
25
30
35
45
65
75
Wet G
luten
(%)
Kernel hardness (%)
Classic
Ultrasonic
Fig. 3. The going of“Kernel hardness × Tempering method” interaction in wet gluten.
0
1
2
3
4
5
6
7
8
9
10
45
65
75
Dev
elo
pm
ent Tim
e
(m
in)
Kernel Hardness (%)
Classic
Ultrasonic
Fig. 4. The going of“Kernel Hardness × Tempering Method” Interaction in development time.
flour, increased the flour fineness. This phenomenon can be considered as a measure of increasing flour yield and milling efficiency for the same ash level in industrial conditions[17,93].
3.4.3. Protein amount
ANOVA results showed that the tempering method did not affect the protein amount offlour. When it is descriptively considered, there is a little decrease in the protein amount obtained by tempering with ul-trasound application (9.573%) versus that of classic one (9.738%) (Table 3). According to ANOVA results, the effect of “Kernel Hardness” on protein amount was considered as statistically significant (P < 0.01). There is a positive relationship between kernel hardness and protein amount in some wheat cultivars[1]. As seen inTable 3, protein amounts offlour increased with the proportion of 8.30%, 8.86% and 11.80%, as the wheat hardness of samples increased. Thus, it is an estimated result that protein amounts of wheat samples increase, when their hardness increases.
Possibly, the applications decreasingflour ash amount in the tem-pering and milling processes also decreased the protein amount [17,93,99]. Because US application led to increasing someflour coming from central endosperm having less intensive but good quality proteins. It can be said that this situation will reflect on flour quality positively. 3.5. The effect of the soaking with ultrasound application in the tempering of wheat on some technological properties offlour
According to the results of ANOVA, the significant main variation sources subjected to Duncan’s multiple range test (P < 0.05) and the results are summarized inTable 3. Wet gluten, gluten index and Zeleny sedimentation and falling number test results and their discussions are expressed as below.
3.5.1. Wet gluten amount
One of the most practical and easy methods to determine the quality offlour is wet gluten[82,100]. Gluten is responsible proteins for the dough formation of proteins. They affect rheological specifications of dough in the mixing and fermentation processes. It is very important for the bread industry in terms of estimation of rheological specifications such as flexibility, viscosity, extension ability[100,101]. As seen in Table 3, wet gluten amount increased, as kernel hardness increased. As the kernel hardness increases in the same wheat varieties, the amount of total protein and wet gluten generally increase [14,95,102,103]. Effects of tempering method on wet gluten were not statistically sig-nificant, possibly due to “Kernel Hardness × Tempering method” has a statistically significant effect on wet gluten amount (P < 0.01). But with a descriptive view, US application decreased gluten amount a little, as seen in thefirst study (Table 2). ANOVA results showed that the interaction of “Kernel Hardness × Tempering method” has sig-nificantly effect on wet gluten amount (P < 0.01). This interaction is given inFig. 3, diagrammatically. This demonstration clearly shows the increase in wet gluten in wet gluten amount as kernel hardness of wheat sample increases, but being to be a little less for ultrasonic tempering than that of classic one especially for 45 and 65% hardness degrees. Here, it can be said that tempering with ultrasound application supplies flour having lower but high-quality protein from central endosperm [14], depending on water penetration depth into the endosperm by the effect of ultrasonication. Otherwise, it can be said what process causes physical changes in its structure during US application and loss of protein in wet gluten washing, especially for the lower hardness levels, not for 75% hardness level.
3.5.2. Gluten index
ANOVA results showed that only kernel hardness had significant effect on gluten index values at P < 0.05 level as being expected. But there was no significant effect of tempering method on the gluten index. As seen on the results of Duncan multiple comparison test (Table 3),
descriptively shown that, on the contrary to wet gluten amount, gluten index showed a little increase with US application, despite decrease in wet gluten amount. This phenomenon shows to be the increase inflour quality with the aid of US application in the tempering or the source of good quality proteins coming from the central endosperm (Table 3). 3.5.3. Zeleny sedimentation test
One of the very important parameters used to determine the wheat quality is Zeleny sedimentation test. It is considered as a criterion of protein amount and quality[82,104,105]. It was determined that the effects of kernel hardness and tempering method on Zeleny sedi-mentation value were significant. Duncan’s multiple range test results showed that Zeleny sedimentation values increased considerably, while kernel hardness values of wheat samples increased. On the contrary, tempering with US applications decreased Zeleny sedimentation value like wet gluten. We need to glance at the physical and chemical spe-cifications of wheat flours, obtained by tempering with ultrasound application. Possibly as a result of US application and better tempering, theflour coming from central endosperm increased and caused flour with lower but better quality protein, and alsofiner but lower starch damage at theflour below 140-µm granulation (Fig. 1). The interaction of “Kernel Hardness × Tempering Method”, which was effective on Zeleny sedimentation values, was the same as on wet gluten as seen in Fig. 3. The same decrease was seen in the amount of ash and protein amounts, and wet gluten values. The decreasing of protein amount together with wet gluten and Zeleny sedimentation value were esti-mated results. Low starch damage andfine flour structure in granular structure, to which ultrasound application led, affected the decrease in Zeleny sedimentation value. This structural specification caused to in-crease in falling numbers. On the other side, the dein-crease in protein and ash amounts showed that theflour obtained by tempering with ultra-sound applications comes from the central endosperm. These results may reflect wet gluten amount, as well as Zeleny sedimentation value [14,17].
3.5.4. Falling number
Falling number is an indicator of amylolytic activity. Falling number is considerably affected by the existence of kernel’s amylase enzymes and damaged st amount offlour. In hard wheats, amylolytic activity is lower[82,93,105,106]. ANOVA results showed that the effect of kernel hardness proportion on the falling number was statistically important. According to Duncan's multiple comparison test results, falling number values increased as the kernel hardness of wheat samples increased (Table 3). Namely, amylolytic activity falls the contrary to an increase in kernel hardness[14,93,105–107].
Again, according to Duncan multiple comparison test results, tem-pering with ultrasound application led to an increase in falling number in comparison to classical one descriptively. We can explain this si-tuation with the fact that ultrasound application increases the propor-tion of central endosperm parts inflour with the low enzyme activity and starch damage as a result of better tempering conditions. 3.6. The effect of ultrasound application in the tempering of wheat on rheological properties of dough
3.6.1. Farinograph experiments
3.6.1.1. Water absorption. According to ANOVA belonging to water absorption values of flour samples, it is determined that ‘‘Kernel Hardness” and ‘‘Tempering Method” variation sources have significant effect on water absorption. According to Duncan’s multiple range test results (Table 4), water absorption values, especially in 75% hardness degree, increased together with the kernel hardness. This increment can be explained with the increase in wet gluten and protein amounts [14,95,102]. On the contrary, tempering with ultrasound application led to a decrease in water absorption values, in comparison to the classical one. There is a nearly 2.17% decrease.
Possibly, due to low protein amount coming from central endosperm as a result of goo tempering in comparison to that of classic one (Table 3) as discussed before for the wet gluten and Zeleny values.
3.6.1.2. Development time. According to ANOVA results, it was determined that ‘‘Kernel Harness’’ at P < 0.01 level, also ‘‘Kernel Hardness × Tempering Operation’’ interaction at P < 0.05 level have statistically affected dough development time. According to Duncan’s multiple range test, dough development time increased as kernel hardness of wheat samples increase as being expected[14,82,88,108]. According to diagrammatic change, as seen inFig. 4, the samples at 75% kernel hardness showed an excessive increase in dough develop-ment time, obtained from the flour obtained by tempering with US application, while it was affected contrarily a little in 45% and 65% hardness degrees. This increase for 75% hardness showed parallelism with protein, wet gluten and Zeleny values for tempering method (Fig. 3) due to the same causes discussed before. These results show that at the 75% hardness level, protein amount has a dominant effect on protein quality while at the lower hardness levels, protein quality has dominancy. It can be assumed that hard structural wheat gives more granular structure and more development time as a secondary factor [14,17,108,109,110].
3.6.1.3. Dough stability. According to ANOVA results, ‘‘Kernel Hardness’’ in P < 0.01 level, and ‘‘Tempering Operation’’ in P < 0.05 level have a statistical effect on stability. According to Duncan’s multiple range test results, the dough stability of wheat samples increased together with their hardness degrees (Table 4). These values are respectively determined as 7.2 min, 8.45 min, and 17.1 min. Tempering with US application led to an important increase in dough stability value with 12,067% of farinogram in comparison to that of classical one with 9.767%. This data clearly shows that there is an increase in protein quality since obtained flour which has central endosperm sourced with high-quality protein by US application, even though there is a decrease in protein and wet gluten amount. The same progress was determined in the gluten index value. In protein distribution of sound wheat kernel, high-quality gluten which is important for bread making, takes place in central endosperm. The outer layer of floury endosperm has more intensive but less quality gluten than central zone. Gluten amount decreases towards central endosperm with quality increment[14,17,93,111].
3.6.1.4. Softening degree. According to ANOVA,‘‘Kernel Hardness’’ at P < 0.01 level, interaction of“Kernel Hardness × Tempering Method” at P < 0.05 level, have a statistically significant effect on dough softening degree. As seen in Table 5, Duncan’s multiple range test results clearly showed that as kernel hardness increased, a positive progress in dough softening degree in farinogram was observed, parallel to the increase in protein amount and quality as expected. With a descriptive view, a lower softening degree in farinogram ensued the tempering with US application (46.5 BU) in comparison to that of classical one (50.83 BU). It can be said that tempering with US application increases dough quality as explained in other qualitative developments, in comparison to those of classical one (Fig. 5). InFig. 5, the interaction of “Kernel Hardness × Tempering Process” affects softening temperature (BU). As seen, on contrary to expectations, while dough softening degree would be the least at 75% hardness degree, it increased. The reason of this increase in softening degree for the 75% hardness level may be mechanical ripening of dough as a result of about three times long mixing time for longer dough developing and stability on farinograph than those of both lower hardness levels (Table 4). There is an opposite situation to the lower kernel hardness group in the 75%. This result can be explained with the fact that more granular structuredflour obtained by tempering with US application gets more mechanic ripening of dough during kneading, as we already pointed out in our thesis in previous parts.
Table 4 The Changes in Some Farinogram Properties of The Flour Obtained by Classic and Ultrasonic Tempering Methods as a Results of Duncan ’s Multiple Range Test 1. FARINOGRAM PROPERTIES EXTENSOGRAM PROPERTIES Variation Water absorption Development time Stability Softening degree Energy Resistance to extensibility Extensibility Maximum Resistance Sources N (%) min. min. (BU) (cm 2) (BU) (mm) (BU) Kernel Hardness (%) 45 4 59.075 b± 1,50 1.675 b± 0,23 7.200 c± 3,16 62.750 a± 11,55 50.750 b± 12,55 370.000 b± 129,16 93.250 b± 1,70 370.500 b± 128,89 65 4 59.250 b± 0,54 1.750 b± 0,33 8.450 b± 0,65 34.750 b± 4,19 68.000 a± 7,02 545.000 a± 70,13 101.500 b± 7,72 547.750 a± 71,96 75 4 62.250 a± 1,97 8.450 a± 0,71 17.100 a± 1,40 48.500 ab ± 9,03 87.750 a± 9,74 442.250 ab ± 31,85 126.000 a± 8,52 516.750 a± 40,63 Tempering Method (%) Classic 6 61.283 a± 2,08 3.883 a± 3,13 9.767 b± 5,58 50.833 a± 17,78 62.167 a± 19,25 400.333 b± 110,29 108.000 a± 12,99 420.500 b± 124,07 Ultrasonic 6 59.100 b± 1,32 4.033 a± 3,84 12.067 a± 4,43 46.500 a± 11,22 75.500 a± 15,88 504.500 a± 85,25 105.833 a± 19,33 536.167 a± 70,58 1 The means with the same letter are not signi fi cantly di ff erent (P < 0.05)
3.6.2. Extensigraph experiments
3.6.2.1. Energy. According to ANOVA results, “Kernel Hardness” at P < 0.01 level and“Tempering Method” at P < 0.05 level have a statistical significant effect on the dough energy value. Duncan multiple range test results show that extensigram energy values increased, as kernel hardness of wheat samples increase. As expected increasing protein amount and quality together with hardness, enhanced energy value too. Theflours that are obtained by the tempering method with US application from Bezostaya-1 samples, gave an increment in extensigram energy values in comparison to that of the classical one. InTable 4positive effect of US tempering on dough energy values is shown clearly. When it is considered that extensigram energy values are a criterion to estimate protein amount and quality, the assumed facts for an increase in dough stability in farinograph and decrease in softening degree (Table 4) together with the increase in gluten index (Table 3) are valid for the change of energy value as well. In other words, we can say that US application in tempering process while causing a decrease in protein amount, increased the quality of protein coming from the central endosperm. As a result (Table 3 and 4), it can be concluded that bread quality will increase in concur with energy value increases [14,82,97,112] and accordingly, crumb texture gets better [14,17,112]. Hereby, it can be said that a mechanic ripening based on the granular structure of too hard wheat flours is more effective in the kneading process.
3.6.2.2. Resistance to extensibility. According to ANOVA results,“Kernel Hardness”, “Tempering Method” and the interaction of “Kernel
Hardness × Tempering Method” have a statistically important effect on dough resistance to extensibility at P < 0.01 level. According to the interaction of “Kernel Hardness × Tempering Method”, while the dough resistance obtained by classical tempering was 400.33 BU; the value obtained by tempering with US application increased to 504.50 BU. The interaction of the“Kernel Hardness × Tempering Method”, which had significant effect on dough resistance is given inFig. 6. Here, there was a decrease in 75% hardness, while there was an increase in both wheat samples with 45 and 65% hardness. Tempering with US application increased the dough resistance of the samples with 45 and 65% hardness degree due to theflour coming from central endosperm with lower proteolytic activity and higher protein quality than those from the peripheral endosperm. The same situation didn’t occur in 75% hardness degree, on the contrary, dough resistance decreased a little. Hereby, it can be said that a mechanic ripening based on the granular structure of too hard wheatflours is more effective in the kneading process.
3.6.2.3. Dough extensibility. ANOVA results belonging to dough extensibility data showed that wheat kernel hardness is statistically effective (P < 0.01). Duncan’s multiple range test results showed that dough extensibility values increased together with resistance values, as the hardness values increased. These increases inboth dough resistance and extensibility positively reflected on dough energy values (Table 4). The effect of kernel hardness on dough extensibility is given inTable 5. Here, it can be said that the amounts of protein and wet gluten increasing with kernel hardness, positively affected the dough extensibility. But on contrary to this US application in tempering did Table 5
The Changes in Some External and Internal Bread Properties of The Flour Obtained by Classic and Ultrasonic Tempering Methods as a Results of Duncan’s Multiple Range Test1.
Variation Loafvolume Spesificvolume Crust color Crumb color
Sources N (mL) (mL/g) L* a* b* L* a* b* Kernel Hardness (%) 45 4 326.5a± 19,07 2.367a± 0,15 56.808a± 2,28 14.328a± 0,91 27.190a± 0,79 65.373a± 0,72 2.095ab± 0,38 10.883a± 5,45 65 4 333.0a± 15,18 2.455a± 0,16 58.385a± 1,75 14.215a± 1,15 24.983a± 7,50 63.623a± 2,71 2.007b± 0,27 12.907a± 0,89 75 4 354.0a± 28,23 2.635a± 0,17 58.802a± 4,38 13.970a± 1,59 32.430a± 1,54 66.413a± 1,65 2.782a± 0,55 13.000a± 1,18 Tempering Method (%) Classic 6 328.3a± 19,49 2.397a± 0,15 58.953a± 3,22 14.003a± 1,25 30.123a± 3,15 64.532a± 2,26 2.433a± 0,65 13.633a± 0,99 Ultrasonic 6 347.3a± 23,85 2.575a± 0,19 57.043a± 2,38 14.338a± 1,15 26.278a± 6,33 65.740a± 1,88 2.157a± 0,36 10.893a± 3,99
1The means with the same letter are not significantly different (P < 0.05)
0
10
20
30
40
50
60
70
80
45
65
75
Softening Deg
ree (B
U)
Kernel Hardness (%)
Classic
Ultrasonic
Fig. 5. Interaction of“Kernel Hardness × Tempering Method”, which has effect on softening degree in pharynography.
0
100
200
300
400
500
600
700
45
65
75
Resistance to
Ex
tensibility
(B
U)
Kernel Hardness (%)
Classic
Ultrasonic
Fig. 6. Interaction of“Kernel Hardness × Tempering Operation”, which has effect on resistance (BU) against elongation in extensigraph.
not significantly affect it (Table 4). As a result, the US application in tempering is more effective on dough resistance than those done on dough extensibility. The decreasing effect of US application in tempering on dough extensibility can be explained with the flour is sourced central endosperm, which has more protein strength and low proteolytic enzyme activity[14,113–115].
3.6.2.4. Maximum resistance. According to ANOVA results, the effect of ‘‘Kernel hardness’’ and ‘‘Tempering Method” are found statistically significant at P < 0.01 level. According to Duncan's multiple range test results, maximum resistance values show parallelism with the dough resistance to extensibility (Table 4). Tempering operation with ultrasound application increased maximum resistance value when compared to the classical one. Here, assumed reasons are valid for resistance against elongation as well. Also, the same discussions are valid for the interaction of“Kernel Hardness × Tempering Operation”, found statistically significant in P < 0.01 level.
3.7. The effect of ultrasound application in the tempering process of wheat on bread making properties offlour
3.7.1. Loaf volume
According to ANOVA results, wheat kernel hardness and tempering method do not have a statistically important effect on bread volume due to a significant effect (P < 0.01) of their interaction. However, when Duncan multiple comparison test results are carefully examined, it is seen that bread volume increases with wheat kernel hardness and US application in tempering in comparison to those of classical one (Fig. 7). In Duncan test results, descriptively a qualitative superiority is per-ceived. As seen in“Kernel Hardness × Tempering Method” interaction shown inFig. 5, the increase in average bread volume values has su-periority with increasing kernel hardness, and tempering with US ap-plication especially for 75%. It can be said that tempering with US application of the samples with 75% hardness degree in tempering are affected positively by the rise in gluten index (Table 4), development and stability times, softening degree at farinograph, and dough re-sistance to extensibility at extensigraph on loaf volume of the bread, despite the low protein and wet gluten values than those of classic method (Table 5). On the account of these results, the use of US ap-plications in tempering causes to enhance flour and bread-making quality.
3.7.2. Specific volume
Specific volume of bread is used to estimate the staling tendency of bread. Puhr and D’Appolonia (1991), determined that bread’s specific volume increases depending on water absorption ability [116,117]. Generally, the specific volume increases with protein amount and quality[14,95,118]. This is true for protein amount increasing with kernel hardness, but not for tempering method with US application. It is observed that the effect of ‘‘Kernel Hardness’’ and ‘‘Tempering opera-tion’’ variation sources on specific volume values are not statistically important like those of loaf volume as a result of ANOVA. As seen Duncan multiple comparison test results (Table 5), with a descriptive assessment, specific volume values increased as kernel hardness in-creases, on the other side tempering with US application provided higher specific volume in comparison to the classical one. While the average specific volume value for bread, made from classical tempering applied wheat was 2.397, this value rose to 2.575 in bread made from the US applied samples. Discussions on specific volume changes showed parallelism with loaf volume.
3.7.3. Crust color
It was conducted, measuring L*, a* and b* values of crust and crumb colors. Pinky-redness of crust color and whiteness of crumb are among important quality criteria. ANOVA results show that“Kernel Hardness” and“Tempering Method” variation sources do not have a statistically important effect on L*, a* ve b* values. According to Duncan multiple range test results (Table 5), no meaningful result even descriptive was achieved in L* and a* values. When done a descriptive assessment, the b* values of bread’s crust color increased with increasing kernel hard-ness. Kotancılar et al (2000) expressed that bread’s crust color, made from weak wheatflour, was 10.7, and b* values of bread’s crust color made from strong wheatflour, were 16.6, like our findings for kernel hardness [119]. This increment in yellowness of crust color may be coming from higher yellow pigment intensity or higher starch damage of hard kernel wheat as well known[120–122]. Also, the b* value of the bread crust made from the wheat tempered with US application gave lighter crust color than that of the wheat tempered with the classic method. As a result, US application caused a more pinky crust color. Possibly, due tofiner granulation and less amylolytic activity of flour obtained with US tempering method than those with the classic one. 3.7.4. Crumb color
According to ANOVA results, only“Kernel Hardness” among var-iation sources is found to be a statistically significant effect on a* values of crumb color at P < 0.05 level. It is concluded that results arise from the intensive red color pigmentation of hard wheat than that of soft one [14]. When Duncan multiple comparison test result (Table 5) is de-scriptively examined, it is observed that all color parameters increased together with kernel hardness. Namely, the changes were observed in redness especially in crust color, and yellowness in crumb color values, despite no statistical importance. The increment in kernel hardness caused a more reddish crumb. The tempering with US application provided a whiter crumb color, possibly, due to enhancement inflour quality.
4. Conclusions
This research was conducted to show the effect of tempering with ultrasound (US) application in soaking of wheat having different kernel hardness, on kernel’s water absorption, flour yield and flour and bread-making qualities. The aim of the study at the industrial base, is to re-duction two dampening stages of hard wheat to one in tempering, to decrease dampening time, and to enhance milling and bread-making quality. According to pre experiments test results, 30 s soaking period with US application showed the optimum time to increase water ab-sorption of kernel 16% level for 75% kernel hardness degree. In in-dustrial tempering applications, US application is considered to be more
290
300
310
320
330
340
350
360
370
380
45
65
75
L
oaf volu
m
e
(m
l)
Kernel Hardness (%)
Classic
Ultrasonic
Fig. 7. Effect of “Kernel Hardness × Tempering Method” intraction on loaf volume.
effective in tempering and may drop the dampening time below 20 s for semi-hard wheat kernel hardness. As a result, it is possible to decrease the dampening process from two stages to one. To industrial use, there are needs to develop industrial mechanization, application norms and flow diagram with new extra studies in the future. The flour yield and energy consumption were not affected by soaking with US application for 30 s possibly due to high experimental errors caused by low amount samples used for US application, but on the other side, it caused to increase inflour quality. Tempering with US application increased flour quality, by earning central endosperm sourced material, having flour from central endosperm with high quality but with less intensive gluten, due to deep penetration of water into central endosperm and high efficiency of tempering. These issues are approved by higher gluten index, lower ash amount, thinnerflour granulation; and better dough rheology and ultimately higher bread-making test performance than those of classical tempering method. When it is considered from a scientific point of view, while tempering with US application speeded up water mass transfer into the wheat kernel, it caused to fine pix-elization in central endosperm by cavitations in soaking with US ap-plication and the high speed and more effective tempering during rest time.
As a result, the use of the ultrasonic tempering method instead of classical one will drop the investment classical mechanization and op-erational expenses in milling technology. However, to get down the cost of the US apparatus and to design a new tempering system is the more priority of theflour milling industry.
Declaration of Competing Interest
The authors declare that they have no known competingfinancial interests or personal relationships that could have appeared to in flu-ence the work reported in this paper.
Appendix A. Supplementary data
Supplementary data to this article can be found online athttps:// doi.org/10.1016/j.ultsonch.2020.105129.
References
[1] D.G. Vouris, A. Lazaridou, I.G. Mandala, C.S. Biliaderis, Wheat bread quality
at-tributes using jet millingflour fractions, LWT-Food Sci. Technol. 92 (2018)
540–547.
[2] G. Angelidis, S. Protonotariou, I. Mandala, C.M. Rosell, Jet milling effect on wheat
flour characteristics and starch hydrolysis, J. Food Sci. Technol. 53 (2016)
784–791.
[3] S. Protonotariou, I. Mandala, C.M. Rosell, Jet milling effect on functionality,
quality and in vitro digestibility of whole wheatflour and bread, Food Bioprocess
Technol. 8 (2015) 1319–1329.
[4] S. Protonotariou, A. Drakos, V. Evageliou, C. Ritzoulis, I. Mandala, Sieving
frac-tionation and jet mill micronization affect the functional properties of wheat flour,
J. Food Eng. 134 (2014) 24–29.
[5] E. de la Hera, M. Martinez, M. Gomez, Influence of flour particle size on quality of
gluten-free rice bread, LWT- Food Science and Technology 54 (2013) 199–206.
[6] E. de la Hera, M. Talegon, P. Caballero, M. Gomez, Influence of maize flour
par-ticle size on gluten-free breadmaking, J. Sci. Food Agric. 93 (2013) 924–932.
[7] G.N. Barrera, A.E. Leon, P.D. Ribotta, Effect of damaged starch on wheat starch
thermal behavior, Starch/Starke 64 (2012) 786–793.
[8] Ε.Η. Huttner, F. dal Bello, E.K. Arendt, Rheological properties and bread making
performance of commercial wholegrain oatflours, J. Cereal Sci. 52 (2010) 65–71.
[9] M. Abo-Dief, T. Abo-Bakr, M. Youssef, A. Moustafa, Quality of wheatflour and pan
bread as influenced by the tempering time and milling system, AACCI-Cereals&
Grains Association 96 (2019) 429–438.
[10] K. Ulmer, Technology & equipment grain milling. Müller Swiss Vocation Training
for Grain, Millers Switzerland (2011).
[11] Posner, E. S. Wheatflour milling. In Y. Khan & P. Shewry (Eds.), Wheat chemistry
and technology (2009) 119–152). St. Paul, MN: AACC International.
[12] J. Yoo, B.P. Lamsal, E. Haque, J.M. Faubion, Effect of enzymatic tempering of
wheat kernels on milling and baking per-formance, Cereal Chem. 86 (2009)
122–126.
[13] R. Keskinoğlu, A. Elgün, ve Türker, S, Bir un değirmeninde uygulanan farklı ılık
tavlama işlemlerinin öğütme kalitesine etkisi, Gıda 26 (2001) 419–427.
[14] Pomeranz Y In: Wheat chemistry and technology, vol. 1. American of Association of Cereal Chemists (AACC), St. Paul, MN (1988) U.S.A.
[15] D. Dziki, G.C. Pietrzak, B. Biernacka, K. Jończyk, R. Różyło, B. Gładyszewska, The
grinding energy as an Indicator of wheat milling value, TEKA Commission of
Motorization and Energetics in Agriculture 12 (2012) 29–33.
[16] M. Kweon, R. Martin, E. Souza, Effect of tempering conditions on milling
perfor-mance andflour functionality, Cereal Chem. 86 (2009) 12–17.
[17] Elgün, A. ve Ertugay, Z. Tahıl İşleme Teknolojisi. Atatürk Üni. Ziraat Fakültesi Yayınları No:718 (1995) 411 sayfa, ERZURUM.
[18] Lock Wood, J. Flour Milling. Hanry Simon Limited (1982) England.
[19] F. Chen, M. Zhang, C.H. Yang, Application of ultrasound technology in processing
of ready-to-eat fresh food: A review, Ultrason. Sonochem. 104953 (2019).
[20] Astráin-Redín, L., Raso, J., Condón, S., Cebrián, G., & Álvarez, I. Application of High-Power Ultrasound in the Food Industry. In Sonochemical Reactions. (2019) IntechOpen.
[21] A. Mumtaz, M.S. Ibrahim, N.R. Siddiqui, M.N. Safdar, M. Munir, A. Qayyum,
S. Shibli, M.K. Ibrahim, Ultrasounds: A recent perspective in food industry,
Pakistan Journal of Agricultural Research 32 (2) (2019) 334–342.
[22] B. Khadhraoui, A.S. Fabiano-Tixier, P. Robinet, R. Imbert, F. Chemat, Ultrasound
technology for food processing, preservation, and, Green Food Processing
Techniques: Preservation, Transformation and Extraction (2019) 23.
[23] D. Liu, X. Ma, W. Wang, M. Zou, D. Wang, J. Ling, Research Progress on Power
Ultrasound Technology. In Advances in Food Processing Technology, Springer,
Singapore, 2019, pp. 149–187.
[24] B. Madhu, M.S. Srinivas, G. Srinivas, S.K. Jain, Ultrasonic Technology and Its
Applications in Quality Control, Processing and Preservation of Food: A Review.
Current, Journal of Applied Science and Technology (2019) 1–11.
[25] Ginel, A. M., & Álvarez-Arenas, T. G. Air-coupled Transducers for Quality Control in the Food Industry. In 2019 IEEE International Ultrasonics Symposium (IUS) (2019) 803-806 IEEE.
[26] J. Chandrapala, B. Zisu, Ultrasound Technology in Dairy Processing. In Ultrasound
Technology in Dairy Processing, Springer, Cham, 2018, pp. 1–40.
[27] J. Food Qual. 2017 (2017) 1–12,https://doi.org/10.1155/2017/5794931.
[28] Villamiel, M., García-Pérez, J. V., Montilla, A., Carcel, J. A., & Benedito, J. (Eds.). Ultrasound in food processing: Recent advances (2017) John Wiley & Sons.
[29] A.M. Goula, M. Ververi, A. Adamopoulou, K. Kaderides, Green ultrasound-assisted
extraction of carotenoids from pomegranate wastes using vegetable oils, Ultrason.
Sonochem. 34 (2017) 821–830.
[30] D. Bermudez-Aguirre, Ultrasound: advances in food processing and preservation,
Academic Press, 2017.
[31] S.N. Guerrero, M. Ferrario, M. Schenk, M.G. Carrillo, Hurdle technology using
ultrasound for food preservation. In Ultrasound: advances for food processing and
preservation, Academic Press, 2017, pp. 39–99.
[32] D. Pradal, P. Vauchel, S. Decossin, P. Dhulster, ve Dimitrov, Kinetics of
ultrasound-assisted extraction of antioxidant polyphenols from food by-products: Extraction
and energy consumption optimization.“, Ultrason. Sonochem. 32 (2016) 137–146.
[33] Grzegorz Musielak, Dominik Mierzwa, and Joanna Kroehnke. Food drying
en-hancement by ultrasound–A review, Trends Food Sci. Technol. 56 (2016)
126–141.
[34] C. Gambuteanu, P. Alexe, Principles and Effects of Acoustic Cavitation The Annals
of the University Dunarea de Jos of Galati Fascicle VI–, Food Technology 37 (2)
(2013) 9–17.
[35] Ercan, S.Ş. ve Soysal, Ç. Ultrasonun gıdalarda ve enzimlerin inaktivasyonunda kullanılması, Gıda Dergisi, 36 (2011) 225-231.
[36] Chemat, F., Zill-e-Huma and Khan, M.K. Applications of ultrasound in food tech-nology: Processing, preservation and extraction, Ultrasonics Sonochemistry, 18 (2011) 813-830.
[37] R.K. Bhaskaracharya, S. Kentish, M. Ashokkumar, Selected Applications of
Ultrasonics in Food Processing, Food Eng. Rev. 1 (2009) 31–49.
[38] Ulusoy, B.H., Çolak, H. ve Hampikyan, H. The use of ultrasonic waves in food technology, Research Journal of Biological Sciences, 2 (2007) 491-497.
[39] Z.J. Dolatowski, J. Stadnik, D. Stasiak, Applications of ultrasound in food
tech-nology, Acta Sci. Pol., Technol. Aliment 6 (2007) 88–99.
[40] Bayraktaroğlu, G. ve Obuz, E. Ultrason yönteminin ilkeleri ve gıda endüstrisinde kullanımı, 24-26 Mayıs 2006, Türkiye 9. Gıda Kongresi, Bolu (2006) 57-60.
[41] J.G. Brennan, Food Processing Handbook, Wiley VCH Germany (2006) 582 p.
[42] M.P. Martins, E.J. Cortés, V. Eim, A. Mulet, J.A. Cárcel, Stabilization of apple peel
by drying. Influence of temperature and ultrasound application on drying kinetics
and product quality, Drying Technol. 37 (5) (2019) 559–568.
[43] H.T. Sabarez, S. Keuhbauch, K. Knoerzer, Ultrasound assisted low temperature
drying of food materials, Editorial Universitat Politècnica de València, 2018.
[44] J.A. Cárcel, J.V. García-Pérez, E. Riera, C. Rosselló, A. Mulet, Ultrasonically
as-sisted drying, Ultrasound in Food Processing (2017) 371–391.
[45] A. Fijalkowska, M. Nowacka, A. Wiktor, M. Sledz, D. Witrowa-Rajchert,
Ultrasound as a pretreatment method to improve drying kinetics and sensory
properties of dried apple, J. Food Process Eng 39 (3) (2016) 256–265.
[46] Z. Zhang, Y. Niu, S.R. Eckhoff, H. Feng, Sonication enhanced cornstarch
separa-tion. Starch-Stärke 57 (6) (2005) 240–245.
[47] J. Frias, E. Penas, M. Ullate, C. Vidal-Valverde, Influence of Drying by Convective
Air Dryer or Power Ultrasound on the Vitamin C andβ-Carotene Content of
Carrots, J. Agric. Food Chem. 58 (2010) 10539–10544.
[48] F.A.N. Fernandes, F.E. Linhares, S. Rodrigues, Ultrasound as pre-treatment for
drying of pineapple, Ult. Sonoc. 15 (2008) 1049–1054.
[49] F.A.N. Fernandes, S. Rodrigues, Ultrasound as pre-treated for drying of fruits:
Dehydration of banana, J. Food Eng. 82 (2007) 261–267.
[50] S. Fuente-Blanco, E. Riera-Franco de Sarabia, V.M. Acosta-Aparicio, A.
Blanco-Blanco, J.A. Gallego-Juarez, Food drying process by power ultrasound, Ultrasonics
44 (2006) 523–527.
[51] J.A. Gallego-Juarez, G. Rodriguez-Corral, J.C. Galvez-Moraleda, T.S. Yang, A new
high-intensity ultrasonic technology for food dehydration, Drying Technology: An
International Journal 17 (1999) 597–608.
[52] J.T. Mason, L. Paniwnyk, J.P. Lorimer, The Uses of Ultrasound in Food