Contents lists available atScienceDirect
Economic Systems
journal homepage:www.elsevier.com/locate/ecosys
Foreign banks and short-term macroeconomic fluctuations: Do
financial development and regions matter?
Zeynep Önder
⁎, Süheyla Özyıldırım
Faculty of Business Administration, Bilkent University, TurkeyA R T I C L E I N F O JEL classification: G21 E32 Keywords: Bank integration Financial development Foreign banks Macroeconomic volatility Global financial crisis
A B S T R A C T
In this paper, we investigate the association between bank integration, measured with the share of foreign banks in the banking industry, and macroeconomic volatility in emerging economies. We find a negative and significant relationship between bank integration and short-run fluc-tuations in output, consumption and investment, controlling for financial development, bank concentration and the real effective exchange rate. However, this relationship is found to be positive at high levels of financial development. We also explore the association at the regional level and show that the presence of foreign banks in Latin America is negatively and significantly correlated with macroeconomic volatility both in normal times and times of crisis. Despite widespread concerns in emerging Europe, which experienced greater financial vulnerability during the global financial crisis, we find no significant association between growth volatilities and bank integration.
1. Introduction
The financial systems and economies of many emerging markets have benefited from financial integration through banks over the past two decades. Foreign banks have enhanced the financial expertise and contributed credit access in countries with under-developed banking systems (Giannetti and Ongena, 2012) and provided external financing even during episodes of local financial turmoil (Goldberg et al., 2000;Schnabl, 2012;De Haas and Van Lelyveld, 2014). However, there is also evidence that the entry of foreign banks has increased competition and adversely affected the availability of credit in some developing countries (Beck et al., 2004; Gormley, 2010, 2014). For example,Detragiache et al. (2008)document that the positive effect of foreign banks on cost efficiency and welfare is not valid for all economies. Relatively little is known as to why foreign banks have different effects on the economies of developing countries. We contribute to this literature by examining the relationship between banking integration and short-term macroeconomic fluctuations among emerging economies in different regions. It appears that the country’s level of fi-nancial development plays a significant role on the dynamics between volatility and bank integration.
There is a broad consensus in the theoretical and empirical literature that high macroeconomic volatility tends to depress in-vestment, bias it toward short-term returns, reduce consumption levels and factor productivity, increase poverty and worsen income distribution (see e.g.,Foster, 1995;Breen and García-Peñalosa, 2005; Laursen and Mahajan, 2005). Its harmful effects are more pronounced in emerging market economies (Hnatkovska and Loayza, 2005;Koren and Tenreyro, 2007). However, there are only a few papers that examine the association between the presence of foreign banks and macroeconomic volatility. For example, in their influential paper, measuring volatility with the deviation of the actual employment growth rate from the expected rate,Morgan et al.
https://doi.org/10.1016/j.ecosys.2018.08.007
Received 1 December 2017; Received in revised form 26 July 2018; Accepted 28 August 2018 ⁎Corresponding author.
E-mail address:[email protected](Z. Önder).
Available online 22 January 2019
0939-3625/ © 2019 Elsevier B.V. All rights reserved.
(2004)show that out-of-state banks (which can be considered “foreign”) had a stabilizing effect on economic activity among US states. However, using a sample of 102 countries,Morgan and Strahan (2004)find no association between foreign banks and real GDP volatility, but a positive association between foreign banks and real investment volatility. Their sample period, 1990 to 1997, coincides with the early years of foreign bank entry into host countries. The average share of bank assets controlled by foreign banks in the majority of their sample countries was small. Moreover, their sample period does not cover a large-scale financial crisis, which may compel foreign banks to reconsider their commitment to sustaining sufficient levels of external financing in the host countries. Financial development is among the important variables smoothing economic volatility, as documented by several empirical studies in the literature (see e.g.,Easterly et al., 2001;Braun and Larrain, 2005;Bekaert et al., 2006;Raddatz, 2007;Manganelli and Popov, 2015). Theoretically,Wang et al. (2018)explain this negative relationship by modeling the link between the financial de-velopment level of a country and firms’ investment demand through borrowing constraints and credit reallocations. However, to our knowledge, no previous papers have analyzed whether financial development plays any role in the association between the presence of foreign banks and macroeconomic fluctuations. In this paper, we argue that foreign banks may relax borrowing constraints and help smooth economic activities in countries with low financial development, whereas in financially developed markets firms have easy access to funding, thereby diminishing their dependence on domestic and foreign lenders.
There is considerable heterogeneity in foreign bank lending and bank behavior across countries, even within broad country groupings. For example, cross-border flow from parent banks is common in Eastern Europe but lower than ten percent in Latin America and Asia. Local affiliates distribute the majority of foreign bank lending in Latin America (Kamil and Rai, 2010). The dominance of intra-regional foreign banking reflects ties due to political, language, colonial, ethnic or geographic proximity. For example, Spanish and US banks are the dominant foreign banks in Latin America, whereas they have a low presence in Eastern Europe, where Austrian, Belgian, Swedish and Italian banks are more active. In both regions, German and French banks are also very active. Among European banks, UK banks have a particularly significant presence in Asia. To capture possible regional differences, in this paper, we explore the association between foreign bank presence and macroeconomic fluctuations across three regions, that is, Latin America, emerging Europe and Asia.
Using a sample of 24 financially integrated emerging economies,1we examine the relationship between macroeconomic fluc-tuations and banking integration measured with the share of foreign banks in the banking sector for the period 1999–2011. We also analyze this relationship at different levels of financial development and investigate whether it changes during the global financial crisis, asKose et al. (2011)underline that the damage in financial stability caused by the crisis has been particularly serious for some emerging economies, especially those that are highly dependent on foreign bank financing. The variation among global regions is investigated as well. Considering the different dynamics of foreign banks’ lending in emerging Europe during the last two decades, i.e., faster credit expansion followed by a deeper crunch (see, e.g.,De Haas and van Lelyveld, 2014), the regional breakdowns seem to shed more light on understanding economic swings among these regions.
We observe that there is a significant and negative association between growth volatilities and bank integration. However, this relationship changes with the level of financial development in the country. The association between the presence of foreign banks and volatilities in consumption and output is found to be positive at high levels of financial development. The results show significant differences among regions. For example, a negative association between bank integration and short-term macroeconomic volatility is observed in Latin America regardless of the level of financial development and the measure of macroeconomic fluctuations, whereas almost no significant relationship is found in emerging Europe. The association is found to change in Asia depending on the level of financial development. To check the robustness of our results, we perform further estimations with different measures of macro-economic fluctuations and estimation methods to eliminate possible endogeneity problems. The findings are found to be consistent with our main results.
The paper is organized as follows: Section2presents the empirical model and the data. Section3reports the results and the outcomes of our robustness checks. Section4concludes the paper.
2. Empirical methodology
2.1. Empirical model for macroeconomic volatility
In this paper, we construct a measure of volatility in the real growth rates of GDP, consumption and investment as inMorgan et al. (2004)andKalemli-Ozcan et al. (2014).2We first estimate the growth rates of three macroeconomic variables using the standard model byBekaert et al. (2005).3Then, the absolute values of the residuals are used as measures of volatility,v
it, and the following
empirical model is estimated:
vit= + 1Foreignit+ 2(Foreign xFinDevit it)+ 3FinDevit+ 4FinDevit2+ Xit+ t+ it (1)
1The countries included in our analysis are Argentina, Brazil, Bulgaria, Chile, China, Estonia, Hungary, India, Indonesia, Latvia, Lithuania, Malaysia Mexico, Pakistan, Peru, the Philippines, Poland, Romania, the Russian Federation, South Africa, Thailand, Turkey, Ukraine and Venezuela. The IMF classifies them as “more financially integrated” emerging market economies.
2In general, studies with sufficiently long time series data use the standard deviation of the growth rate as a measure of volatility. However, constructing time series volatilities by rolling windows with fixed sizes and computing standard deviations for every window generates serial correlation in the resulting time series.
where Foreignitis defined as the share of foreign bank assets in total assets of the banking system of countryiin yeart. FinDevitis a
financial development indicator, measured by the natural logarithm of private credit provided by banks and other financial in-stitutions as a share of GDP, as inLevine et al. (2000). In order to eliminate the fluctuations in this ratio, the average over the last three years is used in the estimations, as inAghion et al. (2010). We add an interaction variable between the share of foreign banks and the financial development indicator to the model in order to investigate how the relationship between banking integration and volatility changes with the level of financial development in the economy. A quadratic FinDevitterm is included in the model to
capture a possible non-linear relationship between financial development and macroeconomic volatility, as inEasterly et al. (2001) andWang et al. (2018).Xitrepresents two control variables, the asset concentration of the largest five banks in the banking sector
(Bank Concentration) and change in the real effective exchange rate, which might affect the volatility in the growth rate of output, consumption, or investment. Year fixed effects, t, are also included in the model. The standard errors are adjusted for
hetero-scedasticity and autocorrelation.
As emphasized byRose and Spiegel (2009), the effect of financial integration on macroeconomic volatility is ambiguous in theory and the association between these variables is an empirical issue. On the one hand, if foreign banks help strengthen financial stability, increasing foreign bank shares in the domestic banking system may reduce the deviation of output and its components from their expected growth rates. The empirical evidence, especially from developing and transition countries, shows that foreign banks im-prove financial stability through their ability to access supportive parent banks that provide liquidity and capital if and when needed (Goldberg et al., 2000;Clarke et al., 2006;Vogel and Winkler, 2012). On the other hand, foreign banks may exacerbate economic volatility by facilitating capital outflows during financial crises or seeking less risky banking clients, leaving riskier clients to domestic banks. Empirical evidence also shows that foreign banks can be a source of contagion by transmitting external shocks (see, e.g., Cetorelli and Goldberg, 2011,2012).
Economic theory suggests a number of channels through which financial development can affect volatility. For example, deeper financial systems can dampen volatility by alleviating firms’ cash constraints, particularly in economies with tight international financial constraints (Aghion et al., 1999;Caballero and Krishnamurthy, 2001;Wang et al., 2018), or by lessening the sensitivity of household and firm spending to downturns in income and cash flow (Dynan et al., 2006). However, financial development can increase the risk-taking appetite of entrepreneurs and banks and facilitate over-leverage. Both of these factors may drive up volatility, as shown byShleifer and Vishny (2010)andWagner (2010). Most previous empirical studies have found a negative effect of financial development on output volatility at the aggregate level (see, e.g.,Easterly et al., 2001;Denizer et al., 2002;Bekaert et al., 2006;Beck et al., 2006;Aghion et al., 2010;Wang et al., 2018). However, there is also evidence that the effect of financial development is not a significant factor in explaining consumption volatility (Bekaert et al., 2006) or investment volatility (Aghion et al., 2010).
In our estimations, we control for bank concentration because low levels of competition could create a monopoly power that would reduce banking system efficiency and credit availability, as well as increase loan prices. These effects may hamper investment and economic growth (see, e.g.,Jayaratne and Strahan, 1996; Cetorelli and Gambera, 2001) and even generate macroeconomic fluctuations (see, e.g.,Morgan and Strahan, 2004;Buch and Neugebauer, 2011;Bremus and Buch, 2015). We also include change in real exchange rate to explain fluctuations in economic growth. As shown byBadia Marialuz and Segura-Ubiergo (2014), most emerging market economies have experienced substantial real exchange rate appreciation in recent years, generating concerns about macroeconomic difficulties including the loss of competitiveness and macroeconomic volatility. However,Magud and Sosa (2010) show that policymakers in these countries try to manage unintended consequences of foreign exchange abundance and their effect on macroeconomic volatility seems to be mostly inconclusive.
During the global crisis, foreign banks reduced credit more compared to domestic banks. According toCetorelli and Goldberg (2011), these banks play a role in the contraction of lending in emerging markets through three channels: a decline in cross-border lending, a decline in local lending by local affiliates of foreign banks, and a decline in lending by domestic banks as a result of the funding shock induced by the contraction in interbank cross-border lending. To capture the global crisis effects, we introduce two-and three-way interaction variables with the crisis years (Y2008 two-and Y2009), foreign banks two-and financial development, two-and estimate the following model:
v Foreign Foreign x FinDev FinDev FinDev Foreign xY Foreign xY
Foreign xFinDev xY Foreign xFinDev xY X
( ) ( 2008) ( 2009) ( 2008) ( 2009) it it it it it it it it it it it it it t it 1 2 3 4 2 1 2 3 4 = + + + + + + + + + + + (2)
The characteristics and credit behavior of foreign banks are different in different parts of the world.Kamil and Rai (2010)show that foreign banks behaved differently in Latin American countries during the global financial crisis by lending through their local subsidies, in domestic currencies and funding from a domestic deposit base. Similarly,Bonin and Louie (2017)report that the big six foreign banks acted like domestic banks during the crisis, whereas the other foreign banks cut their lending and ran out of emerging Europe. In order to investigate the relationship between the presence of foreign banks and macroeconomic volatility in different regions, we estimate the models by including three region dummy variables (Latin America, emerging Europe and Asia), two-way and three-way interaction variables with foreign bank, the level of financial development, and region dummy variables.4
The results of the endogeneity tests, reported at the bottom ofTable 3, indicate that foreign bank shares are not endogenous in explaining volatility in GDP and consumption, but are endogenous in explaining the volatility of investments. Therefore, we estimate 4Since we have only one country from Africa, we do not include this region in our analysis of regional differences. We estimate the models with region dummy variables without South Africa.
the output and consumption models with Ordinary Least Squares (OLS) and use instrumental variable (IV) estimation in the in-vestment model. We use dummy variables created from the legal origin of a country, French, German, English and Socialist, as in Detragiache et al. (2008), and the lagged ratio of foreign bank assets to total assets in the banking sector as instrumental variables.
2.2. Data
The sample includes 24 countries: six Latin American, ten emerging European, seven Asian and one African. We collected the share of foreign banks in the total banking industry from various sources, such as the publications of each country’s central bank and the reports of national banking associations. Consistent with the literature, a bank is classified as foreign-owned if foreign share-holders hold at least 50% of the bank’s equity.5The major source for other variables was the World Development Indicators (WDI) database. Real effective exchange rate data (REER) were obtained from the Bank for International Settlements’ (BIS) database.
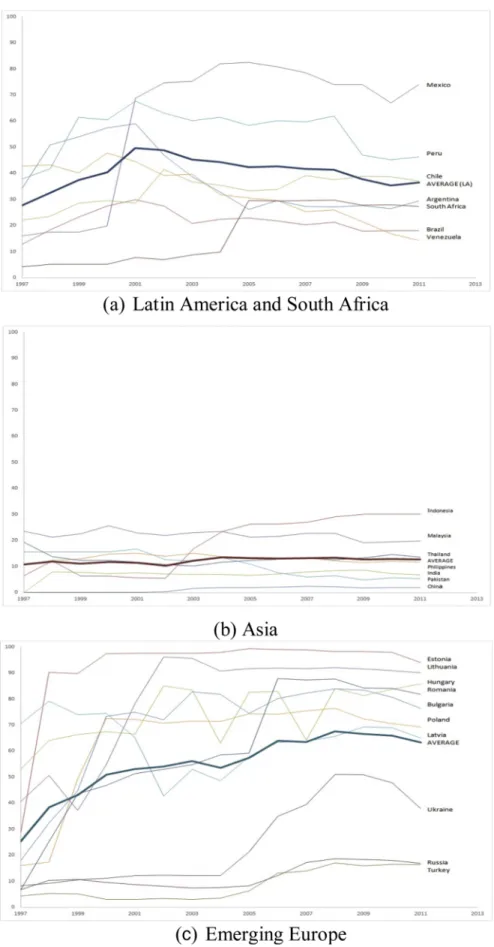
Fig. 1shows how the share of foreign banks in each country’s banking sector changed over the sample period with respect to the regional averages. Foreign bank participation has increased in almost all countries over the last decade, but a sharp expansion of foreign bank presence has mainly been observed in seven Eastern European countries: the share of assets controlled by foreign banks in these countries increased from less than 10% in 1994 to over 70% in 2011. On average, foreign banks hold more than half of the banking sector assets (54.85%) in European countries, even though Russia and Turkey (which had less than 20% foreign ownership in 2011) are also included in this region. The average share of foreign banks in Asia is almost one-fifth of that in emerging European countries. Latin American countries are less homogeneous in terms of the share of foreign banks in their banking industry. In South Africa, foreign banks increased their share from less than 10% at the beginning of the 2000s to around 30% in 2004, and have stabilized at that level.6
Table 1shows means and standard deviations of the variables at regional levels. The growth rate of investments is more volatile than the growth rates of GDP and private consumption. The average macroeconomic fluctuations are highest in emerging European countries during the sample period. There are significant differences among regions in terms of their financial development. For example, Chile had the highest average ratio among Latin American countries with 72.1%, whereas it was only 14% in Venezuela. Emerging European countries were more homogeneous, moving between 17.2% in Romania to 53.2% in Estonia. In Asia, Pakistan had the lowest financial development level (25.2%), whereas Malaysia had the highest (124.9%). It is also worth mentioning that South Africa has the most developed financial system. Although Asian countries show variation in terms of financial development, they are more homogeneous than other regions in terms of the average share of foreign banks’ assets in their banking sector.7 3. Empirical findings
3.1. The relationship between bank integration and macroeconomic volatility
InTable 2, we present the results of the empirical model examining the relationship between foreign banks and macroeconomic volatility. The dependent variable in the estimations is the short-term fluctuations measured by the absolute value of the deviations of the actual growth rates from the predicted rates of real GDP, real consumption and real investment. Foreign bank coefficients are found to be negative and significant and the coefficients of the interaction variable between foreign bank shares (Foreign) and financial development (FinDev) are found to be positive and significant in explaining all measures of macroeconomic volatility.
The differences in the signs of the estimated coefficients suggest that the level of financial development in the country is important in explaining the relationship between foreign bank presence and macroeconomic fluctuations. At low levels of financial develop-ment, the presence of foreign banks is negatively associated with macroeconomic volatility, but at high levels of financial devel-opment this relationship may turn positive. Using the estimated coefficients of the variables Foreign and Foreign x FinDev in the GDP model, we find that if the level of bank credit to the private sector is 21.3% of GDP (threshold value), the coefficient of foreign bank penetration on GDP volatility is zero. If this ratio is less (greater) than 21.3%, the association between foreign banks and volatility in GDP is negative (positive). Similarly, the threshold values of financial development for the consumption and investment volatility models are found to be 19.7% and 28.2%, respectively. Taking the annual average level of the bank credit-to-GDP ratio in our sample as 45.8% (Table 1), our findings suggest that the presence of foreign banks is expected to increase the volatility of the growth rates of output and its components, consumption and investment.
In order to test whether the coefficients of foreign banks are significant in explaining macroeconomic volatility at three different levels of financial development, we predict the coefficients of foreign bank participation at the 25th, 50th and 75th percentiles of the financial development indicator of the countries in the sample. The estimated coefficients of the foreign bank variable are presented inTable 2, Panel B. It is found that the presence of foreign banks and short-term fluctuations in GDP and consumption are positively 5We consider both foreign bank subsidiaries and branches in calculating foreign bank market shares. We extend the foreign bank market share data ofClaessens and Van Horen (2014) for early periods and for countries such as Chile, China, the Philippines, Russia and Turkey.
6Since South Africa is the only country in Africa classified as a financially integrated developing country by the IMF, we graph this country with the Latin American countries.
7The regions are different in terms of the correlation coefficient between their financial development indicator and the shares of foreign banks in their banking industry. Although the Pearson correlation coefficient is 0.2495 among all countries in the sample, it is negative in Latin America (-0.1381) and Asia (-0.2512), whereas it is positive in emerging Europe (0.4408) and South Africa (0.6589).
Table 1
Descriptive Statistics.
Latin Emerging South All
America Europe Asia Africa Countries
Measures of Short-term Fluctuations:
Volatility in GDP 1.93 2.19 1.73 1.03 1.94 (2.23) (2.05) (1.69) (0.74) (1.976) Volatility in Consumption 2.35 3.18 2.47 1.72 2.70 (2.14) (2.98) (2.46) (0.86) (2.60) Volatility in Investment 9.45 10.02 9.07 4.71 9.39 (10.07) (9.39) (6.92) (2.90) (8.77) Variables of Interest:
Foreign Bank Shares (Foreign) 40.24 54.85 11.40 16.94 37.16
(18.96) (32.08) (8.17) (11.53) (29.77)
Financial Development (FinDev) 29.95 31.22 68.27 136.37 45.80
(20.79) (19.98) (44.72) (12.33) (38.44)
Control Variables:
Bank Concentration 67.26 61.25 60.94 87.03 63.74
(12.92) (16.86) (11.05) (4.18) (15.03)
Real Effective Exchange Rate (REER) 109.11 89.84 92.67 95.36 95.71
(40.04) (13.21) (9.22) (13.91) (23.75)
Notes: The standard deviations of variables are reported below the mean values in parentheses. All figures are in percentages. Sources: World Development Indicators (WDI) and Bank for International Settlements (BIS) databases. Foreign bank shares are obtained from the banking asso-ciations and central bank websites of each country.
Table 2
Results of the Macroeconomic Volatility Estimations.
Dependent Variable: Absolute Value of the Deviation of the Growth Rate from the Expected Growth Rate in
GDP Private Consumption Investment
Panel A: Foreign −4.182 * −6.620 ** −21.201 ** (2.382) (2.743) (10.713) Foreign x FinDev 1.368 ** 2.222 *** 6.351 ** (0.688) (0.809) (3.209) FinDev −1.899 −3.093 ** −3.299 (1.659) (1.282) (7.439) FinDev2 0.208 0.346 ** 0.126 (0.208) (0.172) (0.920) Bank Concentration −0.008 −0.013 −0.023 (0.007) (0.010) (0.034) REER −0.027 *** −0.034 *** −0.057 * (0.008) (0.010) (0.033) Intercept 5.978 * 8.976 *** 19.357 (3.255) (2.538) (15.397) Adjusted R2 0.164 0.227 0.099 F-statistics 1.98 ** 2.56 *** 1.70 ** p-value 0.011 0.001 0.039 Test of Endogeneity: Chi squared 0.428 0.599 5.556 p-value 0.513 0.439 0.018 Test of Overidentification: Chi squared 3.926 p-value 0.270 Panel B: 25th percentile of FinDev −0.082 0.042 −2.162 (0.482) (0.616) (1.990) 50th percentile of FinDev 0.417 0.853 0.157 (0.389) (0.560) (1.764) 75th percentile of FinDev 1.399 ** 2.449 *** 4.717 (0.601) (0.831) (3.074)
Notes: Panel A presents the results of the regression model specified in Eq.(1). The standard errors of the coefficients are reported in parentheses. Panel B reports the estimated coefficients of the share of foreign banks at the 25th, 50th and 75th percentile of financial development in the whole period.*,**and***indicate statistical significance at the 10%, 5% and 1% levels, respectively. The OLS method is used in estimating the volatility of GDP and Private Consumption models. The IV method is used in the Volatility of Investment model. All estimations contain year fixed effects. The number of observations is 307.
and significantly related at a high level of financial development (75th percentile), whereas no significant association between the presence of these banks and macroeconomic volatility is observed at low or moderate levels (25th and 50th percentiles respectively) of the financial development indicator.
Although a negative relationship is found between financial development and volatility of output, consumption or investment growth, the estimated coefficient of FinDev is only significant in explaining consumption volatility. In terms of other control variables, we find that an appreciation of the real exchange rate has a significant dampening impact on GDP and consumption growth volatility. Even though strengthening currencies are expected to have an adverse influence on economic performance, the currencies in our sample countries (seeTable 1) are not very overvalued to create such effects. In general, bank concentration as measured by the share of assets of the five largest banks is not found to have a significant impact on macroeconomic volatility.
3.2. The relationship between bank integration and macroeconomic volatility during the 2008/2009 crisis period
The relationship between foreign banks and macroeconomic volatility is found to be similar for the whole period when the interaction variables with the crisis years 2008 and 2009 are included in the model (seeTable 3). The coefficients of Foreign are negative and those of Foreign x FinDev positive in explaining GDP, consumption and investment volatility, but they are only sig-nificant in the consumption and investment models. It is found that the coefficient of foreign banks decreased sigsig-nificantly in 2009, but no significant change was observed in 2008. Similarly, the coefficients of the interaction between financial development and foreign banks are found to increase significantly in 2009 in explaining GDP and investment volatilities. Even though foreign banks changed their lending behavior in some regions during the global financial crisis (see, e.g.,Cull and María Soledad, 2013), these changes seem to have no significant effect on the volatility of growth rates in the financially integrated emerging countries.8 Con-sistent with the initial results, we find that at high levels of financial development, bank integration has a positive association with consumption and investment growth volatilities.
Table 3
Results of Macroeconomic Volatility Estimations with Global Financial Crisis Years Dummy Variables.
Dependent Variable: Absolute Value of the Deviation of the Growth Rate from the Expected Growth Rate in
GDP Private Consumption Investment
Foreign −2.451 −5.898 ** −20.069 * (2.253) (2.543) (11.710) Foreign x FinDev 0.792 1.928 ** 6.251 * (0.653) (0.757) (3.587) Foreign x Y2008 1.513 1.761 −3.489 (8.106) (9.306) (19.981) Foreign x Y2009 −18.896 *** −2.267 −42.661 ** (6.245) (15.205) (18.311)
Foreign x FinDev x Y2008 0.136 0.095 1.078
(2.053) (2.400) (5.695)
Foreign x FinDev x Y2009 4.881 *** 0.793 8.676 *
(1.626) (3.816) (5.025) FinDev −1.467 −2.882 ** −3.269 (1.630) (1.279) (7.669) FinDev2 0.156 0.322 * 0.112 (0.205) (0.172) (0.949) Bank Concentration −0.009 −0.012 −0.029 (0.007) (0.010) (0.034) REER −0.029 *** −0.034 *** −0.061 * (0.008) (0.010) (0.033) Intercept 7.680 ** 12.238 *** 29.497 * (3.417) (3.061) (16.211) Adjusted R2 0.199 0.232 0.111 F-statistics 2.37 *** 2.29 *** 1.99 *** p-value 0.001 0.001 0.006
Notes: This table presents the results of the regression model specified in Eq.(2). The numbers in parentheses are standard errors.*,**and*** indicate statistical significance at the 10%, 5% and 1% levels, respectively. The OLS method is used in estimating the volatility of GDP and Private Consumption models. The IV method is used in the investment volatility model. All regressions contain year fixed effects. The number of ob-servations is 307.
8We also estimated the significance of the coefficients of foreign banks at three levels of financial development, the 25th, 50th and 75th per-centiles. Significant and positive coefficients are observed at the 75th percentile level in the consumption model. Interestingly, the coefficient of foreign banks is significant and negative in explaining investment volatility at a low level of financial development in 2009.
3.3. Regional variation
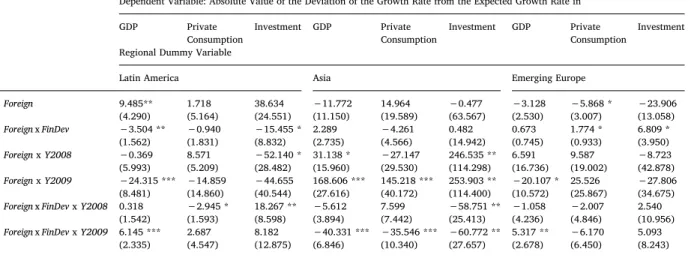
Table 4 presents the estimated coefficients of only foreign bank variables, including their interaction with crisis and region dummy variables in three regression models, explaining volatilities in GDP, consumption and investment.9Our empirical evidence highlights significant regional differences during normal periods and crisis years. For example, the coefficients of foreign banks are negative and their interaction with financial development has positive coefficients in emerging Europe. These coefficients are similar to the overall findings. Contrarily, the former variable has a positive and the latter a negative coefficient in explaining volatility in Latin America. These coefficients are found to be significant in explaining GDP volatility in Latin America and consumption volatility in emerging Europe.
The regions are different in terms of change in the coefficients of the foreign bank related variables with the global financial crisis years. For example, the coefficient of foreign banks is found to increase significantly in explaining GDP, consumption and investment volatility in 2008 and 2009 in Asia, whereas they decline in the GDP model in Latin America and emerging Europe only in 2009. The interaction coefficient is found to increase in 2009 in Latin America and emerging Europe in the GDP model but declines significantly in the Asian countries, not only in explaining GDP volatility but also the volatility of its components.
Table 5presents the estimated coefficients of foreign banks at different levels of financial development in each region for the whole sample period and the global crisis years 2008 and 2009. Although foreign banks are found to be negatively associated with the volatility of the GDP growth rate in all regions regardless of their level of financial development, the coefficients are found to be significant at the 75th percentile in Latin America, at the 25th and 50th percentiles of financial development in Asia, and only at the 25th percentile of financial development in emerging Europe. These significant values can be explained by the differences in the threshold levels of financial development in the three regions. The levels are 14%, 171% and 104% in Latin America, Asia and emerging Europe, respectively. Considering the average level of financial development in these countries (seeTable 1), a negative association is observed between bank integration and GDP volatility in all three regions.
Overall, we have not observed any significant association of the globalization of the banking industry (Foreign) and consumption volatility at any level of financial development. Although there is no precise channel for the effect, well-developed financial systems and good institutions are expected to lower consumption volatility (Bekaert et al., 2006). Yet, similar to our findings, there is other empirical evidence showing ambiguous findings with respect to the effect of higher household credit on economic performances, especially in emerging economies (see, e.g.,Beck et al., 2012). However, the coefficients of Foreign in the investment volatility models show a negative association at the 75th percentile of financial development only in Latin America.
A one standard deviation increase in the share of foreign banks in the banking industry in Latin America is associated with roughly 0.56% decrease in the volatility of GDP and 3.09% decrease in the volatility of investments at the 75th percentile of the level of financial development. Similarly, a one standard deviation increase in the share of foreign banks in the banking industry in Asia
Table 4
Coefficients of Foreign Bank Related Interaction Variables with Regional Dummy Variables.
Dependent Variable: Absolute Value of the Deviation of the Growth Rate from the Expected Growth Rate in
GDP Private
Consumption Investment GDP PrivateConsumption Investment GDP PrivateConsumption Investment Regional Dummy Variable
Latin America Asia Emerging Europe
Foreign 9.485** 1.718 38.634 −11.772 14.964 −0.477 −3.128 −5.868 * −23.906 (4.290) (5.164) (24.551) (11.150) (19.589) (63.567) (2.530) (3.007) (13.058) Foreign x FinDev −3.504 ** −0.940 −15.455 * 2.289 −4.261 0.482 0.673 1.774 * 6.809 * (1.562) (1.831) (8.832) (2.735) (4.566) (14.942) (0.745) (0.933) (3.950) Foreign x Y2008 −0.369 8.571 −52.140 * 31.138 * −27.147 246.535 ** 6.591 9.587 −8.723 (5.993) (5.209) (28.482) (15.960) (29.530) (114.298) (16.736) (19.002) (42.878) Foreign x Y2009 −24.315 *** −14.859 −44.655 168.606 *** 145.218 *** 253.903 ** −20.107 * 25.526 −27.806 (8.481) (14.860) (40.544) (27.616) (40.172) (114.400) (10.572) (25.867) (34.675) Foreign x FinDev x Y2008 0.318 −2.945 * 18.267 ** −5.612 7.599 −58.751 ** −1.058 −2.007 2.540
(1.542) (1.593) (8.598) (3.894) (7.442) (25.413) (4.236) (4.846) (10.956) Foreign x FinDev x Y2009 6.145 *** 2.687 8.182 −40.331 *** −35.546 *** −60.772 ** 5.317 ** −6.170 5.093
(2.335) (4.547) (12.875) (6.846) (10.340) (27.657) (2.678) (6.450) (8.243) Notes: This table presents the coefficients of the interaction variables with three regional dummy variables, Latin America, Asia and Emerging Europe, in three regression models explaining volatility in GDP, Private Consumption and Investments. The adjusted R2values for the three models are 0.316, 0.324 and 0.168, respectively. The number of observations is 295. The numbers in parentheses are standard errors.*,**and***indicate statistical significance at the 10%, 5% and 1% levels, respectively.
9In these estimations, we exclude South Africa from the sample and investigate three regions, Latin America, Asia and emerging Europe. The coefficients of the control variables are not reported to save space, but they are similar to the estimations without regional variables. The real exchange rate is found to reduce macroeconomic volatility significantly. We find a non-linear association between consumption volatility and financial development, suggesting that too much finance might lead to an amplification of consumption volatility.
and emerging Europe is associated with roughly 0.35% and 0.40% decrease in the volatility of GDP at the 25th percentile of the level of financial development. Considering the mean values of the short-term macroeconomic fluctuations, these changes are econom-ically significant.
No significant association between foreign banks and output, consumption, or investment volatility is found in 2008. The only exception is Asia, where at the 25th and 50th percentiles of financial development, there is a positive and significant association between foreign bank shares and output volatility.Chen and Wu (2014)show that the average credit growth rate of foreign banks in Asia slowed down by more than 40% in 2008. Our findings suggest that the macroeconomic impact of the decline in credit supply in Asia may be associated more strongly with output volatility in 2008 among countries in that region with low or medium levels of financial intermediary development.
Our findings indicate a strong association between foreign banks and short-term fluctuations in output and its components in 2009 in Latin America and Asia. In Latin America, almost all the coefficients are significant and negative regardless of the financial development level. A negative association between bank integration and macroeconomic volatility in Latin American countries can be explained by the nature of foreign bank behavior in this region. As highlighted byMoguillansky et al. (2004), foreign banks in Latin America have more conservative risk evaluation systems than their local counterparts. Since their entry, foreign banks have not had a very significant effect on the cost of capital of domestic banks in Latin America, and hence they have not created much competitive pressure for local banks. Moreover, these banks are less vulnerable to the region’s domestic cycles, as their effective exposure is very small in relation to their global diversification. For most of the region’s economies, half or more of all foreign banks’ financing is denominated in local currency (Kamil and Rai, 2010). Considering these factors as healthy financial development, as highlighted byWang et al. (2018), it is understandable that foreign banks in Latin America helped smooth macroeconomic volatility, especially in 2009.
Unlike Latin America, the association of foreign banks with output growth volatilities in Asia is significant and positive at the 25th and 50th percentile levels in 2009 but negative at the 75th percentile. In terms of credit market development, some Asian countries, especially those in East Asia, are far more developed than those in emerging Europe and Latin America. For example, the largest leaps in financial development in Asia took place in China, Malaysia and Thailand, and their private sector credits were around 120% of GDP between 1997 and 2011. Moreover, foreign currency loans in total loans and foreign currency deposits in total deposits are relatively small in these countries, for example only five percent in China (Didier and Schmukler, 2014). On the other hand, the countries in South Asia are far less developed in terms of bank integration than those in emerging Europe and Latin America. Previous evidence, especially in South Asia, shows that foreign bank presence is negatively associated with indicators of access to financial services (see, e.g.,Detragiache et al., 2008). Thus, in countries with underdeveloped financial markets (25th percentile of financial development), the association of foreign bank presence with economic volatility in 2009 fits the expectation that a further slowing down in credit growth would have some negative spillover to economic fluctuation.
Even though a more severe credit crunch occurred in emerging Europe, foreign banks there did not significantly propel mac-roeconomic volatility in 2009. As emphasized earlier, emerging Europe is different from the other regions and includes the countries
Table 5
Predicted Coefficient of Foreign in Explaining Short-term Macroeconomic Fluctuations at Different Levels of Financial Development.
Latin America Asia Emerging Europe
25th 50th 75th 25th 50th 75th 25th 50th 75th GDP Foreign −0.249 −1.252 −2.976 * −4.231 * −3.158 * −0.970 −1.251 * −0.928 −0.638 (1.042) (1.201) (1.728) (2.558) (1.726) (2.429) (0.721) (0.618) (0.689) Foreign in 2008 0.237 −0.700 −2.209 8.342 ** 7.441 ** 3.863 1.781 1.795 1.779 (2.658) (2.566) (2.260) (3.812) (2.925) (3.809) (2.856) (1.884) (1.396) Foreign in 2009 −7.082 ** −7.461 ** −4.573 29.756 *** 14.409 *** −20.000 *** −2.758 −0.468 0.754 (3.116) (3.097) (2.842) (5.766) (4.440) (6.710) (2.252) (1.996) (2.025) Consumption Foreign −0.894 −1.163 −1.626 0.927 −1.070 −5.142 −0.917 −0.065 0.698 (1.189) (1.324) (1.902) (5.077) (3.408) (3.336) (0.816) (0.768) (0.929) Foreign in 2008 −0.233 −1.110 −3.561 −1.082 −0.405 3.330 1.922 2.188 2.372 (2.190) (2.225) (2.505) (7.313) (5.339) (7.670) (3.321) (2.356) (1.997) Foreign in 2009 −8.109 * −8.105 * −6.551 27.495 *** 11.026 −25.301 ** 3.025 1.594 1.276 (4.756) (4.621) (5.148) (9.112) (8.282) (11.992) (4.452) (3.176) (3.034) Investment Foreign −4.294 −8.718 −16.318 * 1.111 1.337 1.797 −4.906 −1.636 1.294 (4.832) (5.661) (8.767) (16.044) (10.626) (11.056) (3.440) (3.004) (3.552) Foreign in 2008 −7.372 −8.021 −3.289 53.299 32.853 −27.040 −5.088 −1.077 2.587 (9.475) (9.583) (9.913) (36.519) (28.576) (21.983) (8.140) (5.980) (5.032) Foreign in 2009 −25.672 ** −29.265 *** −30.726 ** 52.161 27.645 −27.040 −14.894 −9.740 −5.918 (10.590) (11.318) (14.722) (31.685) (26.544) (33.688) (10.064) (8.936) (8.673) Notes: These coefficients are estimated at the 25th, 50th and 75th percentile of financial development in each region separately. The percentiles estimated in the years 2008 and 2009 in each region are used to estimate the coefficients for the corresponding years. The numbers in parentheses are standard errors.*,**and***indicate statistical significance at the 10%, 5% and 1% levels.
with the highest foreign bank shares and those, such as Latvia, that experienced the largest decline in GDP in 2009. This finding can be supported by the behavior of the six large foreign banks, which continued to provide credit during the crisis period in the region (Bonin and Louie, 2016), or the high level of political integration with the European Union (Friedrich et al., 2013).
3.4. Robustness checks
We employ two robustness checks. First, we use the squared value of residuals rather than the absolute value of residuals from the standard growth model as an alternative short-run macroeconomic fluctuation measure and report our findings inTable A3in the Ap-pendix A. Similar to our main results, the coefficient of foreign banks is found to be negative and that of the interaction variable between foreign banks and financial development is found to be positive. A positive association between bank integration and macroeconomic volatility is observed at high levels of financial development, whereas a negative association at low levels of financial development is found but not significant. The regional differences are also observed when the alternative measure of macroeconomic volatility is used.
Second, in order to account for possible endogeneity bias, we follow the instrumental variable (IV) approach and estimate the GDP and consumption volatility models by using the same IVs that are used in the investment model. The results of the IV estimations for GDP and consumption are reported inTable A4in the Appendix A. The findings are similar to the OLS results. It is found that there is a negative association between bank integration and short-term fluctuations in GDP and consumption and that this relationship changes with the level of financial development in the country. Similar to the OLS results, in 2009, the coefficient of the share of foreign banks declines and that of the interaction variables in 2009 increases significantly. The findings with respect to regions are also found to be similar. The predicted coefficients of foreign bank shares at different financial development levels suggest that foreign banks seem to reduce macroeconomic volatility in Latin America regardless of their financial development level. In Asia, a negative association is observed at high development levels, whereas a positive association is observed at low levels of development. Our robustness estimates indicate that foreign banks did not significantly affect macroeconomic volatility in emerging European countries during the sample period.
4. Conclusion
We examine the association between bank integration and macroeconomic volatility using a sample of 24 financially integrated emerging countries over the period 1999–2011. This relationship depends on the level of financial development and is not found to be homogenous across regions. Our findings show a significant and negative relationship between bank integration and the volatility of GDP in Latin America at high levels of financial development, in Asia at low and moderate levels of development, and in emerging Europe at low levels of development. Although foreign banks did not appear to be significantly related to consumption volatility in any region, they seemed to be negatively correlated to investment volatility in the financially well-developed countries in Latin America. During the global financial crisis, significant associations between foreign bank shares and macroeconomic volatility are found in 2009. For example, foreign banks are negatively and significantly associated with the volatility of GDP and its components at almost all levels of financial development in Latin America. In Asia, they are found to be positively related to macroeconomic volatility at low levels but negatively at high levels of financial development. Of all the countries, the global crisis most affected those in emerging Europe, but we did not find any significant association between bank integration and macroeconomic volatility in this period.
Some policy lessons can be learned from our analysis. First of all, designing policies applying to all emerging economies may result in unexpected outcomes, and the regional differences have to be considered. Second, a growing share of foreign banks may be a mixed blessing. As shown byBruno and Hauswald (2014), by reducing lending inefficiencies, foreign banks contribute to the overall financial development of local economies. However, it seems that foreign bank penetration contributes positively to macroeconomic volatility in financially developed emerging economies.
Acknowledgements
We thank Deborah Lucas, conference participants at the IFABS 2017 Oxford Conference and 7th FEBS International Conference, University of Strathclyde, and anonymous referees for helpful comments.
Appendix A
The Standard Growth Model
The growth rates of real GDP, real consumption and real investment expenditures are estimated using the following fixed effects model, as inBekaert et al. (2005):
GROWTHit= i+µt + Xit+ it (3)
where i,µtandXitrepresent country and year fixed effects and a vector of variables affecting the growth rates of countryiat time t,
respectively. These variables include the trade openness of a country measured with the GDP share of total exports and imports (Trade
Openness), international capital flows to a country measured by the private capital-to-GDP ratio (Capital Flows to GDP), external debt
as a percentage of GDP (External Debt to GDP), the rate of population growth (Growth in Population), years of secondary education as a proxy for human capital (Years in Secondary School), the government expenditure-to-GDP ratio (Government to GDP), the
Table A1
Descriptive Statistics of the Variables.
Latin America Emerging Europe Asia South Africa All Countries
Trade Openness 45.80 98.23 85.49 56.78 79.68 (15.82) (36.13) (55.90) (7.14) (44.43) Capital Flows to GDP 3.53 5.53 2.26 1.66 3.91 (2.18) (7.17) (1.66) (1.61) (5.05) Unemployment Rate 8.82 10.20 5.78 24.59 9.17 (3.58) (3.70) (2.92) (1.61) (5.02) Growth in Population 1.29 −0.32 1.47 1.57 0.68 (0.32) (0.73) (0.59) (0.56) (1.04)
Years in Secondary School 5.82 7.11 6.14 5.00 6.42
(0.70) (0.86) (0.99) (0.00) (1.05)
External Debt to GDP 38.44 61.93 39.00 22.57 47.49
(20.62) (28.68) (24.65) (3.83) (27.82)
Government to GDP 13.05 17.62 11.01 19.43 14.62
(3.45) (4.20) (2.24) (1.20) (4.58)
Expected Life (years) 73.98 71.35 69.04 54.29 70.62
(2.43) (2.54) (3.94) (2.54) (4.88)
Inflation Rate 8.14 12.42 5.35 5.89 9.02
(8.03) (23.45) (5.50) (2.32) (16.21)
Local Crisis 4.44 2.67 7.62 0.00 4.44
(20.72) (16.16) (26.66) (0.00) (20.64)
Notes: Standard deviations are reported below the mean values in parentheses. All figures are in percentages except schooling and expected life. Sources: World Development Indicators. The local crisis dummy variable is created using the dataset provided byLaeven and Valencia (2012)and includes all systemic banking, currency and sovereign debt crises.
Table A2
First Stage Growth Panel Regressions.
Dependent Variable: Real Growth Rate in
GDP Private Consumption Investment
Intercept 40.464 112.015 316.857 (64.697) (85.569) (320.313) Trade Openness 6.656*** 6.501*** 28.185*** (1.370) (1.782) (6.796) Capital Flows to GDP 0.028 0.039 0.038 (0.047) (0.062) (0.234) Unemployment Rate −0.279*** −0.504*** −0.420 (0.100) (0.133) (0.480) Growth in Population 0.017 0.003 1.218 (0.836) (1.105) (4.141)
Years in Secondary School 4.445 −1.401 −7.838
(5.304) (7.019) (26.300) External Debt to GDP −3.172*** −3.785*** −10.070*** (0.695) (0.906) (3.374) Government to GDP −0.517 −3.625* 5.836 (1.435) (1.895) (7.132) Log(Expected Life) −13.181 −23.714 −86.586 (14.659) (19.362) (72.599) Log(1+Inflation) −4.393*** −8.439*** −14.231** (1.317) (1.698) (6.579)
Local Crisis Dummy −5.131*** −4.863*** −23.702***
(0.912) (1.204) (4.519)
Log Growth( )†1 0.098* 0.135** −0.052
(0.054) (0.053) (0.056)
Year and Country Fixed Effects Yes Yes Yes
Adjusted R2 0.555 0.462 0.304
F-statistic 10.180*** 7.310*** 4.210***
N 355 355 355
Notes: Log Growth† ( )
1corresponds to the lagged levels of real GDP, real Private Consumption and real Investment for the columns GDP, Private Consumption and Investment, respectively. The numbers in parentheses are standard errors.*,**and***indicate statistical significance at the 10%, 5% and 1% levels, respectively. The coefficients of country and year fixed effects are not reported to save space.
unemployment rate (Unemployment Rate), life expectancy (Log(Expected Life)), the inflation rate Log(1+Inflation)), and a local crisis dummy variable (Local Crisis Dummy). In the model, we also include the lagged values of growth rates in real GDP, real consumption and real investment expenditures.10
See
Table A3
Results of the Macroeconomic Volatility Estimations.
Dependent Variable: Squared Value of the Deviation of the Growth Rate from the Expected Growth Rate in
GDP Private Consumption Investment
Model specified in Eq.(1)
Foreign −34.976 * −55.763 * −968.515 ** (18.087) (31.812) (484.335) Foreign x FinDev 11.140 ** 19.440 ** 290.648 ** (5.313) (9.681) (144.046) Adjusted R2 0.163 0.243 0.075 F-statistics 2.11 *** 1.68 ** 1.55 * p-value 0.001 0.042 0.071
Model specified in Eq.(2)
Foreign −18.525 −42.551 * −942.180 * (15.189) (23.778 531.073 Foreign x FinDev 5.407 14.052 ** 290.392 * (4.339) (7.055) (161.086) Foreign x Y2008 25.271 17.544 −173.624 (60.004) (91.335) (538.821) Foreign x Y2009 −150.397 ** −5.950 −1030.199 (60.370) (254.356) (641.509)
Foreign x FinDev x Y2008 −1.810 1.868 39.340
(14.767) (23.258) (163.190)
Foreign x FinDev x Y2009 41.489 ** 8.904 201.170
(16.546) (63.072) (174.757)
Adjusted R2 0.199 0.252 0.079
F-statistics 2.36 *** 1.61 ** 1.55 *
p-value 0.001 0.042 0.056
Results with Regional Interaction Variables
Dependent Variable: Squared Value of the Deviation of the Growth Rate from the Expected Growth Rate in
GDP Private
Consump-tion
Investment GDP Private
Consumption Investment GDP PrivateConsumption Investment
Latin America Asia Emerging Europe
Model – Eq.(1)with regional dummy variables
Foreign 64.825 * 0.165 1740.755 81.567 81.750 3026.047 −37.093 * −52.089 −1045.891 ** (37.505) (58.319) (1284.689) (103.256) (256.490) (2712.464) (18.968) (35.113) (526.966) Foreign x FinDev −26.872 * −4.338 −702.924 −19.164 −28.399 −705.186 10.864 * 18.832 * 288.056 * (15.153) (20.421) (480.463) (23.312) (57.043) (642.493) (5.707) (10.672) (151.234)
Model – Eq.(2)with regional dummy variables
Foreign 82.402 * 2.008 2054.459 −17.914 41.016 2214.914 −21.396 −48.601 * −1175.752 ** (42.938) (56.030) (1494.415) (78.490) (240.112) (2693.445) (17.050) (27.876) (590.877) Foreign x FinDev −32.540 * −3.989 −789.819 1.692 −18.599 −536.769 4.929 16.000 * 332.955 * (16.989) (20.119) (545.933) (19.000) (53.948) (642.739) (5.201) (9.252) (172.451) Foreign x Y2008 −31.940 38.270 −2089.315 158.624 * −188.914 5759.027 92.266 106.695 199.632 (46.984) (38.556) (1337.800) (84.004) (140.790) (3953.913) (124.037) (188.026) (1113.972) Foreign x Y2009 −159.442 ** −138.628 −2335.894 1260.562 *** 1682.863 ** 5023.667 −171.977 379.105 371.146 (75.279) (135.153) (1588.853) (280.022) (662.564) (3743.202) (126.393) (477.705 (1474.041) Foreign x FinDev x Y2008 12.170 −13.138 686.571 −28.391 53.818 −1287.832 −18.793 −22.144 −56.794
(14.402) (12.255) (417.724) (19.265) (34.178) (852.646) (31.330) (47.949) (293.638) Foreign x FinDev x Y2009 37.770 * 12.131 555.480 −297.836 *** −428.388 ** −1161.272 47.789 −88.991 −153.987
(21.701) (40.499) (504.425) (68.531) (175.134) (791.736) (32.587) (118.966) (343.810) Notes: The numbers in parentheses are standard errors.*,**and***indicate statistical significance at the 10%, 5% and 1% levels, respectively. To save space, the coefficients of the control variables (financial development, bank concentration, change on real exchange rate), intercept and year fixed effects are not reported.
10Modeling growth is difficult in time series analysis. Several variables affect growth, and some econometric problems, such as endogeneity, arise. We follow the solution suggested bySims (1980)and use the lagged values of a dependent variable as an explanatory variable.
References
Aghion, Philippe, Banerjee, Abhijit, Piketty, Thomas, 1999. Dualism and macroeconomic. Q. J. Econ. 114, 1359–1397.
Aghion, Philippe, Angeletos, George-Marios, Banerjee, Abhijit, Manova, Kalina, 2010. Volatility and growth: credit constraints and composition investment. J. Monet. Econ. 57, 246–265.
Badia Marialuz, M., Segura-Ubiergo, Alex, 2014. Real Exchange Rate Appreciation in Emerging Markets: Can Fiscal Policy Help? IMF Working Papers 14/1. Beck, Thorsten, Demirgüx-Kunt, Aslı, Maksimovic, Vojislav, 2004. Bank competition and access to finance: international evidence. J. Money Credit Bank. 36, 627–648. Beck, Thorsten, Lundberg, Mattias, Majnoni, Giovanni, 2006. Financial intermediary development and growth volatility: do intermediaries dampen or magnify shocks.
J. Int. Money Finance 25, 1146–1167.
Beck, Thorsten, Buyukkarabacak, Berrak, Felix, Rioja, Valev Neven, T., 2012. Who gets the credit? And does it matter? household vs. Firm lending across countries. J. Macroecon. 12, 1–46.
Bekaert, G., Harvey, C.R., Lundblad, C., 2005. Does financial liberalization spur growth? J. Financ. Econ. 77, 3–55.
Bekaert, Geert, Harvey, Campbell R., Lundblad, Christian, 2006. Growth volatility and financial liberalization. J. Int. Money Finance 25, 370–403. Bonin, John P., Louie, Dana, 2017. Did foreign banks stay committed to emerging Europe during recent financial crises? J. Comp. Econ. 45, 793–808. Braun, Matías, Larrain, Borja, 2005. Finance and the business cycle: international, inter-industry evidence. J. Finance 60, 1097–1128.
Breen, Richard, García-Peñalosa, Cecilia, 2005. Income inequality and macroeconomic volatility: an empirical investigation. Rev. Dev. Econ. 9, 380–398. Bremus, Franziska, Buch, Claudia M., 2015. Banking Market Structure and Macroeconomic Stability: Are Low Income Countries Special? Pacific Econ. Rev. 20,
73–100.
Bruno, Valentina, Hauswald, Robert, 2014. The real effect of foreign banks. Rev. Financ. 18, 1683–1716.
Buch, Claudia M., Neugebauer, Katja, 2011. Bank-specific shocks and the real economy. J. Bank. Financ. 35, 2179–2187.
Caballero, Ricardo J., Krishnamurthy, Arvind, 2001. International and domestic collateral constraints in a model of emerging market crises. J. Monet. Econ. 48, 513–548.
Cetorelli, Nicola, Gambera, Michele, 2001. Banking market structure, financial dependence and growth: international evidence from industry data. J. Finance 56, 617–648.
Cetorelli, Nicola, Goldberg, Linda S., 2011. Liquidity management of US global banks: internal capital markets in the great recession. J. Int. Econ. 88, 299–311. Cetorelli, Nicola, Goldberg, Linda S., 2012. Banking globalization and monetary transmission. J. Finance 67, 1811–1843.
Chen, Guodong, Wu, Yi, 2014. Bank Ownership and Credit Growth in Emerging Markets During After the 2008-09 Financial Crisis - a Cross-regional Comparison. IMF Working Paper WP/14/171.
Claessens, Stijn, Van Horen, Neeltje, 2014. Foreign banks: trends and impact. J. Money Credit Bank. 46, 295–326.
Clarke, George R.G., Cull, Robert, María Soledad, Martínez Pería, 2006. Foreign bank participation and access to credit across firms in developing countries. J. Comp. Econ. 34, 774–795.
Cull, Robert, María Soledad, Martínez Pería, 2013. Bank ownership and lending patterns during the 2008-2009 financial crisis: evidence from Latin America Eastern Europe. J. Bank. Financ. 37, 4861–4878.
De Haas, Ralph, van Lelyveld, Iman, 2014. Multinational banks and the global financial crisis: weathering the perfect storm? J. Money Credit Bank. 46, 333–364. Denizer, Cevdet, Iyigun, Murat F., Owen, Ann L., 2002. Finance and macroeconomic volatility. J. Macroecon. 2, 1–32.
Detragiache, Enrica, Tressel, Thierry, Gupta, Poonam, 2008. Foreign banks in poor countries: theory evidence. J. Finance 67, 2123–2160.
Didier, Tatiana, Schmukler, Sergio L., 2014. Financial Development in Asia: Beyond Aggregate Indicators. World Bank Policy Research Working Paper Series, pp. 6761. Dynan, Karen E., Elmendorf, Douglas W., Sichel, Daniel E., 2006. Can Financial Innovation Help to Explain the Reduced Volatility of Economic Activity? J. Monet.
Econ. 53, 123–150.
Easterly, William, Islam, Roumeen, Stiglitz, Joseph E., 2001. Shaken and stirred: explaining growth volatility. The World Bank’S 12th Annual Bank Conference on
Table A4
Predicted Coefficient of Foreign with IV Estimations for GDP and Private Consumption Regression Models. Panel A: No Regional Dummies Panel B: With Regional Dummies
Latin America Asia Emerging Europe
GDP Private
Consumption GDP PrivateConsumption GDP PrivateConsumption GDP PrivateConsumption
Model – Eq.(1)without crisis
Foreign −4.732 ** −7.433 *** 5.511 1.625 −10.874 20.796 −6.225 ** −6.289 *
(2.400) (2.884) (4.509) (5.483) (14.734) (22.220) (2.560) (3.408) Foreign x FinDev 1.532 ** 2.459 *** −2.214 −0.978 2.310 −5.336 1.720 ** 1.991 **
(0.694) (0.838) (1.639) (1.925) (3.405) (5.102) (0.741) (1.002)
Model – Eq.(2)with crisis dummies
Foreign −2.998 −6.850 ** 7.955 * 1.681 −20.354 * 19.548 −4.610 * −6.753 ** (2.280) (2.694) (4.797) (5.451) (12.087) (21.051) (2.452) (3.223) Foreign x FinDev 0.974 2.224 *** −2.915 * −0.862 4.348 −5.026 1.145 2.031 ** (0.664) (0.792) (1.714) (1.911) (2.967) (4.883) (0.728) (0.987) Foreign x Y2008 1.293 1.634 −1.550 (7.584) (27.994) * −28.455 6.888 9.161 (7.661) (8.775) (5.855) (5.099) 15.628 28.789) (16.491) (19.101) Foreign x Y2009 −19.148 *** −2.842 −24.317 *** −14.489 163.429 *** 141.197 *** −20.427 * 26.013 (5.983) (14.483) (7.996) (15.504) (34.682) (50.401) (10.518) (26.335) Foreign x FinDev x Y2008 0.225 0.147 0.706 −2.699 * −4.951 7.499 −1.094 −1.912
(1.913) (2.236) (1.529) (1.570) (3.812) (7.336) (4.125) (4.804) Foreign x FinDev x Y2009 4.834 *** 0.803 6.044 ** 2.577 −39.469 *** −35.069 *** 5.290 ** −6.427
(1.596) (3.665) (2.415) (5.090) (8.527) (12.570) (2.690) (6.547)
Notes: The numbers in parentheses are standard errors.*,**and***indicate statistical significance at the 10%, 5% and 1% levels, respectively. To save space, the coefficients of the control variables (financial development, bank concentration, change on real exchange rate), intercept and year fixed effects are not reported.
Development Economics, The International Bank for Reconstruction Development 191–211.
Foster, Andrew D., 1995. Prices, credit markets child growth in low-income rural areas. Econ. J. 105, 551–570.
Friedrich, Christian, Schnabel, Isabel, Zettelmeyer, Jeromin, 2013. Financial integration and growth - why is Emerging Europe different? J. Int. Econ. 89, 522–538. Giannetti, Mariassunta, Ongena, Steven, 2012. “Lending by Example": direct and indirect effects of foreign banks in emerging markets. J. Int. Econ. 86, 167–180. Goldberg, Linda, Dages, B., Gerard, Kinney, Daniel, 2000. Foreign domestic bank participation in emerging markets: lessons from Mexico Argentina. Federal Reserve
Bank of New York, Economic Policy Review 6, 17–36.
Gormley, Todd A., 2010. The impact of foreign bank entry in emerging markets: evidence from India. J. Financ. Intermed. 19, 26–51. Gormley, Todd A., 2014. Costly information, entry, and credit access. J. Econ. Theory 154, 633–667.
Hnatkovska, Viktoria V., Loayza, Norman V., 2005. Volatility and growth. In: Aizenman, J., Pinto, B. (Eds.), Managing Economic Volatility Crises: A Practitioner’S Guide. Cambridge University Press, Cambridge.
Jayaratne, Jith, Strahan, Philip E., 1996. The finance-growth Nexus: evidence from bank branch deregulation. Q. J. Econ. 101, 639–670.
Kalemli-Ozcan, Sebnem, Sorensen, Bent, Volosovych, Vadym, 2014. Deep financial integration and macroeconomic volatility. J. Eur. Econ. Assoc. 12, 1558–1585. Kamil, Herman, Rai, Kulwant, 2010. The Global Credit Crunch Foreign Banks’ Lending to Emerging Markets: Why Did Latin America Fare Better? IMF Working Paper
WP/10/102.
Koren, Miklós, Tenreyro, Silvana, 2007. Volatility and development. Q. J. Econ. 122, 243–287.
Kose, M. Ayhan, Prasad, Eswar S., Taylor, Ashley D., 2011. Thresholds in the process of international financial integration. J. Int. Money Finance 30, I147–179. Laeven, L., Valencia, F., 2012. Systemic Banking Crises Database: An Update. IMF Working Paper WP/12/163.
Laursen, Thomas, Mahajan, Sandeep, 2005. Volatility, income distribution, and poverty. In: Aizenman, J., Pinto, B. (Eds.), Managing Economic Volatility Crises: A Practitioner’S Guide. Cambridge University Press, Cambridge.
Levine, Ross, Loayza Norman, V., Beck, Thorsten, 2000. Financial intermediation and growth: causality causes. J. Monet. Econ. 46, 31–77.
Magud, Nicolas E., Sosa, Sebastian, 2010. When and Why Worry About Real Exchange Rate Appreciation? The Missing Link Between Dutch Disease Growth. IMF Working Paper WP/10/271.
Manganelli, Simone, Popov, Alexander, 2015. Financial development, sectoral reallocation, and volatility: international evidence. J. Int. Econ. 96, 323–337. Moguillansky, Graciela, Studart, Rogerio, Vergara, Sebastián, 2004. Foreign banks in Latin America: a paradoxical result. CEPAL Rev. 82, 19–34.
Morgan, Donald, Strahan, Philip E., 2004. Foreign Bank entry and business volatility: evidence from U.S. States and other countries. In: Ahumada, A., Fuentes, J.R. (Eds.), Banking Market Structure Monetary Policy. Central Bank of Chile, Santiago, Chile, pp. 241–269.
Morgan, Donald, Rime, Bertrand, Strahan, Philip E., 2004. Bank integration state business cycles. Q. J. Econ. 119, 1555–1584.
Raddatz, Claudio E., 2007. Are External Shocks Responsible for the Instability of Output in Low-Income Countries? J. Dev. Econ. 84, 155–187. Rose, Andrew K., Spiegel, Mark M., 2009. International financial remoteness and macroeconomic volatility. J. Dev. Econ. 89, 250–257. Schnabl, Philipp, 2012. The international transmission of bank liquidity shocks: evidence from an emerging market. J. Finance 67, 897–932. Shleifer, Andrei, Vishny, Robert W., 2010. Unstable banking. J. Financ. Econ. 97, 306–318.
Sims, C.A., 1980. Macroeconomics and reality. Econometrica 48, 1–48.
Vogel, Ursula, Winkler, Adalbert, 2012. Do foreign banks stabilize cross-border bank flows and domestic lending in emerging markets? Evidence from the global financial crisis. Comp. Econ. Stud. 54, 507–530.
Wagner, W., 2010. Loan market competition and bank risk taking. J. Financial Serv. Res. 37, 71–81.