(1)İstanbul Bilgi Üniversitesi, İşletme Fakültesi, İşletme Bölümü; [email protected] (2)Doğuş Üniversitesi, Mühendislik Fakültesi, Endüstri Mühendisliği Bölümü; [email protected]
Geliş/Received: 17-06-2016, Kabul/Accepted: 25-08-2016
Does Gender Equality Lead to Better-Performing Economies?
A Bayesian Causal Map Approach
Toplumsal Cinsiyet Eşitliği Daha İyi İşleyen Ekonomilere Yol Açar Mı? Bayes Nedensellik Ağları Analizi
Yelda YÜCEL
(1), Şule ÖNSEL EKİCİ
(2)ABSTRACT: This study explores the existence of relationships between gender inequalities –represented by the components of the World Economic Forum (WEF) Global Gender Gap Index– and the major macroeconomic indicators. The relationships within gender inequalities in education, the labour market, health and the political arena, and between gender inequalities and gross macroeconomic aggregates were modelled with the Bayesian Causal Map, an effective tool that is used to analyze cause-effect relations and conditional dependencies between variables. A data set of 128 countries during the period 2007–2011 is used. Findings reveal that some inequalities have high levels of interaction with each other. In addition, eradicating gender inequalities is found to be associated with better economic performance, mainly in the form of higher gross domestic product growth, investment, and competitiveness.
Keywords: Gender, Development, Inequality, Employment, Education JEL Classifications: E24, J16, I24
ÖZ: Bu çalışmada Dünya Ekonomik Forumu (WEF) Küresel Cinsiyet Farkı İndeksi‘nin bileşenleri kullanılarak cinsiyet eşitsizliği ile temel makro ekonomik göstergeler arasında bir ilişki olup olmadığı incelenmektedir. Eşitsizlik, eğitim, işgücü piyasası, sağlık ve politika alanlarındaki cinsiyet eşitsizliği ile makroekonomik değişkenler arasındaki ilişkiler, değişkenler arası nedensel ilişkileri incelemek için etkin bir yöntem olarak tanımlanabilecek Bayes Nedensel Ağları yardımı ile modellenmiş ve incelenmiştir. Bunun için 2007-2011 dönemini kapsayan zaman aralığında 128 ülkenin verileri kullanılmıştır. Bulgular bazı alanlardaki eşitsizliklerin yüksek düzeyde birbiri ile ilişkisi olduğunu ortaya koymaktadır. Öte yandan, cinsiyet eşitsizliklerinin ortadan kaldırılmasının, özellikle ülkelerin GSMH, yatırımlar ve rekabet düzeyi açısından daha iyi ekonomik sonuçlara yol açacağı saptanmaktadır. Anahtar Kelimeler: Cinsiyet, Kalkınma, Eşitsizlik, İstihdam, Eğitim
1. Introduction
This study aims to explore the existence of relationships between gender inequalities and major macroeconomic indicators such as gross domestic product growth, investment and competitiveness. Women’s inclusion and engagement in an economy (often on unequal grounds with men and through subordination and discriminatory practices) is a multidimensional phenomenon that affects the economy’s performance
and is at the same time affected by economic policies. Women are not only engaged in the economy through their income-generating activities in the labour market but also through their societal roles as caregivers and unpaid household workers, which have substantial, but unrecognized economic value.
Depicting the relationship between gender and an economy’s performance is a very difficult task, not only because of the problems associated with measuring ‘economic performance’ on its own but also because of women’s multistage involvement in the economy owing to their different and conflicting roles. A very rich literature examining the relationship between inequality and economic growth developed and the gender inequality and economic growth in particular, is a growing area of research (Berik et al. 2009; Cuberes and Teignier 2014; Kabeer and Natalie 2013; Seguino 2000a; 2000b; 2002). Nevertheless, despite some consensus, much of the findings still exhibit a diversity because of the chosen indicators, methodologies, data, time frames, structure of the economies, mechanism by which the two factors affect each other, variety of the macroeconomic policies implemented, level of development, geography and cultural features as well as the patriarchal structures in the countries.
This study differentiates from the existing studies by aiming to explore the relationship between various dimensions of the economy and the gender inequalities in a systematic model, incorporating macro aggregates such as the Gross Domestic Product (GDP) per capita, the exports-to-GDP ratio, the ratio of net foreign direct investment to GDP and gross capital formation as a percentage of GDP. A novel methodology, Bayesian Causal Map (BCM) was used, revealing the cause-and-effect relationships between the variables in a dynamic setting. This method unfolds not only the cause and effect relationships, but also how much change would be expected in response to another variable from a system perspective, thus, providing a practical tool for policy making processes.
2. Gender Inequalities and Economic Development
Macroeconomics realm is represented mainly by production, prices, the public sector, the private sector, the external sector and the financial sector. In their extensive literature survey of inequality, development and growth, Berik et al. (2009) discuss the gendered structure of the macroeconomic environment and thus the way it affects and reproduces inequalities within a society, while at the same time having implications for economic development. Authors provide an overview of the mixed impacts of macroeconomic policies on women’s employment and wage gaps and how trade and investment liberalization have different impacts on men and women in terms of labour markets, domestic workloads, literacy rates, poverty reduction and income distribution. The variety found in the evidence laid out in the article suggests that the macroeconomic effects of gender inequality can be twofold, stimulating growth in some fields and reducing it in others, depending on many factors, including the measures chosen, the transmission mechanism, the time period of the research, and the structure of the economies studied.
Studies on gender inequalities and economic growth mostly cluster around how economic growth affected gender inequalities or whether there was a reverse or two- way causation between the variables (Cuberes and Teignier 2014; Kabeer and Natalie 2013). Most of the studies found causation from inequalities to growth as in the case of wage inequalities boosting growth observed in fast growing economies of East Asia and China (Seguino 2000b; 2002). In a very few studies, economic growth was found to be leading to improvement in gender equality; however, those findings were mixed and far from convincing (Kabeer and Natalie 2013).
Research centred on how gender inequality affects economic growth investigates the inequalities basically in three fields: education, labour market participation and wages (Kabeer and Natalie 2013). One of the popular views acknowledged in the literature suggests that discrimination in labour markets and gaps in education will reduce economic growth due to inefficient or improper utilization of human capital (Klasen 1999; Busse and Spielmann 2006) but the extent and the significance of the impact may depend very much on geographical and cultural differences and development levels (Kabeer and Natalie 2013).
Specifically, much research has tracked inequalities in the labour market to assess their implications for growth and development. These studies focus on development strategies, labour market adjustments and wage gaps between women and men (Çağatay and Özler 1995; Başlevent and Onaran 2004; Wanjala and Were 2009; İlkkaracan 2012). Over the last few decades, many export-oriented and rapidly growing developing countries have seen enormous expansion of informal, vulnerable job sectors that attract significant numbers of female employees (Berik et al. 2009). The export-oriented growth models of the post–1980 period, the dominant growth strategy to date, drew the attention of researchers to international trade and gender relations. A neoclassical approach in trade theory, celebrated by Hekscher-Ohlin, Stolper Samuelson, and Factor Price Equalization theorems, anticipates an increase in the returns to the abundant factor, which is unskilled labour in the developing country context and in women’s labour in particular. Those theories therefore imply a reduction in gender inequalities in terms of employment and wages (Elson et al. 2007). This view has been refuted by several studies pointing at increasing discrimination and wage inequalities as a result of export oriented economic models (Kongar 2007; Elson et al. 2007).Women are squeezed into a narrow range of occupations with low pay and poor working conditions (Elson et al. 2007), despite a general trend of increasing women’s employment in recent years. Women’s labour becomes a cost reducing factor, a source of achieving competitive advantage; and wage differentials between female and male workers should be interpreted as connected to the export strategy of some countries that rely on low wage women workers (Seguino 1997; 2000b; Busse and Spielmann 2006). Another strand of thought asserts that reducing gender inequality in education increases comparative advantage by improving the skills and productivity of the labour force (Busse and Spielmann 2006; Busse and Nunnenkamp 2009). By improving workers’ skills, education acts as pull factor for
foreign direct investment (FDI), as is evident in Busse and Nunnenkamp’s study (2009),which shows a positive relation between all levels of education and FDI inflows being most evident in middle income host countries.
3. Measuring Gender Development and Inequalities
It has long been acknowledged in standard and alternative economic theories that conventional indicators of development (e.g. GDP, gross national income, consumption, disposable income, employment) fall short of explaining individual and societal welfare, much less addressing inequalities in society, whether open or hidden (Boarini et al. 2006; Stiglitz et al. 2009; Dasgupta 2010; OECD 2011).
As a result of a change in the development paradigm from an economic-centred perspective to a human-centred one, the United Nations Development Programme (UNDP) introduced several new indices starting from 1990s, two of which aimed to address gender inequalities in the assessments of development levels of the countries. These were the Gender Development Index (GDI) and the Gender Inequality Index (GII), whose foundations lay in the theoretical contributions made by Sen (1985) and Nussbaum (2001) to developing a gender well being approach within the ‘capabilities framework’. The GDI simply adjusted the HDI indicators mentioned above for gender disparities, while the GII included broader measures of gender inequality including women’s public participation in decision-making processes, maternal mortality rate, adolescent birth rate, secondary education measures and labour force participation rates.
Several other indices about gender well-being and inequalities were later developed, two of them being the Gender Equity Index (GEI) proposed by Social Watch (2007) and the Global Gender Gap Index (GGI) proposed by the World Economic Forum (WEF) (2006). Another index, the Social Institutions and Gender Index (SIGI), proposed by the OECD Development Centre in 2009, approaches the notion of gender inequalities from a totally different angle, through social norms in particular, and incorporates into the index indicators about the inequalities inherent in institutions (Jutting et al. 2008).
In our study, among the vast variety of gender inequality indices we chose WEF Global Gender Gap Index. The GGI provided us with the most comprehensive list of inequality indicators as well as dimensions, in contrast to the other cited gender indices. It incorporated conceptually almost all elements of the GDI, GII, and GEI indices, being available in time series and for more than 130 countries on average for each year. Gender inequalities are represented by 14 different variables in the major four areas: economic participation and opportunity; educational attainment; health and survival; and political empowerment.
4. Data and Methodology
To establish the possible linkages between gender inequalities in a society and the outcomes in the macroeconomic aggregates, we employed a methodology that allows for both quantitative data and subjective valuations by experts in the field to be
utilised. Interactions both within the components of the GGI and the relationship between each component with major macroeconomic variables have been investigated and modeled with the Bayesian Causal Map (BCM) using a data set of 128 countries from the period 2007–2011.
BCMs are useful tools for modeling and analysing a domain especially when there is great uncertainty. Analysis of cause-effect relations and conditional dependencies between variables can be possible BCMs. These relations can be better understood and anaylsed by the help of graphical causal structure of BCMs. Moreover, they also provide good estimates even when some predictors are missing (Nicholson et al. 2008, Nadkarni and Shenoy 2001). They are also more robust when compared to other methods while studying with data that contain noise (Wu 2010).
From a systems perspective, BCMs can conduct efficient what-if analysis by dealing with more than one variable at a time. In the literature, the studies that use BCM as an analysis tool increase day by day due to their semantic clarity and understandability (Friedman et al. 1997). BCMs combine expert knowledge with data and they are recognized as appropriate representations of reality depending on their probabilistic structure (Pourret 2008; Onisko 2008). Making predictions described in terms of probabilities and percentages is possible with BCM (Anderson and Vastag 2004). Moreover, they are helful in dealing with partial information and uncertainty, allowing the decision maker to include his or her assessments into the variables for which the information is known (Mishra, Kemmerer and Shenoy 2001).
Building a BCM involves two steps: (1) model specification and (2) parameter estimation (Blodgett and Anderson 2000). The first step in constructing a BCM is about gathering the causal knowledge of experts about the analysed domain. The important thing in this step is to make it possible to understand the causal relations between variables (Nadkarni and Shenoy 2004). The second step, which is known as parameter learning, requires feeding the network with the related data in order to assign conditional probability values to each variable. BCMs use both qualitative and quantitative data which makes them more efficient when compared to other methods. The qualitative part of the method comes from the expert knowledge that constitues the structure and quantitative part comes from the probabilities identified and revised using hard data (Ekici and Önsel 2013).
The most important assumption of a BCM is that the joint probability distribution for all variables in the network can be obtained by multiplying the conditionals for each variable (Mishra et al. 2001). The structure of a BCM infers that the value of a node is conditional only on the values of its parent nodes, so the formula becomes as follows:
i i i n P x Parents x x x x P( 1, 2,...., ) ( / ( )) (1)In this study, the macroeconomic indicators of the model and the possible relationships between macroeconomic indicators and gender were initially determined in line with the existing literature survey summarised in the previous sections. For each country, Gross Domestic Product (GDP) per capita, the exports-to-GDP ratio, the ratio of net foreign direct investment to GDP, and gross capital formation as a percentage of GDP were taken from the World Bank database, as the major macro aggregates. The Global Competitiveness Index produced by WEF has been incorporated into the model to see whether gender (in)equality in society affects the comparative advantage of a country in the global setting. The population growth variable has been chosen to test the arguments about the negative relationship between gender equality and the fertility rate (Klasen 1999). The variable of women in nonagricultural paid labour as a percentage of the total labour force was taken from the WEF database and incorporated into the model to disentangle women’s wage employment from agricultural sector employment, which is mostly unpaid.
The inequalities in WEF indices were represented as ratios of women over men in most cases and the definitions of the components of the sub-components of the GGI are as follows:
Economic Participation and Opportunity: Five sub-indices constitute this category: the ratio of female labour-force participation (LFP) over male LFP; wage equality between women and men for similar work (converted to a female-over-male ratio); the ratio of estimated female earned income over male income; the ratio of female legislators, senior officials, and managers over the male value; and the ratio of female professional and technical workers over the male value.
Educational Attainment: Four key elements of educational attainment are the ratios of female literacy, female net primary level enrollment, female net secondary level enrollment and female gross tertiary level enrollment as compared to the rates for men.
Health and Survival: This category is represented by the sex ratio at birth (converted to female-over-male ratio) and the ratio of female healthy life expectancy over the male value.
Political Empowerment: Three elements constitute the political empowerment indicator: the ratio of women with seats in parliament, the ratio of women at the ministerial level and the ratio of the number of years with a female head of state or government (during the last fifty years), each over the respective male value. Having determined the variables of the model, in the next step, the possible causal relationships among these indicators were discussed with the help of a group of experts.1 Possible connections between the indicators were determined through
1 One of the four experts interviewed is the Chief Economist and coordinator of the economic research in one of the biggest companies in Turkey, while the second expert is a professor of economics specialising in public finance, gender-responsive budgeting, labour markets, and the defence sector; the third expert is
to-face interviews with the experts, carried out one at a time. In the construction of the final map, majority rule has been applied to the expert views on each of the indicators in order to determine the causal relationships between the variables. After the determination of the causal relationships between variables, the conditional probability values of each variable had to be identified. In order to do this, all of the variables were discretised into three levels and the hard data gathered was fed into the network. Although BCMs create a very efficient language for building models of domains with inherent uncertainty, it is a tedious job to perform the evidence generation process even for a very simple BCM (Jensen 2002). For this purpose, Netica (www.norsys.com) was chosen among several commercial software tools to use in this study to generate conditional probability tables. Counting-learning algorithm that is considered as ‘simple and a true Bayesian learning algorithm’ was chosen for parameter learning. Finally, the causal relations quantified by conditional probabilities were analysed and several what-if analyses were conducted by the BCM.
5. BCM Analysis
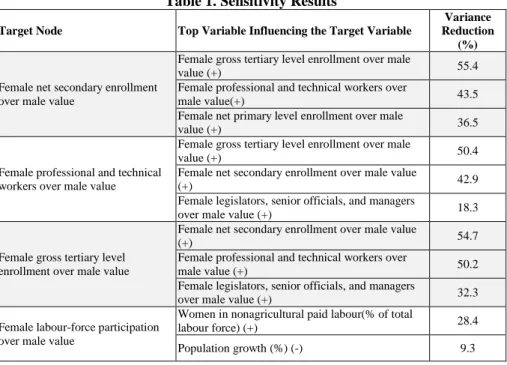
The resulting map yielded eighteen decision variables, thirty three relationships between variables and 1,056 conditional probabilities. The number of years with a female head of state or government (over the last fifty years) over the male value, the ratio of women at the ministerial level over the male value and sex ratio at birth (converted to female-over-male ratio) were left out of the model since there was no link addressing these variables. The resulting network is given in Figure 1. Once a Bayesian network is constructed, sensitivity analysis can be performed in Netica, allowing for the identification of the variables that most affect the target variable. The results of the sensitivity analysis for each variable, along with the top three variables influencing each one, are given in Table 1. If the output variable is defined as Q and input variables as F, then, the variance reduction value can be calculated for Q when there is an increase in terms of certainty in F. That is, when an extra information about the state of an input node is given to the network, the variance of the output node is expected to decrease (Nash et al. 2013). In other words, variance reduction can be written as the difference between the variance of the output node (var(Q)) and the variance of the output node given the input node (Var(Q|F)). This “variance reduction” measure can be used to find the variable that has the highest explanatory power over the output variable. The sensitivity results given in Table 1 can be used to analyse the system as a whole (Ekici and Ekici, 2015).
As a result, for example, although a direct relationship does not exist between ‘Female professional and technical workers’ and the Global Competitiveness Index, an increase in the former is expected to lead to a change in the latter through the use of two different variables (Figure1, Table1).
a professor of economics specialising in gender inequalities, women’s employment, labour markets, and social policy, and our last expert is assistant professor of economics, who specialises in economics of gender, economic crisis, labour markets and policies.
F ig ure 1 . T he B a y esia n Ca us a l M a p
6. Empirical Findings
Key findings from the study reveal that inequalities against women have undeniable impacts on a country’s economic structure.
Educational Attainment, Health, and Survival
Starting with the educational area, the BCM analysis (Figure 1) and sensitivity analyses (Table 1) reveal that the female net secondary level enrollment ratio is most affected by the female gross tertiary enrollment variable, followed by the female professional and technical workers’ ratio and the female net primary level enrollment ratio. All three inequality variables have notable effects on the former ratio. This suggests that an increased proportion of women in primary school and higher education levels, as well as a greater number of women in professional and technical jobs, trigger more women to take part in lower levels of education as well. Similar findings are also observed in the women’s gross tertiary level education ratio, where the female secondary enrollment ratio and the ratios of female professionals, technical workers, high ranking officials, top level managers, and legislators do have a significant impact. One of the major outcomes of the study is thus that inequalities against women with respect to men at all levels of education can be corrected by increasing the number of women at every education level, as well as by increasing women’s presence in professional and higher ranking employment that provides decision making power to women in public life. In addition, eradicating inequalities in educational levels (especially tertiary and secondary levels) and increasing the number of female professional and technical workers has been found to create a notable improvement in the ratio of female life expectancy over males, a key indicator reflecting health conditions. Although this affirmative relationship by no means provides adequate information on women’s health conditions, it can serve as a good justification for increasing women’s education and employment levels.
Table 1. Sensitivity Results
Target Node Top Variable Influencing the Target Variable
Variance Reduction
(%)
Female net secondary enrollment over male value
Female gross tertiary level enrollment over male
value (+) 55.4
Female professional and technical workers over
male value(+) 43.5
Female net primary level enrollment over male
value (+) 36.5
Female professional and technical workers over male value
Female gross tertiary level enrollment over male
value (+) 50.4
Female net secondary enrollment over male value
(+) 42.9
Female legislators, senior officials, and managers
over male value (+) 18.3
Female gross tertiary level enrollment over male value
Female net secondary enrollment over male value
(+) 54.7
Female professional and technical workers over
male value (+) 50.2
Female legislators, senior officials, and managers
over male value (+) 32.3
Female labour-force participation over male value
Women in nonagricultural paid labour(% of total
labour force) (+) 28.4
Target Node Top Variable Influencing the Target Variable
Variance Reduction
(%)
GCI (+) 5.23
Women in nonagricultural paid labour(% of total labour force)
Female labour-force participation over male
value(+) 25.7
Female net secondary enrollment over male value
(+) 17.7
Female net primary level enrollment over male
value (+) 11.7
Female legislators, senior officials, and managers over male value
Female gross tertiary level enrollment over male
value (+) 28
Female net secondary enrollment over male value
(+) 15.1
Female professional and technical workers over
male value (+) 12.1
Female literacy rate over male value
Female net primary level enrollment over male
value (+) 26.6
Female net secondary enrollment over male value
(+) 9.81
Female gross tertiary level enrollment over male
value (+) 5.65
GCI
Female net secondary enrollment over male value
(+) 19.7
Female gross tertiary level enrollment over male
value (+) 18.9
Exports of goods and services (% of GDP)(+) 11.9
Female net primary level enrollment over male value
Female net secondary enrollment over male value
(+) 37
Female literacy rate over male value (+) 26.2
Female gross tertiary level enrollment over male
value (+) 21.3
Female healthy life expectancy over male value
Female gross tertiary level enrollment over male
value (+) 16.3
Female net secondary enrollment over male value
(+) 8.44
Female professional and technical workers over
male value (+) 8.39
Exports of goods and services (% of GDP)
GCI (+) 12.2
GDP per capita (current US$) 7.87
Female net secondary enrollment over male value
(+) 1.77
Gross capital formation (% of GDP)
Women in nonagricultural paid labour(% of total
labour force) (+) 9.34
Exports of goods and services (% of GDP) (+) 7.18 Female labour-force participation over male value
(+) 3.53
Net foreign direct investment (% of GDP)
Gross capital formation (% of GDP)(+) 7.83
GCI (-) 1.05
Women in nonagricultural paid labour(% of total
labour force) (-) 1.05
GDP per capita (current US$)
Women in nonagricultural paid labour(% of total
labour force) (+) 9.34
Target Node Top Variable Influencing the Target Variable
Variance Reduction
(%)
Female labour force participation over male value
(+) 3.53
Wage equality between women and men for similar work (converted to female-over-male ratio)
Female professional and technical workers over
male value 6.4
Estimated female earned income over male value 5.71
GCI 2.82
Population growth (%)
GDP per capita (current US$) 10.4
Female labour-force participation over male value 5.74 Women in nonagricultural paid labour(% of total
labour force) (-) 1.14
Estimated female earned income over male value
Wage equality between women and men for similar
work (converted to female-over-male ratio) (+) 2.65 Female professional and technical workers over
male value 0.12
GCI 0.05
Women with seats in parliament over male value
Female gross tertiary level enrollment over male
value 1.82
Female professional and technical workers over
male value (+) 0.858
Female legislators, senior officials, and managers
over male value (+) 0.715
Economic Participation and Opportunity:
When inequalities in the labour market are examined via BCM analysis, significant interaction between the labour market indicators is observed, in addition to the notable impact of education variables on employment and labour force participation discrepancies. Increasing women’s labour force participation, for example, is found to be the most significant factor prompting further employment for women in nonagricultural paid sectors, which is an expected outcome (Table 1). Another factor promoting women’s employment in nonagricultural sectors and in high ranking positions such as legislators, senior officials and managers appears to be increasing the number of women in all levels of education, given our set of variables. More women in tertiary level education triggering improvement in the ratio of female professional and technical workers is an expected outcome of higher level education. In our model, the variance in women’s LFP is most reduced by the women’s employment in paid nonagricultural sectors ratio (Table 1), implying that each variable has a reciprocal explanatory power on the other.
Macroeconomic Indicators:
The variance in GDP per capita, the most prominent indicator of development in mainstream approaches, is reduced most significantly by the women’s employment in paid nonagricultural sectors ratio, followed by the export-to-GDP and female labour force participation ratios, respectively (Table1). All have positive signs, implying that an improvement in the latter will lead to improvement in the target variable. In the context of this study, it would not be surprising to find a weaker causation with an inequality variable and a gross magnitude such as GDP, which is determined by many factors beyond this study. Nevertheless, a linkage between inequalities against women in the labour market and GDP per capita is detected, which is very important, as it
shows that inequalities against women negatively affect the overall economy. This finding serves as evidence in favour of the positive contribution of women’s labour in total economic growth and more specifically as a rationale to target an increase in women’s employment when designing policy.
Gross capital formation as percentage of GDP is affected by the same variables affecting GDP per capita, in the same order of explanatory power: women’s employment in paid nonagricultural sectors ratio, the export-to-GDP ratio, and the female labour force participation ratio. Investment levels as in the overall level of GDP turn out to be linked to gender inequalities in the labour market; therefore, it would not be too farfetched to argue that increasing women’s employment and labour force participation would contribute to higher investment levels by improving efficiency and savings in a given country. Another interesting relationship in terms of inequalities is detected between higher education variables and the Global Competitiveness Index (GCI), where female secondary and tertiary education enrollment ratios appear to be the most powerful explanatory variables in the variance reduction in GCI, followed by the export-to-GDP ratio. Higher education and training is one of the 12 pillars of GCI (WEF 2010). Going beyond this, the relationship between women’s involvement in higher education and GCI is a positive one, suggesting that eradicating inequalities in women’s higher level education will bring about higher competitiveness in a country through the existence of more skilled women within the labour force and an increased stock of skilled human resources. Moreover, it appears that higher the exports of a country, the higher its competitiveness. The relationship between exports and GCI is reciprocal, with GCI being the primary determinant of export performance, which is an expected outcome. Interestingly, exports are affected, though to a very small extent, by higher levels of female education (that is, the female net secondary enrollment ratio). Therefore, given the above discussions, it could be argued that there is a link between more educated women, the global competitiveness of a country, and its export performance. Net foreign direct investment to GDP, an important indicator of a country’s stability and a sound financing of its current account deficits, is significantly affected by gross capital formation to GDP.
According to exercises conducted in Netica using the Bayesian maps, population growth in a country displays mixed but useful results of interaction between GDP per capita and the female LFP ratio, depending upon the country’s development level. According to sensitivity analysis, the population growth variable is most affected by GDP per capita and the ratio of LFP of women against that of men. At lower levels of GDP per capita and women’s labour force participation, population growth is highest. At mid-level ranges of the two explanatory variables in our model, population growth reduces to its lowest ranges. At the highest levels of GDP per capita and women’s labour-force participation, population growth increases moderately. This shows that low-income countries with low female labour-force participation have the highest population growth rates. In middle-income countries where women’s employment and labour-force participation improves to a great extent, population growth decreases. In high-income countries with the highest labour-force participation, population growth improves moderately (while still remaining significantly below that of low-income countries). These findings can be interpreted as evidence for the existence of a nonlinear relationship between the population growth rate and female
labour force participation, considering the negative relationship at low and middle levels of GDP per capita and LFP variables. Nevertheless, when countries pass a certain income threshold, population growth and women’s employment conditions improve together, most probably because of widespread and established care facilities and measures to reconcile family and work life in the high income countries. Therefore, fertility and women’s care responsibilities appear to be among the most important factors limiting women’s participation in labour markets.
7. Conclusion
This study has contributed to the existing research by modeling the relationships within gender inequalities in education, the labour market, health and the political areas and between gender inequalities and gross macroeconomic aggregates by using the BCM methodology. Our model provided extensive results that addressed two broad sets of questions: How could gender inequalities in the society be reduced and to what extent are the macroeconomic variables affected by the gender inequalities? Crucial conclusions were attained that display the undeniable impacts of inequalities against women on economic structures. Inequalities in educational and economic participation have high levels of interaction with each other, while some macroeconomic indicators are also affected by educational and labour market inequalities. These relationships show that eradicating gender inequalities is not independent from strong economic performance and in fact triggers higher GDP growth, investment and competitiveness. Therefore, policy designs should target areas where gender disparities are highest in order to create better functioning economies. More specifically, our model suggests that gender inequalities in labour and education, especially among poor segments of society who are faced with lower levels of education and lower ranks of employment, can be quickly reduced as more women take part in every level of education and high-ranking employment, such as by improving the rates of female legislators, senior officials, managers, and professional and technical workers. Increased empowerment of women through education, having their own income, increased labour market participation, and more decision making power in public life can be expected to contribute more quickly to addressing gender inequalities in the society.
Some inequalities, such as those in women’s labour force participation, are perpetuated by population growth, which is in line with the theoretical predictions that higher dependency rates make women’s care and household responsibilities one of the biggest obstacles against their involvement in the labour market. This result highlights the urgency of introducing policies and regulations to encourage work and family life balance for the sake of both sexes and for society as a whole.
The links between increased competitiveness and women’s nonagricultural employment; higher levels of female education (secondary education in our case) and exports; and female higher education and global competitiveness highlight the big picture where women take part in the international economy. More educated and highly skilled women enhance the global competitiveness of countries, increasing their export share and pulling more women to the labour market in export-oriented sectors. The concept of competitiveness is a debatable issue, however, when seen through the lens of gender, which was omitted from this study to limit its scope.
Increased employment of women as a result of increased competitiveness and export levels should be more closely monitored and examined before arguing that it is a positive overall outcome for women. A strand of research has found worsening employment conditions, lower wages, and more segregated labour markets –with particularly inferior jobs offered to women– in export-oriented and highly competitive countries.
Other notable findings of this study are the negative impact of inequalities in female labour force participation on GDP and the negative impact of inequalities in women’s nonagricultural employment and LFP on a country’s investment levels. These outcomes are very important in showing that inequalities against women negatively affect the overall economy and that increasing women’s employment and labour force participation contributes to higher investment levels and GDP growth by improving efficiency and savings.
In conclusion, this study attempted to deepen the links between macroeconomics and gender inequalities. We believe further research in this area will not only provide a strong basis for shaping economic policies through a gender lens, but also to render attempts to eradicate gender inequalities much more effective.
8. Acknowledgements
We are indebted to Ahmet Çimenoğlu, Gülay Günlük-Şenesen and Şemsa Özar for the motivation, intellectual support and contribution during our study. We also thank the editors and the anonymous referees for their efforts and helpful comments.
9. References
Anderson, R. D., & Vastag, G. (2004). Causal modeling alternatives in operations research: Overview and application. European Journal of Operational Research, 156(1), 92-109. Başlevent, C., & Onaran, Ö. (2004). The effect of export-oriented growth on female labor
market outcomes in Turkey. World Development, 32 (8), 1375–1393.
Berik, G., Rodgers, Y. M., & Seguino, S. (2009). Feminist economics of inequality, development and growth. Feminist Economics, 15(3), 1–33.
Blodgett, J. G., & Anderson, R. D. (2000). A Bayesian network model of the consumer complaint process. Journal of Service Research, 2, 321-338.
Boarini, R., Johansson, A., & d’Ercole, M. M. (2006). Alternative measures of well-being. OECD Social, Employment, and Migration Working Papers No. 33. Retrieved from http://www.oecd.org/els/soc/36165332.pdf
Busse, M., & Nunnenkamp, P. (2009). Gender disparity in education and the international competition for foreign direct investment. Feminist Economics, 15(3), 61–90.
Busse, M., & Spielmann, C. (2006). Gender inequality and trade. Review of International Economics, 14(3), 362–379.
Cuberes, D., & Teignier, M. (2014). Gender inequality and economic growth: A critical review. Journal of International Development, 26, 260–276.
Çağatay, N., & Özler, Ş. (1995). Feminization of the labor force: The effects of long-term economic development and structural adjustment. World Development, 23(8), 1183–1194. Dasgupta, P. (2010). The place of nature in economic development. In D. Rodrik & M. R. Rosenzweig (Eds), Handbook of development economics, volume 5 (pp. 4997–5046). North-Holland: Amsterdam.
Ekici, A., & Önsel, Ş. (2013). How ethical behavior of firms is influenced by the legal and political environments: A Bayesian causal map analysis based on stages of development. Journal of Business Ethics, 115(2), 271-290.
Ekici, A., & Ekici, Onsel Ş. (2015). Value of Bayesian Networks for Macromarketing Investigation. Marketing as Provisioning Technology: Integrating Perspectives on
Solutions for Sustainability, Prosperity, and Social Justice. Proceedings of the 40th Annual Macromarketing Conference, 342-350.
Elson, D., Grown, C., & Çağatay, N. (2007). Mainstream, heterodox, and feminist trade theory. In I. van Staveren, D. Elson, C. Grown & N. Çağatay (Eds), The feminist economics of trade (pp.
33–52
). Routledge: London and New York.Friedman, N., Goldszmidt, M., Heckerman, D., & Russel, S. (1997). Challenge: Where is the impact of Bayesian networks in learning?. Proceedings of the Fifteenth International Joint Conference on Artificial Intelligence. Retrieved from http://citeseerx.ist.psu.edu/viewdoc/download;jsessionid=34935F6995867CAA86395AC6 BB437156?doi=10.1.1.51.101&rep=rep1&type=pdf
International Labour Organisation (ILO). (2013). Global wage report 2012/13: Wages and equitable growth. Retrieved from http://www.ilo.org/wcmsp5/groups/public/---dgreports/---dcomm/---publ/documents/publication/wcms_194843.pdf
İlkkaracan, İ. (2012). Why so few women in the labour market in Turkey?. Feminist Economics, 18(1), 1–37.
Jensen, F. (2002). Bayesian networks and decision graphs. New York, NY: Springer. Jutting, J. P., Morrison, C., Dayton-Johnson, J., & Drechsler, D. (2008). Measuring gender
(in)equality: The OECD gender, institutions and development database. Journal of Human Development, 9(1), 65–86.
Kabeer, N., & Natali, L. (2013). Gender equality and economic growth: Is there a win-win?” Institute of Development Studies Working Paper No. 417. Retrieved from http://www.ids.ac.uk/files/dmfile/Wp417.pdf
Klasen, S., & Schüler, D. (2011). Reforming the gender-related development index and the gender empowerment measure: Implementing some specific proposals. Feminist Economics, 17(1), 1-30.
Klasen, S. (1999). Does gender inequality reduce growth and development? Evidence from cross-country regressions. World Bank Policy Research Report Working Paper Number 7. Retrieved from http://siteresources.worldbank.org/INTGENDER/Resources/wp7.pdf Kongar, E. (2007). Importing equality or exporting jobs? Competition and gender wage and
employment differentials in US manufacturing. In I. van Staveren, D. Elson, C. Grown & N. Çağatay (Eds), The feminist economics of trade (pp. 215–236). Routledge: London and New York.
Mishra, S., Kemmerer, B., & Shenoy, P. P. (2001). Managing venture capital investment decisions: A knowledge-based approach. Working Paper, School of Business, University of Kansas. Retrieved from http://pshenoy.faculty.ku.edu/Papers/BKERC01.pdf
Nadkarni, S., & Shenoy, P. P. (2004). A causal mapping approach to constructing Bayesian networks. Decision Support Systems, 38(2), 259-281.
Nadkarni, S., & Shenoy, P. P. (2001). A Bayesian network approach to making inferences in causal maps. European Journal of Operational Research, 128, 479-498.
Nash, D., Waters, D., Buldu, A., Wu, Y., Lin, Y., Yang, W. … Hannah, M. (2013). Using a conceptual Bayesian network to investigate environmental management of vegetable production in the lake Taihu region of China. Environmental Modelling & Software, 46, 170-181.
Nicholson, A. E., Twardy, C. R., Korb, K. B., & Hope, L. R. (2008). Decision support for clinical cardiovascular risk assessment. In O. Pourret, P. Naim & B. Marcot (Eds), Bayesian networks: A practical guide to applications Bayesian networks (pp. 33–52). John Wiley and Sons: Cornwall.
Nussbaum, M. C. (2001). Women and human development: The capabilities approach. New York, NY: Cambridge University Press.
Organisation for Economic Co-operation and Development (OECD). (2011). How is life? Measuring well-Being. OECD Publishing. Retrieved from
http://unstats.un.org/unsd/broaderprogress/pdf/How%27s%20life%20-%20Measuring%20well-being.pdf
Onisko, A. (2008). Medical diagnosis. In O. Pourret, P. Naim & B. Marcot (Eds), Bayesian networks: A practical guide to applications Bayesian networks (pp. 15-32). John Wiley and Sons: Cornwall.
Pourret, O.. (2008). Introduction to Bayesian networks. In O. Pourret, P. Naim & B. Marcot (Eds), Bayesian networks: A practical guide to applications Bayesian networks (pp. 1-14). John Wiley and Sons: Cornwall.
Samuelson, P. A. (1976). The optimum growth rate for population: Agreement and evaluations. International Economic Review, 17(3), 516–525.
Seguino, S. (2002). Gender, quality of life and growth in Asia 1970 to 1990. The Pacific Review, 15(2), 245-77.
Seguino, S. (2000a). Gender inequality and economic growth: A cross-country analysis. World Development, 28(7), 1211–1230.
Seguino, S. (2000b). Accounting for Asian economic growth: Adding gender to the equation. Feminist Economics, 6(3), 27-58.
Seguino, S. (1997). Gender wage inequality and export-led growth in South Korea. Journal of Development Studies, 34(2), 102–137.
Sen, A. (1985).Commodities and capabilities. Amsterdam: North-Holland.
Stiglitz, J. E., Sen, A., & Fitoussi, J.-P. (2009). Report by the Commission on the Measurement of Economic Performance and Social Progress. Retrieved from http://www.stiglitz-sen-fitoussi.fr/documents/rapport_anglais.pdf
Wanjala, B. M., & Were, M. (2009). Gender disparities and economic growth in Kenya: A social accounting matrix approach. Feminist Economics, 15(3), 227–251.
World Economic Forum (WEF). (2012). Global gender gap report. Retrieved from http://reports.weforum.org/global-gender-gap-report-2012/
World Economic Forum (WEF). (2010). The global competitiveness report, 2010–2011.
Retrieved from
http://www3.weforum.org/docs/WEF_GlobalCompetitivenessReport_2010-11.pdf Wu, W. W. (2010). Linking Bayesian networks and PLS path modeling for causal analysis.