J Int Adv Otol 2018; 14(2): 208-10 • DOI: 10.5152/iao.2018.4052
Original Article
INTRODUCTION
Multifrequency tympanometry (MFT) consist of the analysis of tympanograms of different probe tones between 226 and 2000 Hz and measures individual vectors of complex admittance (Y), namely susceptance (B) and conductance (G) [1]. An important parameter of MFT is resonance frequency (RF). The middle ear transmission system comprises the mass and stiffness (volume and pressure of the air in the tympanic cavities, tonus of the middle ear muscles, and mechanical immittance of the cochlea). The change in balance between mass and stiffness causes changes in RF. If stiffness of the ear increases, RF is higher than normal. Conversely, if the mass of the ear increases, RF is lower than normal [2]. Because currently available literature is not sufficient, the clinical use of MFT has not become widespread. Body mass index (BMI) was first described in 1835 by Qutelet. It is a numerical index calculated by dividing body weight (kg) by the square of height (m). Degrees of overweightness are classified according to this index. Age and sex do not affect BMI values [3]. According to the World Health Organization (the 2004 classification), people with BMI of ≥25 are overweight, those with BMI of ≥30 are obese, and those with BMI of <18.50 are underweight [4].
Obesity and overweight have been studied for many years. Obesity affects many systems in an organism and correlates with met-abolic diseases such as diabetes mellitus, hypertension, and dyslipidemia. Studies based on imaging methods revealed that BMI correlated with body weight and visceral fat [5, 6]. BMI has also been investigated in people with hearing loss, and although some studies detected a significant association, others obtained significant results only in women or found no association between BMI and hearing [7, 8]. Because an increase in body weight causes an increase in submucosal and visceral fat tissues, in this study of adults with normal-hearing thresholds, BMI values and RF values of the middle ear were compared.
MATERIALS and METHODS
The study included 78 voluntary participants with normal otoscopic examinations and no complaints of hearing loss. The study was approved by the ethics committee of university’s Institutional Review Board (Project no: KA15/313) and was supported by the University Research Fund. All participants provided written informed consent.
Effect of Body Mass Index on Middle Ear Resonance
Frequency
OBJECTIVE: Multifrequency tympanometry (MFT) analyzes tympanograms obtained using different probe tones between 226 and 2000 Hz. An
important parameter of MFT is resonance frequency (RF). Studies have recently demonstrated that the RF value can vary depending on many factors. To provide new data regarding MFT, middle ear RF values were investigated with regard to body mass index (BMI).
MATERIALS and METHODS: This study included 78 volunteers (i.e., 156 ears) aged 18-40 years who did not have hearing loss and whose otoscopic
examinations were normal. Hearing thresholds were measured using pure tone audiometry, and RF values were recorded with immitansmetric measurements. The participants were divided into the following three groups according to their BMI: <18.5 kg/m2, Group 1; 18.5-24.9 kg/m2,
Group 2; and >25 kg/m2, Group 3. The RF values were also analyzed.
RESULTS: Although there was no significant difference between Groups 1 and 2 in terms of RF values, a significant difference was observed
be-tween Groups 1 and 3 and bebe-tween Groups 2 and 3.
CONCLUSION: In the light of these data, BMI values should be considered when middle ear RF values are assessed. KEYWORDS: Body mass index, multifrequency tympanometry, resonance frequency
Miray Sözen, Işılay Öz, Selim Erbek
Department of Ear, Nose and Throat, Başkent University School of Medicine, Ankara, Turkey
Corresponding Address: Işılay Öz E-mail: [email protected]
Submitted: 11.07.2017 • Revision Received: 10.08.2017 • Accepted: 23.10.2017 •Available Online Date: 19.02.2018
©Copyright 2018 by The European Academy of Otology and Neurotology and The Politzer Society - Available online at www.advancedotology.org
Cite this article as: Sözen M, Öz I, Erbek S. Effect of Body Mass Index on Middle Ear Resonance Frequency. J Int Adv Otol 2018; 14(2): 208-10.
The study group comprised 78 volunteers (i.e., 156 ears) with BMI of <18.5 kg/m2 (Group 1), BMI of 8.5-24.9 kg/m2 (Group 2), and BMI of >25 kg/m2 (Group 3). The sample width was calculated in a pre-study statistical evaluation. Individuals with a chronic, immunologic, neu-rologic and otologic diseases, a history of drug use were excluded from the study. Patients with had normal hearing [hearing thresholds of ≤15 dB (ANSI 1988)] and a normal tympanic examination (peak impedance value was±50 daPa) and, acoustic reflexes between 500 and 4000 Hz at normal levels were included.
Hearing thresholds were determined by pure tone audiometry in individuals who underwent an otoscopic examination performed by an Ear Nose Throat (ENT) specialist. Pure tone audiometry was evaluated using the Interacoustics AC-40 clinical audiometer (Inter-acoustics A/S, DK-5610, Assens, Denmark) in a quiet room according to the industrial acoustic company standard. Air-conduction hearing thresholds were measured using TDH-39 standard headphones. Mea-surements at frequencies between 125 and 8000 Hz were performed. Bone conduction hearing thresholds were measured using the Radi-oear B-71 bone vibrator at frequencies between 250 and 4000 MHz. Immitansmetric measurements of all participants were performed us-ing the Grason Stadler Tympstar Version 2 electroacoustic immittance meter. First, tympanogram and static admittance values were recorded using a 226-Hz probe tone. The tympanogram was obtained by chang-ing the air pressure from +200 to -400 daPa at a ratio of 200 daPa/s. MFT was then performed in two steps. In the first step, standard tym-panometric data such as static admittance, tymtym-panometric peak pres-sure, and gradient value were assessed by presenting a probe tone at a constant frequency and changing the pressure between +200 and -400 daPa and then a tympanogram was drawn. In the second step, the RF value of the middle ear was assessed by maintaining a constant pressure and successively applying a stimulus within the frequency range of 200 and 2000 Hz to both ears at intervals of 50 Hz; the outputs were then recorded together with other immitansmetric values. Sex, age, height, weight, BMI, and MFT values of the participants were noted and compared. Data were statistically analyzed using the Statistical Package for Social Sciences for Windows 16.0 software (SPSS Inc.; Chicago, IL, USA) package. Statistical significance was accepted at p values of <0.05. RESULTS
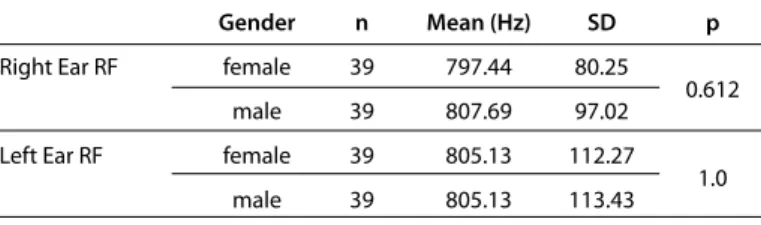
Each group comprised 26 participants, of which 13 were females and the other 13 were males. The age range of the females was 20-40 years, and that of the males was 18-39 years. Data regarding for sex and means and ranges of age, height, weight, BMI, and RF values for both ears are presented in Table 1. When RF values of the right and left ears were compared, no statistically significant difference was ob-served (p=0.874). Statistical analysis of the right and left ear RF values according to gender sex summarized in Table 2.
There was no statistically significant difference between RF values of males and those of females (p=0.612; p=1.0). In the analysis of the results, an intergroup analysis of the three BMI groups was performed on the basis of the total number of participants in each group regardless of sex and ear. The mean RF value was 823.08±86.58 Hz for Group 1, 817.31±94.91 Hz for Group 2, and 771.15±112.61 Hz for Group 3. When RF values were
compared between Groups 1 and 2, no significant difference was ob-served (p=0.747; Table 3). When Groups 1 and 3 were compared, a sig-nificant difference was observed (p=0.01; Table 4). When Groups 2 and 3 were compared, a significant difference was observed (p=0.026; Table 5). A negative correlation existed between BMI and RF values (p=0.015). DISCUSSION
Multifrequency tympanometry is a technique for evaluating the im-mittance of the middle ear over a wide frequency range. RF values change in different pathologies when either the mass or stiffness of the middle ear system is affected. High-frequency probe tones pro-vide valuable data regarding pathologies such as otosclerosis, ossic-ular chain deformations, middle ear malformations, cholesteatoma, middle ear tumors, and osteogenesis imperfecta, which increase the
Table 1. Data regarding sex, and means and ranges for age, height, weight,
BMI, and RF values for both ears
n Min. Max. Mean SD
Age (Year) 78 18 40 28.73 6.11 Body weight (kg) 78 46 122 66.69 14.99 Length (cm) 78 155 193 171.36 9.25 Right Ear RF (HZ) 78 600 1100 802.56 88.6 Left Ear RF (Hz) 78 550 1100 805.13 112.11
RF: resonance frequency; SD: standard deviation; BMI: body mass index
Table 3. RF analysis of the groups with BMI of <18.5 kg/m2 and
18.5-24.9 kg/m2
BMI n Mean (Hz) SD p
<18.5 kg/m2 (group 1) 52 823.08 86.58
0.747 18.5-24.9 kg/m2 (Group 2) 52 817.31 94.91
BMI: body mass ındex; SD: standard deviation; RF: resonance frequency
Table 4. RF analysis of the groups with BMI of <18.5 kg/m2 and >25 kg/m2
BMI n Mean (Hz) SD p
<18.5 kg/m2 52 823.08 86.58
0.01* >25 kg/m2 52 771.15 112.61 BMI: body mass ındex; SD: standard deviation; RF: resonance frequency
Table 5. RF analysis of the groups with BMI of 18.5-24.9 kg/m2 and >25 kg/m2
BMI n Mean (Hz) SD p
18.5-24.9 kg/m2 52 817.31 94.91
0.026* >25 kg/m2 52 771.15 112.61 BMI: body mass index; SD: standard deviation; RF: resonance frequency Table 2. Distribution of RF values with regard to sex
Gender n Mean (Hz) SD p
Right Ear RF female 39 797.44 80.25
0.612 male 39 807.69 97.02 Left Ear RF female 39 805.13 112.27
1.0 male 39 805.13 113.43
RF: resonance frequency; SD: standard deviation
209
stiffness of the middle ear system. In addition, studies have shown that RF values can vary according to many factors [1, 6, 9-11]. However, we could not find any data regarding the influence of body weight on RF. This is the first study to demonstrate that RF values are de-creased in patients with an inde-creased BMI.
A study of Chinese and Caucasian people revealed that RF values of the Chinese people were higher than those of the Caucasian people [12]. Thus, normalization values for different regions or ethnicities are necessary. In normalization studies of normal-hearing individuals reported in the literature, the mean RF value was between 871 and 1000 Hz [13-15]. In a study conducted in pregnant women by Dag et al. [16], significantly lower RF values were obtained in both ears com-pared with non-pregnant women of the same age range. The author suggested that this difference resulted from an increased endolym-phatic fluid, edema in the middle ear mucosa, disruption of the ossic-ular chain, or relaxation of ligaments during pregnancy.
The differences in RF normalization values in different populations re-ported in the literature are explained based on age and the differences in hereditary characteristics of the middle ear and outer ear structures [2, 6]. However, in studies that compared different age groups, no signif-icant difference was observed with regard to RF values [17, 18]. Further-more, in a study that investigated RF values according to the body position, although the difference was not significant, there was a dif-ference between the RF value observed in the vertical position and that observed in the Trendelenburg position [19]. In our study, we evaluated all participants in the sitting position, thereby eliminating changes that can occur in different positions. In addition, we obtained a more ho-mogenous group of 18- to 40-year-old adults by eliminating physical and physiological effects that may occur in children and geriatrics. We did not observe a significant difference in RF values with regard to sex. In our study, the difference in RF values between sex and right–left ears was not statistically significant. Therefore, all participants were evaluated without considering sex or right–left ear discrimination to investigate how RF values were affected according to BMI. We ob-served that as BMI values increased, RF values decreased. This finding suggested that alterations in body weight affected ear tissues. BMI is considered to be related to an increased intracranial pressure and body water rates. A previous study showed that an increase in intra-cranial pressure caused an increase in inner ear pressure. Increased body weights might affect the inner ear mechanics by increasing intracranial pressures. However, this is just a speculation based on current data. One limitation was that the present study was popula-tion based and included limited number of subjects. The other lim-itation was that intracranial pressure and the body water ratio were not measured. Future studies should focus on the mechanisms that influence BMI and middle ear RF.
CONCLUSION
Resonance Frequency (RF) values of the middle ear were affected by body weight. However, the mechanism of decreased RF values in obese is not clearly known. Therefore, further studies should focus on the possible causes that lead to abnormal RF.
Ethics Committee Approval: Ethics committee approval was received for
this study from Başkent University’s Institutional Review Board (Project No: KA15/313).
Informed Consent: Written informed consent was obtained from patients
who participated in this study.
Peer-review: Externally peer-reviewed.
Author Contributions: Concept - M.S., S.E.; Design - M.S., S.E.; Supervision -
S.E., I.Ö.; Resource - M.S., S.E., I.Ö.; Materials - M.S., S.E.; Data Collection and/or Processing - M.S., S.E., I.O.; Analysis and/or Interpretation - M.S., S.E.; Literature Search - M.S., I.Ö.; Writing - I.Ö., S.E.; Critical Reviews - S.E.
Conflict of Interest: No conflict of interest was declared by the authors. Financial Disclosure: The authors declared that this study has received no
financial support.
REFERENCES
1. Margolis RH, Van Camp KJ, Wilso RH, Creten WL. Multifrequency tympa-nometry in normal ears. J. Audiology 1985; 24: 44-53. [CrossRef]
2. Shanks J, Shelton C. Basic principles and clinical applications of tympa-nometry. Otolaryngol Clin North Am 1991; 24: 299-328.
3. Kushner RF, Blatner DJ. Risk assessment of the overweightand obese pa-tients. J Am Diet Assoc 2005; 105: 53-62. [CrossRef]
4. World Health Organization. Obesity: Preventing and managing the glob-al epidemic. Report of a WHO Consultation. World Heglob-alth Organization Technical Report Series 2000; 894: 1-253.
5. Shahnaz N, Polka L. Standard and multifrequency tympanometry in nor-mal and otosclerotic ears. Ear Hear 1997; 18: 326-41. [CrossRef]
6. Margolis RH, Goycoolea HG. Multifrequency tympanometry in normal adults. Ear Hear 1993; 14: 408-13. [CrossRef]
7. Fransen E, Topsakal V, Hendrickx JJ, Van Laer L, Huyghe JR, Van Eyken E, et al. Occupational noise smoking, and a high body mass index are risk factors for age-related hearing impairment and moderate alcohol con-sumption is protective: a European populationbased multicenter study. J Assoc Res Otolaryngol 2008; 9: 264-76. [CrossRef]
8. Helzner EP, Patel AS, Pratt S, Sutton-Tyrrell K, Cauley JA, Talbott E, et al. Hearing sensivity in older adults: associations with cardiovascular risk factors in the health, aging and body composition study. J Am Geriatr Soc 2011; 59: 972-9. [CrossRef]
9. Margolis R, Shanks JE. Tympanometry: Principles and Procedures In W. F. Rin-telmann (Ed.), Hearing Assessment, Pro-Ed., Texas: Austin, 1991; 179-246. 10. Jerger J. Clinical experience with impedance audiometry. Arch
Otolaryn-gol 1970; 92: 311-24 [CrossRef]
11. Katz J, Robert F, Medwetsky L. Handbook of Clinical Audiology. Lippin-cott Williams & Wilkins. 2002; 159-75
12. Shahnaz N, Davies D. Standard and multifrequency tympanometric norms for caucasian and chinese young adults. Ear Hear 2006; 27: 75-90. [CrossRef]
13. Lutman ME. Phasor admittance measurements of the middle ear: I. The-oretical approach. Scand Audiol 1984; 13: 253-64. [CrossRef]
14. Wada H, Kobayashi T, Suetake M, Tachizaki H. Dynamic Behavior of Mid-dle Ear Based on Sweep Frequency Tympanometry. Audiology 1989; 28: 127-34. [CrossRef]
15. Russolo M, Bianchi M, Miani C. La timpanometria multifrequenziale nella diagnosi di otosclerosi fenestrale. Audiol Ital 1991; 8: 87-94.
16. Dag EK, Gulumser C, Erbek S. Decrease in middle ear resonance frequen-cy during pregnanfrequen-cy. Auidol Res 2016; 6: 147-9. [CrossRef]
17. Holte L. Aging effects in multifrequency tympanometry. Ear Hear 1996; 17 : 12-8. [CrossRef]
18. Uchida Y, Nomura H, Itoh A, Nakashima T, Ando F, Niino N, et al. The ef-fects of age on hearing and middle ear function. J Epidemiol 2000; 10: 26-32. [CrossRef]
19. Franco-Vidal V, Bonnard D, Bellec O, Thomeer H, Darrouzet V. Effects of body tilt on multifrequency admittance tympanometry. Otol Neurotol 2014; 36: 737-40.[CrossRef]