ÇANKAYA UNIVERSITY
THE GRADUATE SCHOOL OF SOCIAL SCIENCES ECONOMICS AND ADMINISTRATIVE SCIENCES
MASTER THESIS
SOME OBSERVATIONS REGARDING FINANCIAL
REPORTING, FINANCIAL PERFORMANCE AND PORTFOLIO
OPTIMIZATION OF MAJOR UPSTREAM IFRS PETROLEUM
COMPANIES
Zaidon Adel Abood AL-DULAMY
ÇANKAYA UNIVERSITY
THE GRADUATE SCHOOL OF SOCIAL SCIENCES ECONOMICS AND ADMINISTRATIVE SCIENCES
MASTER THESIS
SOME OBSERVATIONS REGARDING FINANCIAL
REPORTING, FINANCIAL PERFORMANCE AND PORTFOLIO
OPTIMIZATION OF MAJOR UPSTREAM IFRS PETROLEUM
COMPANIES
Zaidon Adel Abood AL-DULAMY
ABSTRACT
SOME OBSERVATIONS REGARDING FINANCIAL REPORTING, FINANCIAL PERFORMANCE AND PORTFOLIO OPTIMIZATION OF
MAJOR UPSTREAM IFRS PETROLEUM COMPANIES
Zaidon Adel Abood AL-DULAMY M.B.A, Master of Business Administration
Supervisor: Dr. Can ÖZTÜRK AUGUST 2018, 95 pages
This thesis focuses on some observations regarding upstream petroleum companies in terms of financial reporting, financial performance and portfolio optimization. The sample of this research is made up of upstream petroleum companies whose financial reporting is based on International Financial Reporting Standards (IFRS) within the framework of the sales revenue constraint. The findings of this research were collected using frequency distribution method, financial ratios and appropriate spreadsheet functions. From the perspective of financial reporting, findings show that (1) the majority of the major upstream petroleum companies prepare their financial statements in accordance with IFRS; (2) there is a diversification of accounting policy choices adopted by these companies regarding IAS 1, IAS 2, IAS 7, IAS 16, IAS 38, IAS 40 in the general context; and (3) this research indicates that major IFRS petroleum companies are inclined to report their exploration and evaluation expenditures using Successful Efforts method. From the perspective of the financial performance analysis, findings show that quoted IFRS petroleum companies are profitable and they generally improved their liquidity from 2014 to 2015 but they should be prudent in managing their short-term liabilities which may create pressure on the liquidity. From the perspective of portfolio optimization, this research
observed expected returns and risks of shares of major quoted IFRS petroleum companies by establishing different portfolio scenarios for the purpose of risk minimization and return maximization. Compared to the prior of research of Jurkowski & Daly (2015) which uses financial ratios and particularly profitability ratios for the purpose of investor’s preference and risk tolerance, this research proposes that reasonable information that is required for investor’s preference and risk tolerance is expected to be provided through financial ratios supported by different portfolio scenarios when investing into shares of petroleum companies.
Key Words: Financial Reporting, Financial Performance, Portfolio Optimization, IFRS, Petroleum Companies
ÖZ
UFRS’YE GÖRE RAPORLAMA YAPAN BÜYÜK BOY PETROL ÜRETİM ŞİRKETLERİNDE FİNANSAL RAPORLAMAYA, FİNANSAL
PERFORMANSA VE PORTFÖY OPTİMİZASYONUNA İLİŞKİN BAZI GÖZLEMLER
Zaidon Adel Abood AL-DULAMY Yüksek lisans
İşletme Yönetimi
Danışman: Dr. Öğretim Üyesi Can ÖZTÜRK AĞUSTOS 2018, 95 Sayfa
Bu tez, petrol üretim şirketlerinde finansal raporlamaya, finansal performansa ve portföy optimizasyonuna ilişkin bazı gözlemlere odaklanmıştır. Araştırmanın örneklemi, satış hasılatı kısıtı çerçevesinde raporlamasını Uluslararası Finansal Raporlama Standartlarına (UFRS) göre yapan büyük boy petrol üretim şirketlerinden oluşmaktadır. Araştırmanın bulguları, frekans dağılımları yöntemi, finansal oranlar ve uygun tablolama fonksiyonları kullanılarak elde edilmiştir. Finansal raporlama açısından, bulgular (1) büyük boy petrol üretim şirketlerinin büyük bölümünün finansal tablolarını UFRS uyarınca hazırladığını, (2) UMS 1, UMS 2, UMS 7, UMS 16, UMS 38, UMS 40 standartları açısından şirketler tarafından benimsenen seçimlik muhasebe politikalarında genel olarak bir çeşitlilik olduğunu ve (3) UFRS’ye göre raporlama yapan büyük boy petrol üretim şirketlerinin petrol araştırma ve değerlendirme harcamalarını Başarılı Sonuç yöntemine göre raporlamaya eğilimli olduğunu göstermektedir. Finansal performans analizi açısından, bulgular borsaya kote olup UFRS’ye göre raporlama yapan petrol şirketlerinin karlı olduğunu ve 2014 yılından 2015’e likiditelerinin genel olarak arttığını ancak likidite üzerinde baskı
yaratabilecek kısa vadeli borçları kontrol altında tutmaları konusunda ihtiyatlı olmaları gerektiğini göstermektedir. Portföy optimizasyonu açısından, bu araştırma büyük boy borsaya kote ve UFRS’ye göre raporlama yapan petrol şirketlerinin hisselerinin beklenen getirileri ve risklerini asgari risk ve azami getiri amacıyla farklı portföy senaryoları oluşturarak gözlemlemiştir. Yatırımcının tercihi ve risk toleransı amacıyla finansal oranları ve özellikle karlılık oranlarını kullanan Jurkowski & Daly (2015)’e ait önceki çalışma ile karşılaştırıldığında, bu araştırma petrol şirketlerinin hisselerine yapılacak yatırım açısından yatırımcının tercihi ve risk toleransı için gerekli makul bilginin finansal oranların farklı portföy senaryoları ile desteklenmesi ile sağlanabileceğini önermektedir.
Anahtar Kelimeler: Finansal Raporlama, Finansal Performans, Portföy Optimizasyonu, UFRS, Petrol Şirketleri
ACKNOWLEDGMENTS
I would like to thank to my supervisor Dr. Can ÖZTÜRK for his valuable effort and guidance while supervising my thesis.
DEDICATION
This thesis is dedicated to my beloved entire family and all my teachers that I have never forgotten them for their efforts, support, and encouragement along my studying years.
TABLE OF CONTENTS ABSTRACT ... iv ÖZ ... vi ACKNOWLEDGMENTS ... viii DEDICATION ... ix TABLE OF CONTENTS ... x
LIST OF TABLES ... xiii
LIST OF FIGURES ... xv
LIST OF ABBREVIATIONS ... xvi
CHAPTER 1 ... 1
1. INTRODUCTION ... 1
1.1. Objectives of the Thesis ... 2
1.2. Significance of the Thesis ... 2
1.3. Limitations of the Thesis ... 3
1.4. Assumptions of the Thesis ... 3
CHAPTER 2 ... 4
2. LITERATURE REVIEW... 4
2.1. Financial Reporting Environment in the Country and Sector-Specific Context ... 4
2.2. Financial Performance Analysis and Portfolio Optimization for Petroleum Companies ... 8
CHAPTER 3 ... 11
3. RESEARCH DATA AND METHODOLOGY ... 11
3.1. Research Methodology ... 11
3.2. Research Design ... 11
3.3. Research Sample ... 11
3.5. Procedure for Data Collection ... 18
CHAPTER 4 ... 19
4. RESEARCH FINDINGS ON ACCOUNTING POLICIES REGARDING MAJOR UPSTREAM PETROLEUM COMPANIES ... 19
4.1. Generally Accepted Accounting Practices Adopted by Major Upstream Petroleum Companies ... 19
4.2. Accounting Policy Choices Adopted by Major Upstream IFRS Petroleum Companies ... 20
4.2.1. Brief Summary of IAS 1 Presentation of Financial Statements ... 20
4.2.2. Research Findings related to IAS 1 ... 21
4.2.3. Brief Summary of the IAS 2 Inventory ... 26
4.2.4. Research Findings related to IAS 2 ... 26
4.2.5. Brief Summary of IAS 7 Statement of Cash Flows ... 27
4.2.6. Research Findings related to IAS 7 ... 29
4.2.7. Brief Summary of IAS 16 Property, Plant & Equipment ... 32
4.2.8. Research Findings Related to IAS 16 ... 33
4.2.9. Brief Summary of IAS 38 Intangible Assets ... 34
4.2.10. Research Findings Related to IAS 38 ... 35
4.2.11. Brief Summary of IAS 40 Investment Property ... 36
4.2.12. Research Findings Related to the Standard IAS 40 ... 36
4.2.13. Brief Summary of IFRS 6 Exploration for and Evaluation of Mineral Resources ... 37
4.2.14. Research Findings Related to IFRS 6 ... 37
CHAPTER 5 ... 40
5. RESEARCH FINDINGS ON FINANCIAL PERFORMANCE ANALYSIS OF MAJOR UPSTREAM QUOTED IFRS PETROLEUM COMPANIES ... 40
5.1. Profitability Analysis ... 40
5.1.1. Return on Assets ... 40
5.1.2. Return on Equity ... 41
5.1.3. Overall Analysis of Profitability ... 42
5.2. Liquidity Analysis ... 43
5.2.2. Quick Ratio ... 46
5.2.3. Overall Analysis of Liquidity ... 48
5.3. Efficiency Analysis ... 49
5.3.1. Receivables Turnover ... 49
5.3.2. Payables Turnover ... 51
5.3.3. Overall Efficiency Analysis ... 53
5.4. Leverage Analysis ... 54
5.4.1. Debt/Equity Ratio ... 54
5.4.2. Short-term Liability Analysis ... 57
5.4.3. Overall Analysis of Leverage ... 59
5.5. Overall Financial Performance Analysis ... 59
CHAPTER 6 ... 62
6. RESEARCH FINDINGS ON PORTFOLIO OPTIMIZATION OF MAJOR UPSTREAM QUOTED IFRS PETROLEUM COMPANIES ... 62
6.1. Sample Set ... 62
6.2. Share Price Data Analysis ... 63
6.3. Observations Of Daily Returns ... 64
6.4. Average Daily Returns and Standard Deviations for Individual Securities ... 64
6.5. Different Scenarios for Portfolio Analysis ... 65
6.5.1. Baseline Portfolio Scenario ... 65
6.5.2. Maximum Return Portfolio Scenario 1 ... 69
6.5.3. Maximum Return Portfolio Scenario 2 ... 70
6.5.4. Minimum Risk Portfolio Scenario 1 ... 71
6.5.5. Minimum Risk Portfolio Scenario 2 ... 72
6.5.6. Overall Analysis of Portfolio Scenarios ... 73
CHAPTER 7 ... 75
7. CONCLUSION & RECOMMENDATIONS ... 75
LIST OF TABLES
Table 2.1: Summary of Cost Methods ... 7
Table 2.2: Comparative Prior Research ... 9
Table 3.1: Major Upstream Non-IFRS + IFRS Petroleum Companies ... 13
Table 3.2: Major Upstream IFRS Petroleum Companies ... 14
Table 3.3: Major Upstream Quoted IFRS Petroleum Companies ... 15
Table 3.4: Major Upstream IFRS Petroleum Companies for Portfolio Optimization ... 15
Table 4.1: Adoption of Different GAAP among Petroleum Companies ... 19
Table 4.2: Title of Statement of Financial Position ... 21
Table 4.3: Classification of Assets and Liabilities ... 22
Table 4.4: Classification of Assets and Liabilities ... 22
Table 4.5: Format of the Statement of Financial Position ... 24
Table 4.6: Format of the Statement of Profit or Loss ... 25
Table 4.7: Format of the Statement of Comprehensive Income ... 25
Table 4.8: Inventory Cost Flow Assumptions ... 27
Table 4.9: Format of the Cash Flows from Operations ... 29
Table 4.10: Classification of Dividend Paid ... 30
Table 4.11: Classification of Interest Paid ... 30
Table 4.12: Classification of Interest Received ... 31
Table 4.13: Classification of Dividend Received ... 31
Table 4.14: Depreciation Methods Preferred by IFRS Petroleum Companies ... 33
Table 4.15: PPE Accounting Policy Choice After Initial Recognition ... 34
Table 4.16: Intangible Assets Accounting Policy Choice After Initial Recognition ... 35
Table 4.17: Investment Property Accounting Policy Choice After Initial Recognition ... 37
Table 4.18: Comparative Research on Petroleum Accounting Policy Choice ... 38
Table 5.1: Comparative Financial Ratios and EPS ... 61
Table 5.2: Ranking Financial Ratios and EPS from the Highest to the Lowest ... 61
Table 6.1: Expected Returns and Standard Deviations for Each Security ... 65
Table 6.2: Variance/Covariance Matrix for the Baseline Portfolio ... 68
Table 6.3: Comparative Portfolios (Baseline and Max Return 1) ... 70
Table 6.4: Comparative Portfolio Analysis (Baseline, Max Return 1 & 2) ... 71
Table 6.5: Comparative Portfolio Analysis (Baseline & Min Risk 1) ... 72
LIST OF FIGURES
Figure 4.1: GAAP among Major Upstream Petroleum Companies ... 20
Figure 4.2: US GAAP Format of Statement of Financial Position ... 23
Figure 4.3: EU Continental European Format of Statement of Financial Position ... 23
Figure 4.4: EU Anglo-Saxon Format of Statement of Financial Position ... 24
Figure 5.1: Comparative ROA Ratios ... 41
Figure 5.2: Comparative ROE Ratios ... 42
Figure 5.3: Current Ratio for the Year 2014 ... 44
Figure 5.4: Current Ratio for the Year 2015 ... 44
Figure 5.5: Comparative Current Ratios ... 45
Figure 5.6: Quick Ratio for the Year 2014 ... 46
Figure 5.7: Quick Ratio for the Year 2015 ... 47
Figure 5.8: Comparative Quick Ratios ... 47
Figure 5.9: Receivables Turnover in 2014 ... 50
Figure 5.10: Receivables Turnover in 2015 ... 50
Figure 5.11: Comparative Average Collection Period ... 51
Figure 5.12: Payables Turnover in 2014 ... 52
Figure 5.13: Payables Turnover in 2015 ... 52
Figure 5.14: Comparative Average Payment Period ... 53
Figure 5.15: Comparative Average Collection and Payment Period in 2015 ... 54
Figure 5.16: Debt/Equity Ratio for the Year 2014 ... 55
Figure 5.17: Debt/Equity Ratio for the Year 2015 ... 55
Figure 5.18: Comparative Debt/Equity Ratio ... 56
Figure 5.19: Short-Term Portion of Total Debts for the Year 2014 ... 57
Figure 5.20: Short-Term Portion of Total Debts for the Year 2015 ... 58
Figure 5.21: Comparative Short-term Portion of Total Debts ... 58
LIST OF ABBREVIATIONS
ART Accounts Receivable Turnover APT Accounts Payable Turnover BRIC Brazil, Russia, India and China EPS Earnings Per Share
FCM Full Cost Method FIFO First-in First Out
GAAP Generally Accepted Accounting Practices IAS International Accounting Standards IASB International Accounting Standards Board IASC International Accounting Standards Committee IFRS International Financial Reporting Standards MOH Motor Oil Hellas
NL Netherlands
PPE Property, Plant and Equipment ROA Return on Assets
ROE Return on Equity ROC Return on Capital
SEM Successful Efforts Method UK United Kingdom
US United States WA Weighted Average
CHAPTER 1
1. INTRODUCTION
Oil industry is one of the largest industries in the global context. It covers the global exploration, extraction, refining, transport and marketing of petroleum products (Hazarika 2015; Kumar Bhaskaran and Sukumaran 2016). It is known that oil based products consist of fuel oil, gasoline and petroleum oil that is used in the manufacturing of many chemical products such as pharmaceuticals, pesticides and plastics.
According to the paper of Kumar Bhaskaran and Sukumaran (2016), there are three major segment of the oil industry: (1) upstream operations; (2) midstream operations; and (3) downstream operations. In this context, upstream operations refer to the exploration and production activities which include (a) searching for, (b) recovering and (c) producing crude oil from underground or underwater fields versus midstream operations refer to (a) shipping and (b) storage of oil which includes taking the crude oil supplied from the upstream sector and transferring it to the downstream processing facilities. As a final stage of operations, downstream operations cover (a) processing the materials collected during the upstream stage into a finished product and (b) actual sale of the products such as gasoline diesel oil, pesticides, heating oil and asphalt to other businesses, private individual or governments.
As stated in the paper of Kumar Bhaskaran and Sukumaran (2016), production constitutes an integral part of the petroleum industry due to the fact that primary assets of oil companies are based on oil reserves which refer to hydrocarbons that are located below the surface and that have not yet been produced and are economically viable to extract. It should be noted oil reserves refer to depleting assets and they require to be replaced through drilling and acquisition. If a petroleum company has proved reserves, it means that these reserves have an estimated quantity of oil that is expected to be economically viable and producible.
Due to the global presence of this industry as well as since exploration and production consist of an integral part of oil industry; this thesis refers to the analysis of major upstream petroleum companies in the global context from the perspectives of financial reporting, financial performance, and portfolio optimization.
Within the framework of this brief introduction, this introductory chapter is made up of four subsections as follows: (1) Objectives of the Thesis; (2) Significance of the Thesis; (3) Limitations of the Thesis; and (4) Assumptions of the Thesis.
1.1. Objectives of the Thesis
There are mainly four objectives of this thesis: (1) It examines financial reporting practices of major upstream petroleum companies to observe whether these companies are in common denominator regarding their adopted GAAPs; (2) it takes the picture of financial statements and disclosures of major upstream IFRS petroleum companies in terms of their adopted accounting policy choices to observe whether these companies are in common denominator regarding their adoption of IFRS accounting policy choices, (3) it analyses financial performance of major upstream quoted IFRS petroleum companies within the framework of their liquidity, solvency, efficiency, and profitability, and (4) it develops different portfolio scenarios by investing into shares of these companies to improve the prior literature.
1.2. Significance of the Thesis
This thesis is important because it provides insights about the financial reporting, financial performance and portfolio optimization of the major upstream IFRS petroleum companies.
1.3. Limitations of the Thesis
The sample is based on major upstream petroleum companies within the framework of the sales revenue constraint. In addition, data collected regarding financial reporting, financial performance and portfolio optimization belongs to the year 2015 only. Therefore, this research is limited to a point in time and indicative of accounting policies, financial performance and portfolio optimization for the time the sample is selected.
1.4. Assumptions of the Thesis
The following assumptions have been made regarding this thesis:
(1) For the purpose of financial reporting and financial performance, audited IFRS financial statements and notes were used to gather data. Therefore, it is assumed that reliable financial information was provided by audited financial statements.
(2) For the purpose of portfolio optimization, data was collected from the websites of these companies and from respected financial websites such as Yahoo Finance. Thus, it is assumed that reliable share price information was provided by those websites.
CHAPTER 2
2. LITERATURE REVIEW
This chapter is divided into two subsections regarding the literature review: (1) Literature Review on Financial Reporting, and (2) Literature Review on Financial Performance and Portfolio Optimization.
2.1. Financial Reporting Environment in the Country and Sector-Specific Context
Financial reporting is based on accounting policies that are the specific principles, rules and procedures implemented by a company's management team and are used to prepare its financial statements (Akdoğan & Öztürk 2015, 61). In each country, accounting policies are based on GAAPs depending on the regulation adopted by each country in the sense of local GAAP or IFRS.
It is known that IFRS adoption has became important in order to provide transparency, understandability, and comparability of the financial statements and the disclosures since 2005. That is why; many global and major companies and unavoidably listed ones have started to adopt IFRS in the global context. However, even if this is the case, there are still some companies that have not yet adopted IFRS and are stick to their local GAAP despite their global or major position. That is why diversification of GAAP still exists in the sector-specific context and this situation will be questioned from the perspective of petroleum companies in this research.
In addition, it should be noted that each single IFRS adopted entity should select and apply similar accounting policies for similar transactions, events and
conditions (Bahadır & Tolga, 389). However, if an IFRS specifically requires or permits diversification of items for which different policies may be appropriate, that specific IFRS offers accounting policy choices.
In terms of IFRS accounting policy choices, there are many research papers particularly prepared after the IFRS adoption in the country-specific and sector-specific context.
In the country-specific context, it is possible to see many papers observing the trends of IFRS accounting policy choices from the perspective of different IFRS adopted countries. For instance, Kvaal & Nobes (2010) examined German, French, British, Spanish, and Australian listed companies to observe the trends of 16 IFRS accounting policy choices (IAS 1, IAS 2, IAS 7, IAS 16, IAS 31, IAS 39, IAS 40) and they repeated this research in Kvaal & Nobes (2012). Furthermore, Nobes (2011) regarding Italian, Swedish, Dutch and Nobes (2013) regarding Canadian listed companies examined the trends of 14 IFRS accounting policy choices (IAS 1, IAS 2, IAS 7, IAS 16, IAS 31, IAS 39, IAS 40).
In addition, the paper of Bahadır & Tolga (2013) in terms of 11 accounting policy choices (IAS 1, IAS 2, IAS 7, IAS 16, IAS 38, IAS 40), and Akdoğan & Öztürk (2015) in terms of 14 accounting policy choices (IAS 1, IAS 2, IAS 16, IAS 31, IAS 38, IAS 40) examined the trends of IFRS accounting policy choices from the perspective of Turkish listed companies.
Within the framework these papers of Kvaal & Nobes (2010), Kvaal & Nobes (2012), Nobes (2011), Nobes (2013), Bahadır & Tolga (2013) and Akdoğan & Öztürk (2015), findings show that there is an influence of local GAAP over the IFRS accounting policy choices if IFRS permits an accounting policy that is available in local GAAP and this creates a diversification in financial reporting at different levels among countries. This diversification will be questioned in this research from the perspective of petroleum companies.
On the other hand, there are also some papers which determine the trends of accounting policy choices in the sector-specific context. These papers refer to
accounting policy choices in non-IFRS or IFRS context. For instance, Jaafar & Mcleay (2007) examined country and sector effects on the harmonization of accounting policy choice regarding inventory costing and depreciation methods prior to the IFRS adoption in Europe (Austria, Belgium, Denmark, Finland, France, Germany, Ireland, Italy, Netherlands, Portugal, Spain, Sweden, United Kingdom), by assuming that accounting is harmonized when “all firms operating in similar circumstances adopt the same accounting treatment for similar transactions regardless of their domicile”. This research indicates that country of domicile and sector of operations are significant determinants in accounting policy choice in the European context but particular determinant is country of domicile which deteriorates accounting harmonization according to Jaafar & Mcleay (2007). In line with Jaafar & Mcleay (2007), Stadler & Nobes (2014) verify that country factors have an important place over the IFRS accounting policy choices.
Furthermore, Mueller et al. (2008) examined the companies of European real estate sector in terms of the IFRS accounting policy choice offered by IAS 40 (cost model or fair value model) and determined that firms are more likely to choose the fair value model when the firm’s pre-IFRS local accounting standards permitted or required fair values on the balance sheet.
On the other hand, it should be noted that accounting policy choice regarding the extractive industry is also diversified in the global context but this diversification has not yet regulated by IFRS 6 (Karapınar et al. 2012). From the IFRS perspective, since there is no regulation on the accounting policy choice regarding extractive industry, IAS 8 states that it allows extractive companies to continue applying the accounting policy in use prior to the issue of a new regulatory IFRS 6 (Power et al. 2017). In this case, there are two possibilities: (1) either preference will be given to local accounting policy or (2) preference will be given to a specific accounting policy choice for the purpose of generating comparative and consistent financial information regarding extractive industry and more specifically regarding petroleum industry in the IFRS context.
In this context, it should be stated that there are three different cost methods that are used to report costs related to monitoring, acquisition, exploration, development, construction, production and rehabilitation of extractive products: (1) Full Costing Method, (2) Successful Efforts Method, and (3) Area of Interest Method (IASC 2000; Karapınar et al. 2012) but the most frequently preferred methods are FCM and SEM (Noel et al. 2010; Abdo 2016; Power at al. 2017; Boz 2018, 40). SEM is used by most large petroleum companies but FCM is used by many mid-size to small petroleum companies (IASC 2000). While only costs that led to the successful discovery of oil can be capitalized under the SEM, all costs generated by exploration activity could be capitalized under the FCM (Noel et al. 2010). In terms of full costing method, it should be emphasized that the costs of unsuccessful exploration are also included in the amount of capitalization, creating an enhancement effect on earnings. Generally speaking, if net income generated by two methods is compared, it is known that net income under the SEM is less than under the FCM (Noel et al. 2010).
Table 2.1: Summary of Cost Methods
Source: (Karapınar et al. 2012)
Regarding the accounting policy choices on extractive industry, in the accounting literature, there are essentially three research papers that examine these accounting policy choices in recognizing the costs generated in extractive industry as the following Karapınar et al. (2012), Abdo (2016) and Power at al. (2017). These papers established different samples to analyze the trend of accounting
policy choices of the oil and gas companies in recognizing the costs generated in extractive industry in the IFRS context. For instance, (1) Karapınar et al. (2012) established a sample of extractive companies from Turkey, (2) Abdo (2016) prepared a sample of 122 upstream oil and gas companies from around the world and Power et al. (2017) created a sample of extractive companies from London Stock Exchange.
Within the framework of these papers (Jaafar & Mcleay 2007; Mueller et al. 2008; Noel et al. 2010; Karapınar et al. 2012; Abdo 2016; Power at al. 2017; and Stadler & Nobes 2014), diversification of IFRS accounting policy choices still exists in the sector-specific context and this situation will be questioned from the perspective of petroleum companies in this research.
In the general context of Jaafar & Mcleay (2007) and Stadler & Nobes (2014), it is possible to see that local accounting policies have an influence over the accounting policies adopted in the sector-specific context. That is why it looks like that if this situation keeps going on, accounting harmonization in the sector-specific context may not be possible.
By taking the prior research mentioned above, chapter 4 of this thesis will contribute to the financial reporting literature in the following issues: (1) determination of the trend of GAAP in terms of the major upstream petroleum companies; and (2) determination of the accounting policy choices in the context of the major upstream IFRS petroleum companies.
2.2. Financial Performance Analysis and Portfolio Optimization for Petroleum Companies
Financial performance analysis refers to evaluating a company’s financial strengths and weaknesses by taking its accounting and other financial data into account. Regarding the measurement of financial performance of petroleum companies, two recent research papers were determined to establish the basis to take the financial picture of petroleum companies.
The paper of Jurkowski & Daly (2015) examines the financial condition and stability of seven oil companies in the BRIC group of countries regarding their leverage ratios, liquidity ratios, profitability/efficiency ratios, and market value ratios. In this context, the following ratios were used to investigate the general financial health of these companies: liquidity ratios (Current, Quick), profitability/equity ratios (ROA, ROE), leverage ratios (Debt to Equity), and market value ratios (Price Earnings Ratio).
Another paper that is related to the financial performance of petroleum companies belongs to Hazarika (2015). This study was undertaken to analyze the financial performance in terms of profitability, efficiency, liquidity and financial health of top five oil and gas companies worldwide based on revenues, net income, market value and principal operations with reference to crude oil prices. In this regard, the following ratios were used to investigate the general financial health of these companies: liquidity ratios (Current), efficiency ratios (Asset Turnover, Inventory Turnover, and Receivables Turnover), profitability/equity ratios (ROA, ROE, and ROC), and leverage ratios (Debt to Equity).
Within the framework of these papers, a comparative list of financial ratios that were used to measure the financial performance of petroleum companies is presented below:
Table 2.2: Comparative Prior Research
Classification of Ratios Jurkowski & Daly (2015) Hazarika (2015) Liquidity Current Ratio, Quick Ratio Current Ratio
Efficiency Ratios None Asset Turnover, Inventory Turnover, Receivables Turnover
Profitability/Equity Ratios ROA, ROE ROA, ROE, ROC Leverage Ratios Debt to Equity Debt to Equity Market Value Ratios Earnings per Share,
Price Earnings Ratio
By taking the prior research into consideration, chapter 5 of this thesis will contribute to the accounting literature in the following issues: (1) analysis of the financial position and (2) financial performance of the major upstream quoted IFRS petroleum companies.
In addition, this thesis improves the paper of Jurkowski & Daly (2015) that states that investing into the shares of petroleum companies is based on investor’s preference and risk tolerance within the framework of ratio analysis, particularly in the context of ROA, ROE, earning per share and price-earnings ratio. However, this research focuses on portfolio optimization in addition to ratio analysis to try to meet reasonable information needs on investor’s preference and risk tolerance in terms of risk minimization and return maximization. It creates portfolios that are made up of the shares of petroleum and develops different investment scenarios using a variety of returns and risk scenarios. Chapter 6 was designed to improve what was stated by the paper of Jurkowski & Daly (2015).
CHAPTER 3
RESEARCH DATA AND METHODOLOGY
Chapter 3 organizes the data and methodology of this research under the following sub-headings: (1) Research Methodology; (2) Research Design; (3) Research Sample; (4) Research Instrument; and (5) Procedure for Data Collection.
3.1. Research Methodology
This thesis uses a quantitative research method. The data for accounting policies and financial performance analysis are hand-collected from financial statements. Data related to accounting policies and financial performance analysis uses frequency distribution method and financial ratios, respectively as research methodology. In addition, the data for portfolio optimization is hand-collected as well from company’s investor relations websites or from respected finance websites. This data uses computerized financial spreadsheet applications as research methodology.
3.2. Research Design
Research design of this thesis is in the form of a quantitative interpretive study where the research on accounting policies, financial performance analysis and portfolio optimization are realized, quantified and interpreted.
3.3. Research Sample
For the purpose of this research, four samples were established based on the list of largest oil and gas companies by revenue published by Wikipedia in 2015.
First of all, in order to focus on petroleum companies, gas companies presented in Wikipedia list were eliminated unless one company has both oil and gas exploration operations. In this regard, it should be noted that these four samples cover the major upstream petroleum companies according to the revenue constraint.
In the context of the first sample, major upstream non-IFRS and IFRS petroleum companies whose shares are quoted in stock exchanges were selected to determine the trend of GAAP in this industry except for the fact that one non-quoted company (Turkish Petroleum) is added to the sample from Turkey as part of the contribution of the paper of Karapınar (2012).
This first sample consists of 30 companies in the global context. It refers to 21 countries from all continents except Africa. It covers companies from Austria, Brazil, Canada, China, Colombia, France, Greece, Hong Kong, India, Italy, Japan, Malaysia, Mexico, Netherlands, Norway, Russia, Spain, Thai, Turkey, United Kingdom, and US. It shows a combination of non-IFRS + IFRS based geographical diversification of this industry as seen on Table 3.1.
In the second sample, non-IFRS companies were eliminated from the first sample to focus on the accounting policy choices of major upstream IFRS petroleum companies. This sample consists of 23 companies in the global context. It refers to 18 countries from all continents except Africa. It covers companies from Austria, Brazil, Canada, China, Colombia, France, Greece, Hong Kong, Italy, Malaysia, Mexico, Netherlands, Norway, Russia, Spain, Thai, Turkey, and United Kingdom. It shows a combination of IFRS based geographical diversification of this industry. These companies are shown in Table 3.2.
The third sample is made up of major upstream quoted IFRS petroleum companies whose 2015 ROA and ROE ratios are positive and whose earnings per share is available on the annual reports for the purpose of financial performance analysis. In this regard, Petronas whose earnings per share is not available in its annual report as well as Turkish Petroleum whose shares are not quoted in Borsa Istanbul were excluded from the sample. The sample consists of 10 companies. These companies are shown in Table 3.3.
Table 3.1: Major Upstream Non-IFRS + IFRS Petroleum Companies
NUMBER COMPANY COUNTRY GAAP
1 OMV Group Austria IFRS
2 Petrobras Brazil IFRS
3 Suncor Energy Canada IFRS
4 Petro China China IFRS
5 Sinopec China IFRS
6 Eco petrol Colombia IFRS
7 Total France IFRS
8 Hellenic Petroleum Greece IFRS
9 Motor Oil Hellas Greece IFRS
10 China National Hong Kong IFRS
11 Eni Italy IFRS
12 Petronas Malaysia IFRS
13 Pemex Mexico IFRS
14 Statoil Norway IFRS
15 Rosneft Russia IFRS
16 Gazprom Russia IFRS
17 Lukoil Russia IFRS
18 Cepsa Spain IFRS
19 PTT Thai IFRS
20 Turkish Petroleum Turkey IFRS
21 BP United Kingdom IFRS
22 Royal Dutch Shell UK / NL IFRS
23 Centrica United Kingdom IFRS
24 Exonmobil US US GAAP
25 Chevron US US GAAP
26 ConocoPhillips US US GAAP
27 Reliance India Indian GAAP
28 Baharat India Indian GAAP
29 Indian oil corporation India Indian GAAP
Table 3.2: Major Upstream IFRS Petroleum Companies
NUMBER COMPANY COUNTRY GAAP
1 OMV Group Austria IFRS
2 Petrobras Brazil IFRS
3 Suncor Energy Canada IFRS
4 Petro China China IFRS
5 Sinopec China IFRS
6 Eco petrol Colombia IFRS
7 Total France IFRS
8 Hellenic Petroleum Greece IFRS
9 Motor Oil Hellas Greece IFRS
10 China National Hong Kong IFRS
11 Eni Italy IFRS
12 Petronas Malaysia IFRS
13 Pemex Mexico IFRS
14 Statoil Norway IFRS
15 Rosneft Russia IFRS
16 Gazprom Russia IFRS
17 Lukoil Russia IFRS
18 Cepsa Spain IFRS
19 PTT Thai IFRS
20 Turkish Petroleum Turkey IFRS
21 BP United Kingdom IFRS
22 Royal Dutch Shell UK / NL IFRS
Table 3.3: Major Upstream Quoted IFRS Petroleum Companies
NUMBER COMPANY COUNTRY STOCK EXCHANGE
1 Petro China China IFRS - Hong Kong
2 Total France IFRS - Paris
3 Hellenic Petroleum Greece IFRS - Athens
4 Motor Oil Hellas Greece IFRS - Athens
5 China National China IFRS - Hong Kong
6 PTT Thai IFRS - Thailand
7 Rosneft Russia IFRS - London
8 Gazprom Russia IFRS - London
9 Lukoil Russia IFRS - London
10 Royal Dutch Shell UK / NL IFRS - London
The fourth sample covers major upstream quoted IFRS petroleum companies whose 2015 ROA and ROE ratios are positive, whose earnings per share is available and whose number of missing share price observations are acceptable/tolerable levels. In this context, Petronas and PTT were excluded from this sample. This sample consists of 9 companies that are shown in Table 3.4.
Table 3.4: Major Upstream IFRS Petroleum Companies for Portfolio Optimization
NUMBER COMPANY COUNTRY STOCK EXCHANGE
1 Petro China China IFRS - Hong Kong
2 Total France IFRS - Paris
3 Hellenic Petroleum Greece IFRS - Athens
4 Motor Oil Hellas Greece IFRS - Athens
5 China National China IFRS - Hong Kong
6 Rosneft Russia IFRS - London
7 Gazprom Russia IFRS - London
8 Lukoil Russia IFRS - London
3.4. Research Instruments
In order to gather the data three research instruments were used during the research process:
(1) For the purpose of collecting data on accounting policies, a checklist was prepared to find out the results of the following 18 hypothesis:
a. H1: Major upstream petroleum companies are inclined to adopt their country of domicile’s local GAAP in terms of financial reporting rather than IFRS.
b. H2: Major upstream IFRS petroleum companies are inclined to use the title of “Statement of Financial Position” rather than “Balance Sheet”.
c. H3: Major upstream IFRS petroleum companies are inclined to prepare a Statement of Financial Position according to liquidity order rather than current/non-current distinction.
d. H4: Major upstream IFRS petroleum companies are inclined to prepare a Statement of Financial Position in liquidity decreasing order rather than liquidity increasing.
e. H5: Major upstream IFRS petroleum companies are inclined to prepare a Statement of Financial Position in the format of “Assets = Liabilities + Equity” rather than “Assets - Liabilities = Equity”. f. H6: Major upstream IFRS petroleum companies are inclined to prepare a Statement of Profit or Loss by function rather than by nature.
g. H7: Major upstream IFRS petroleum companies are inclined to prepare “Statement of Comprehensive Income” using one statement approach rather than two statement approach.
h. H8: Major upstream IFRS petroleum companies are inclined to prefer First-in First-Out (FIFO) as their cost flow assumptions rather than Weighted Average (WA).
i. H9: Major upstream IFRS petroleum companies are inclined to prefer “direct method” rather than “indirect method” in reporting cash flows from operations on the Statement of Cash Flows.
j. H10: Major upstream IFRS petroleum companies are inclined to report “dividend paid” on the operating section of the Statement of Cash Flows rather than financing section of the Statement of Cash Flows.
k. H11: Major upstream IFRS petroleum companies are inclined to report “interest paid” on the operating section of the Statement of Cash Flows rather than financing section of the Statement of Cash Flows.
l. H12: Major upstream IFRS petroleum companies are inclined to report “interest received” on the operating section of the Statement of Cash Flows rather than investing section of the Statement of Cash Flows.
m. H13: Major upstream IFRS petroleum companies are inclined to report “dividend received” on the operating section of the Statement of Cash Flows rather than investing section of the Statement of Cash Flows.
n. H14: Major upstream IFRS petroleum companies are inclined to depreciate their property, plant and equipment according to straight-line depreciation and/or units of production rather than double-declining balance.
o. H15: Major upstream IFRS petroleum companies are inclined to recognize their property, plant and equipment according to revaluation model rather than cost model after the initial recognition.
p. H16: Major upstream IFRS petroleum companies are inclined to recognize their intangible assets according to revaluation model rather than cost model after the initial recognition.
q. H17: Major upstream IFRS petroleum companies are inclined to recognize their investment property according to fair value model rather than cost model after the initial recognition.
r. H18: Major upstream IFRS petroleum companies are inclined to report their exploration and evaluation expenditures on petroleum resources using “Full Cost Method” rather than “Successful Efforts Method”.
(2) For the purpose of collecting data on financial performance analysis, the author prepared spreadsheets to calculate financial ratios and transformed those quantitative data into bar charts.
(3) For the purpose of collecting data on portfolio optimization, the author used appropriate spreadsheet functions in the context of return maximization and risk minimization.
3.5. Procedure for Data Collection
In order to collect the data, audited 2015 annual reports and share prices of the petroleum companies were downloaded into the personal computer of the author in terms of accounting policies, financial performance analysis and portfolio optimization.
CHAPTER 4
RESEARCH FINDINGS ON ACCOUNTING POLICIES REGARDING MAJOR UPSTREAM PETROLEUM COMPANIES
This chapter provides research findings about the GAAP adopted by the major upstream petroleum companies and accounting policy choices adopted by the major upstream IFRS petroleum companies.
4.1. Generally Accepted Accounting Practices Adopted by Major Upstream Petroleum Companies
H1: Major upstream petroleum companies are inclined to adopt their country of domicile’s local GAAP in terms of financial reporting rather than IFRS.
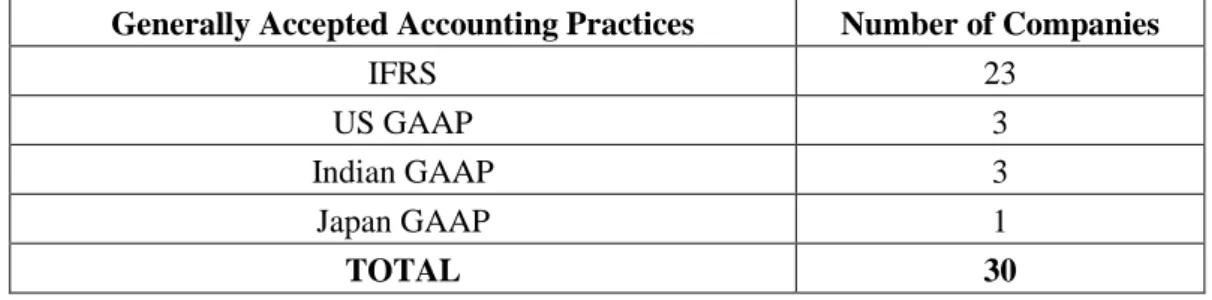
This hypothesis was rejected by the research findings because it was observed that 23 petroleum companies prepare their financial statements in accordance with IFRS regardless of their country of domicile, and the remaining 7 companies prefer adopting their local GAAP in terms of financial reporting (US GAAP, Indian GAAP, and Japan GAAP). These findings also indicate that the majority of the sampled petroleum companies (76%) either listed or non-listed are inclined to prepare their financial reports in accordance with IFRS rather than local GAAP in order to provide international comparability within the sector as seen on Table 4.1 and Figure 4.1.
Table 4.1: Adoption of Different GAAP among Petroleum Companies
Generally Accepted Accounting Practices Number of Companies
IFRS 23
US GAAP 3
Indian GAAP 3
Japan GAAP 1
76% 10%
10% 4%
IFRS US GAAP INDIAN GAAP JAPAN GAAP
Figure 4.1: GAAP among Major Upstream Petroleum Companies
4.2. Accounting Policy Choices Adopted by Major Upstream IFRS Petroleum Companies
4.2.1. Brief Summary of IAS 1 Presentation of Financial Statements
IAS 1 is the main part of financial statements preparation and presentation (IASB 2015, 38-40). It declares a complete set of financial statements. In this context, a complete set of financial statements, which should be comparatively presented, at least annually, includes:
• A statement of financial position (sometimes called the balance sheet); • Either: a single statement of profit or loss and other comprehensive
income; or two statements—a statement of profit or loss (sometimes called an income statement either by function or by nature), and a statement of comprehensive income (starting with profit or loss and presenting income and expenses that are not recognized in profit or loss);
• A statement of changes in equity; • A statement of cash flows; and
• Notes, contains a summary of significant accounting policies, management judgments, estimations and explanatory information.
Financial statements must present fairly and clearly the financial position, financial performance and cash flows of an entity and are prepared on a going concern basis that is, assessing that the entity will continue its operations for the expecting future.
Assets and liabilities are classified as current or non-current, except when a presentation based on liquidity would provide information that is reliable and more relevant.
4.2.2. Research Findings related to IAS 1
1. H2: Major upstream IFRS petroleum companies are inclined to use the title of “Statement of Financial Position” rather than “Balance Sheet”.
According to the research findings, even if IAS 1 primarily prefers the title of “Statement of Financial Position”, the slightly dominant practice between the use of the title of “Statement of Financial Position” and “Balance Sheet” among the major upstream IFRS petroleum companies is “Balance Sheet”. That is why this hypothesis was rejected as seen on Table 4.2.
Table 4.2: Title of Statement of Financial Position
Number of Companies %
Balance Sheet 12 52%
Statement of Financial Position 11 48%
TOTAL 23 100%
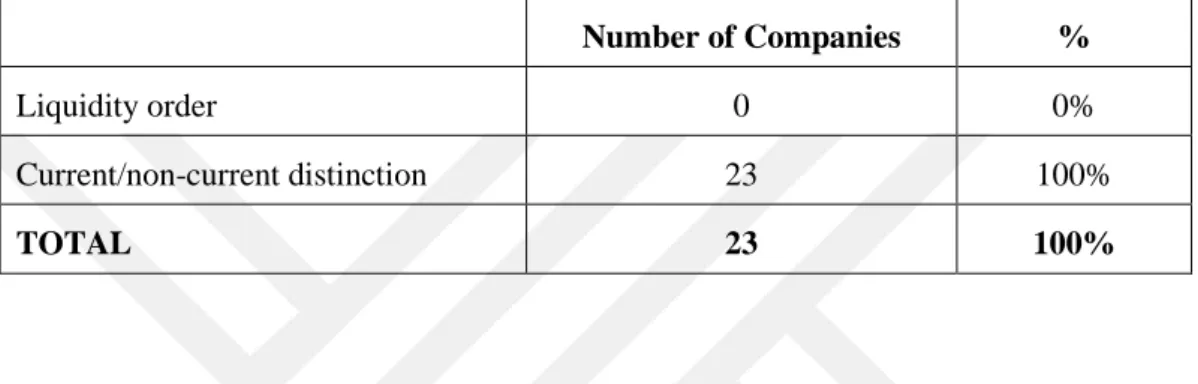
2. H3: Major upstream IFRS petroleum companies are inclined to prepare a Statement of Financial Position according to liquidity order rather than current/non-current distinction.
According to the research findings, major upstream IFRS petroleum companies are fully inclined to prepare a “Statement of Financial Position” according current/non-current distinction of assets and liabilities. They easily classify their assets and liabilities in this context. It looks like that they don’t experience any reporting problem to switch from current/non-current distinction to prefer presentation based on liquidity. That is why this hypothesis was rejected as seen on Table 4.3.
Table 4.3: Classification of Assets and Liabilities
Number of Companies %
Liquidity order 0 0%
Current/non-current distinction 23 100%
TOTAL 23 100%
3. H4: Major upstream IFRS petroleum companies are inclined to prepare a Statement of Financial Position in liquidity decreasing order rather than liquidity increasing.
According to the research findings, the slightly dominant practice between the classification of assets and liabilities is in liquidity decreasing order in this industry. That is why this hypothesis was accepted as seen on Table 4.4.
Table 4.4: Classification of Assets and Liabilities
Number of Companies %
Current/non-current distinction 12 52%
Non-current/current distinction 11 48%
TOTAL 23 100%
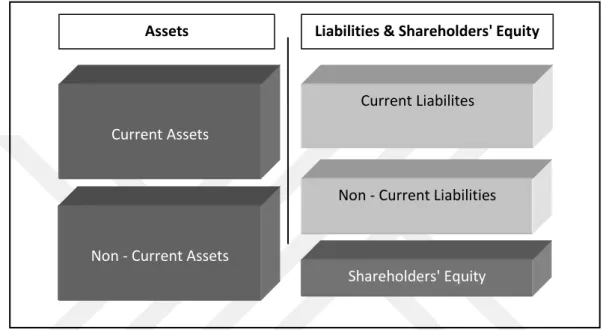
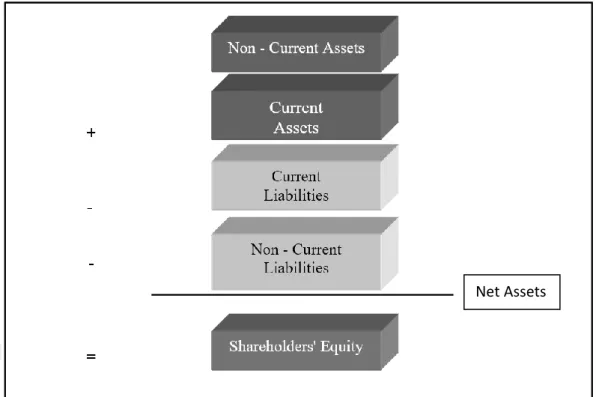
4. H5: Major upstream IFRS petroleum companies are inclined to prepare a Statement of Financial Position in the format of “Assets = Liabilities + Equity” rather than “Assets - Liabilities = Equity”.
According to the research findings, major upstream IFRS petroleum companies prepare their statement of financial position using three different formats: (1) US GAAP, (2) EU (Continental European), and (3) EU (Anglo Saxon).
In this context, the figures related to these three different formats of statement of financial position are provided below.
Figure 4.2: US GAAP Format of Statement of Financial Position
Figure 4.3: EU Continental European Format of Statement of Financial Position Non - Current Liabilities
Assets Shareholders' Equity & Liabilities
Non - Current Assets
Current Assets
Shareholders' Equity
Current Liabilities
Assets Liabilities & Shareholders' Equity
Current Assets
Non - Current Assets
Shareholders' Equity Non - Current Liabilities
Figure 4.4: EU Anglo-Saxon Format of Statement of Financial Position
In this research, due to the fact that IFRS research sample is made up of petroleum companies whose country of domicile is from different continents of the world, it is possible to observe different formats of balance sheet under the influence of these countries’ local accounting practice as seen on Table 4.5. Prior research also proves this fact (Akdoğan & Öztürk 2015).
Table 4.5: Format of the Statement of Financial Position
Number of Companies %
US GAAP 12 52%
EU - Continental European 8 35%
EU - Anglo Saxon 3 13%
TOTAL 23 100%
According to the research findings, the majority of the sampled IFRS petroleum companies are inclined to prepare a Statement of Financial Position in
the format of “Assets = Liabilities + Equity” in the context of US GAAP and Continental European formats. That is why this hypothesis was accepted.
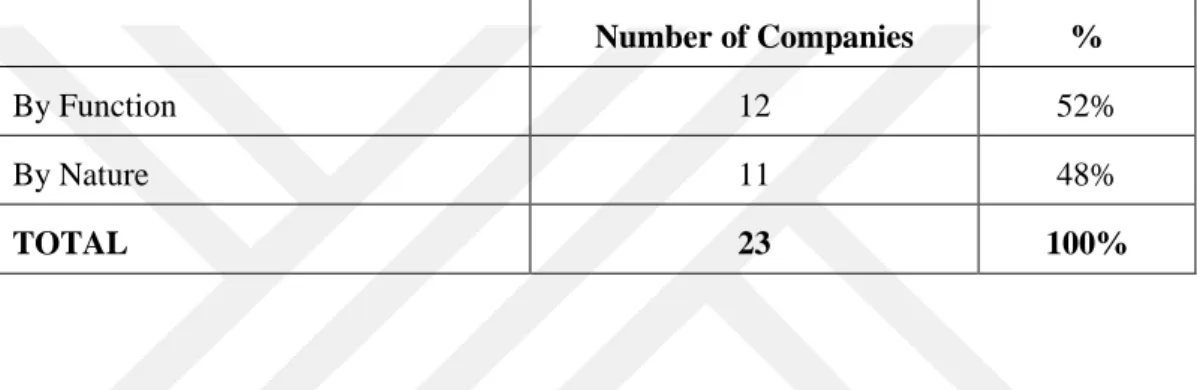
5. H6: Sampled IFRS petroleum companies are inclined to prepare a Statement of Profit or Loss by function rather than by nature.
According to the research findings, the slightly dominant practice regarding the preparation of an income statement is by function in this industry. That is why this hypothesis was accepted as seen on Table 4.6.
Table 4.6: Format of the Statement of Profit or Loss
Number of Companies %
By Function 12 52%
By Nature 11 48%
TOTAL 23 100%
6. H7: Major upstream IFRS petroleum companies are inclined to prepare “Statement of Comprehensive Income” using one statement approach rather than two statement approach.
According to the research findings, the slightly dominant practice in the preparation of a statement of comprehensive income is the statement with
one-statement approach. That is why this hypothesis was accepted as seen on Table 4.7.
Table 4.7: Format of the Statement of Comprehensive Income
Number of Companies %
One-statement approach 12 52%
Two-statement approach 11 48%
Within the framework of these 6 hypotheses regarding IAS 1, this research points out that the differentiation in accounting practices still exists among the major upstream IFRS petroleum companies.
4.2.3. Brief Summary of the IAS 2 Inventory
Inventories are assets held for sale as soon as it is finished goods (IASB 2015, 41-42). Moreover, raw materials and supplies all are considered inventories to be consumed in the production process.
Inventory is measured initially at its cost to the entity, either the cost of buying it or the cost of producing it. The cost of finished goods comprises raw materials, direct labor, other direct costs and related production overheads, but excludes borrowing costs.
Inventories are measured in the statement of financial position at their cost or, if lower, net realizable value. Net realizable value is the estimated selling price in the ordinary course of business, less the cost of completion and selling expenses.
Consequently, the cost of items of inventory that are neither unique nor segregated for specific projects is assigned using either the first-in, first-out (FIFO) or the weighted average cost formula. The same cost formula must be used for all inventories having a similar nature and use.
4.2.4. Research Findings related to IAS 2
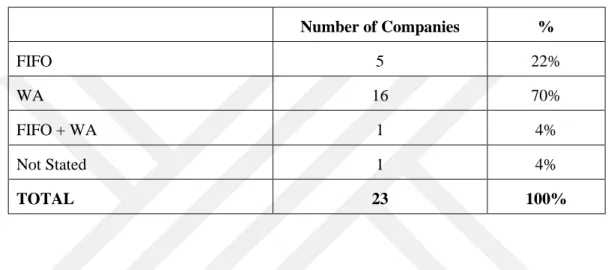
1. H8: Major upstream IFRS petroleum companies are inclined to prefer FIFO as their cost flow assumptions rather than WA.
According to the research findings, the majority of major upstream IFRS petroleum companies prefer WA method rather than FIFO method as their cost flow assumptions. This result is in parallel to the prior research of Jaafar & Mcleay (2007) because this prior research indicates that resource-based industry like petroleum industry focuses on primarily WA and then FIFO in the European
context with a large sample size. This hypothesis was rejected as seen on Table 4.8.
Table 4.8: Inventory Cost Flow Assumptions
Number of Companies % FIFO 5 22% WA 16 70% FIFO + WA 1 4% Not Stated 1 4% TOTAL 23 100%
Within the framework of this hypothesis regarding IAS 2, this research points out that the differentiation in accounting practice still exists among the IFRS petroleum companies but the differentiation in cost flow assumptions is much more balanced than the results related to IAS 1.
4.2.5. Brief Summary of IAS 7 Statement of Cash Flows
The statement of cash flows is one of the most important statements in the financial statements (IASB 2015, 43-44). A statement of cash flows provides information to users of financial statements to evaluate the changes in the net assets of the entity, its financial position including liquidity and solvency, and its ability to affect the amounts and timing of cash flows in order to adapt to changing circumstances and opportunities.
The statement of cash flows describes the movements in cash and cash equivalents. IAS 7 requires the cash flows to be classified into three activities; investing, financing and operating.
Investing activities comprise the acquisition and disposal of long-term assets and investments that are not cash equivalents. Examples include a cash payment to purchase machinery and a cash payment to purchase equity investments.
Financing activities cover changes in the borrowings and in the contributed equity capital of the entity. Examples include a cash payment to redeem preference shares, cash proceeds from issuing debentures and the capital element of a lessee’s payment under a finance lease.
Operating activities cover the revenue-producing activities of the entity, and all other activities that are neither investing nor financing. Examples include the cash received from customers for goods sold to them and cash paid to suppliers for goods and services, such as gas and electricity that were purchased from them.
The Standard allows cash flows from operating activities to be presented using either the direct method or indirect method versus cash flows from investing and financing activities must be presented using the direct method. According to the direct method, major classes of gross cash receipts and gross cash payments are shown, for example, the cash received from customers is shown; whereas, according to the indirect method, the starting point is profit or loss and this is adjusted for non-cash items, for example, depreciation and the increase, or decrease, in trade receivables, to determine net cash inflow, or outflow, from operating activities.
In addition, dividend paid and received as well as interest paid and received is classified as follows:
1. Dividend paid: Can be classified as operating or financing cash flows. Similarly, for non-financial companies,
2. Interest paid: Can be classified as operating or financing cash flows, whereas
3. Interest and dividend received: Can be classified as operating or investing cash flows.
4.2.6. Research Findings related to IAS 7
1. H9: Major upstream IFRS petroleum companies are inclined to prefer “direct method” rather than “indirect method” in reporting cash flows from operations on the Statement of Cash Flows.
According to the research findings, the majority of the major upstream IFRS petroleum companies are inclined to prefer “indirect method” rather than “direct method” as seen on Table 4.9. That is why this hypothesis was rejected. Table 4.9: Format of the Cash Flows from Operations
Number of Companies %
Direct Method 6 26%
Indirect Method 16 70%
Not Stated 1 4%
TOTAL 23 100%
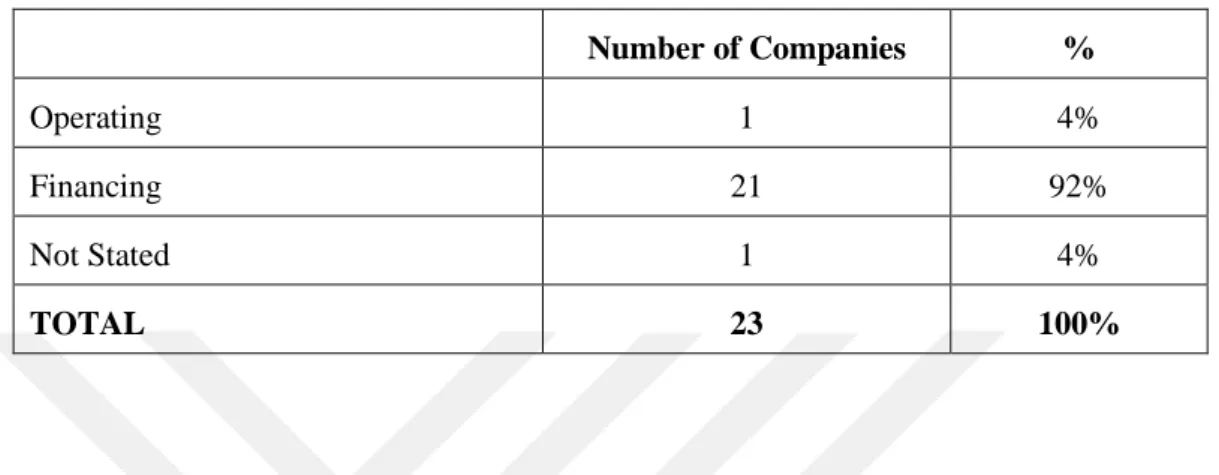
2. H10: Major upstream IFRS petroleum companies are inclined to report “dividend paid” on the operating section of the Statement of Cash Flows rather than financing section of the Statement of Cash Flows.
According to the research findings, almost all IFRS petroleum companies are inclined to report “dividend paid” on the financing section of the Statement of Cash Flows rather than operating section of the Statement of Cash Flows as seen on Table 4.10. That’s why this hypothesis was rejected.
Table 4.10: Classification of Dividend Paid
Number of Companies %
Operating 1 4%
Financing 21 92%
Not Stated 1 4%
TOTAL 23 100%
3. H11: Major upstream IFRS petroleum companies are inclined to report “interest paid” on the operating section of the Statement of Cash Flows rather than financing section of the Statement of Cash Flows.
According to the research findings, more than half of IFRS petroleum companies are inclined to report “interest paid” on the financing section of the Statement of Cash Flows rather than operating section of the Statement of Cash Flows as seen on Table 4.11. That’s why this hypothesis was rejected.
Table 4.11: Classification of Interest Paid
Number of Companies %
Operating 8 35%
Financing 13 57%
Not Stated 2 8%
TOTAL 23 100%
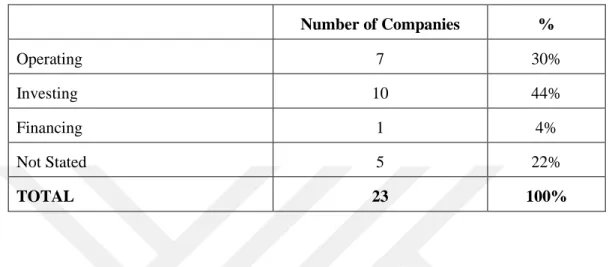
4. H12: Major upstream IFRS petroleum companies are inclined to report “interest received” on the operating section of the Statement of Cash Flows rather than investing section of the Statement of Cash Flows.
According to the research findings, almost half of the IFRS petroleum companies are inclined to report “interest received” on the investing section of the Statement of Cash Flows rather than operating section of the Statement of Cash Flows as seen on Table 4.12. That’s why this hypothesis was rejected.
Table 4.12: Classification of Interest Received
Number of Companies % Operating 7 30% Investing 10 44% Financing 1 4% Not Stated 5 22% TOTAL 23 100%
5. H13: Major upstream IFRS petroleum companies are inclined to report “dividend received” on the operating section of the Statement of Cash Flows rather than investing section of the Statement of Cash Flows.
According to the research findings, the majority of the IFRS petroleum companies are inclined to report “dividend received” on the investing section of the Statement of Cash Flows rather than operating section of the Statement of Cash Flows as seen on Table 4.13. That’s why this hypothesis was rejected.
Table 4.13: Classification of Dividend Received
Number of Companies %
Operating 6 26%
Investing 13 56%
Not Stated 4 18%
TOTAL 23 100%
Within the framework of these 5 hypotheses regarding IAS 7, this research points out that the differentiation in accounting practices still exists among the
major upstream IFRS petroleum companies. However, the differentiation regarding the cash flow statement is much more balanced among the companies compared to the results related to IAS 1.
4.2.7. Brief Summary of IAS 16 Property, Plant & Equipment
Almost all businesses own property, plant and equipment such as director office building, machinery to manufacture the products or vehicles for delivery (IASB 2015, 54-57). IAS 16 set out the procedures to clarify how to account for these assets.
PPE items are recorded initially at their cost, which includes all expenditure to get the item ready for use. Cost is measured as the fair value of what is paid, so if payment is deferred beyond normal credit terms, cost is the present value of the cash payment.
Because the item will be used over more than one accounting period, it is recognized as an asset in the statement of financial position. The cost does nevertheless need to be recognized as an expense, and depreciation is the method of accounting that is used to recognize that cost, or the relevant part of it, as an expense as the asset is consumed through its use in the business.
After acquisition, an entity may choose to measure PPE items either at cost less accumulated depreciation and accumulated impairment, or at a revalued amount, namely at its fair value at the date of valuation less any subsequent accumulated depreciation and accumulated impairment. If an entity chooses the revaluation model, valuations must be performed with sufficient regularity to ensure that the carrying amount of the asset does not differ materially from its fair value at the end of the reporting period and all assets within the same class of property, plant and equipment must be revalued.
4.2.8. Research Findings Related to IAS 16
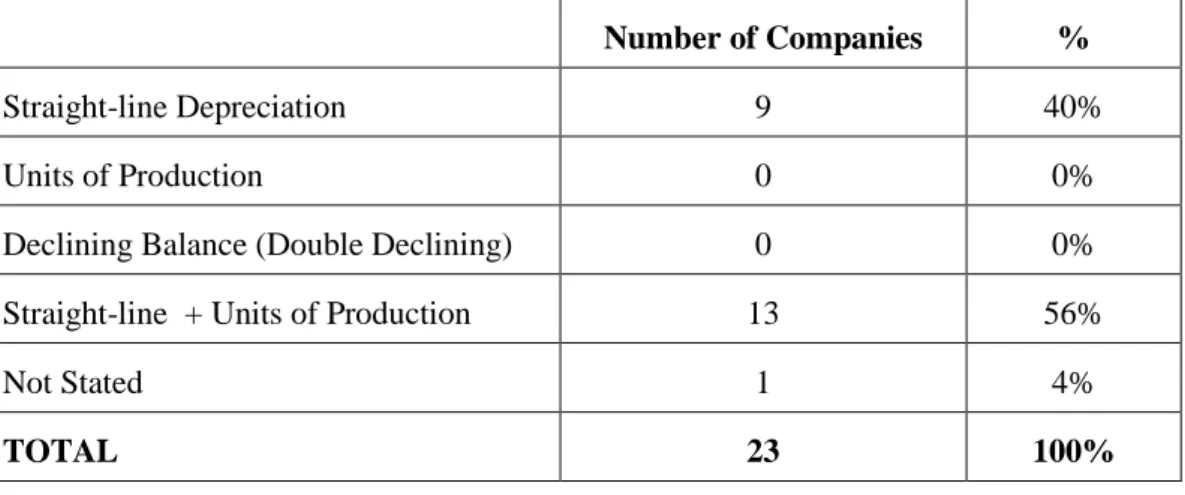
1. H14: Major upstream IFRS petroleum companies are inclined to depreciate their PPE items according to straight-line depreciation and/or units of production rather than double-declining balance.
According to the research findings, 40% of major upstream IFRS petroleum companies are inclined to depreciate their PPE items (including oil and gas production assets) using the straight-line depreciation method. However, more than half of the companies use units of production method to depreciate their oil and gas properties (oil and gas production assets) and straight-line method to depreciate their non-oil and non-gas PPE items.
This result is not in parallel to the prior research of Jaafar & Mcleay (2007) because this research with a large sample size indicates that resource-based industry focuses on primarily straight-line and then units of production under local GAAP in Europe. However, the findings of this thesis look like that current trend of recording depreciation of PPE items of IFRS petroleum companies moved to a combination of straight-line method and units of production methods for better financial reporting by considering depletion. In this context, by making a further research with a large sample size, it should be questioned whether this prior research still holds under IFRS practice or IFRS petroleum companies are inclined to prefer a combination of these two methods. Overall, this hypothesis holds in terms of PPE items other than oil and gas properties as seen on Table 4.14.
Table 4.14: Depreciation Methods Preferred by IFRS Petroleum Companies
Number of Companies %
Straight-line Depreciation 9 40%
Units of Production 0 0%
Declining Balance (Double Declining) 0 0%
Straight-line + Units of Production 13 56%
Not Stated 1 4%
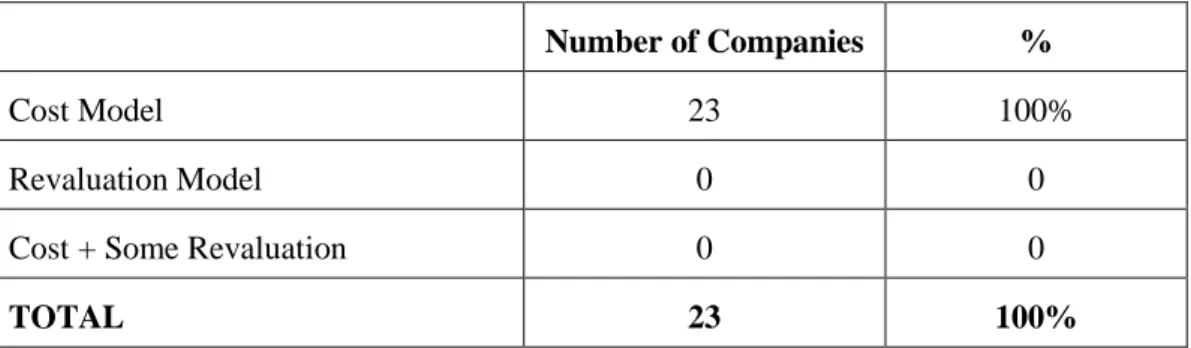
2. H15: Major upstream IFRS petroleum companies are inclined to recognize their PPE items according to revaluation model rather than cost model after the initial recognition.
According to the research findings, major upstream IFRS petroleum companies are fully inclined to recognize their PPE items according to cost model. That is why this hypothesis was rejected seen on Table 4.15. This result shows that IFRS petroleum companies are conservative in recognizing their PPE items after the initial recognition and they don’t want to state their PPE items at their revalued amounts because revaluation creates an additional cost for companies to acquire an expertise report that states the current market value of the PPE items.
Table 4.15: PPE Accounting Policy Choice After Initial Recognition
Number of Companies %
Cost Model 23 100%
Revaluation Model 0 0
Cost + Some Revaluation 0 0
TOTAL 23 100%
4.2.9. Brief Summary of IAS 38 Intangible Assets
An intangible asset is an identifiable non-monetary asset without physical substance; for example, computer software, licenses, patents and copyrights (IASB 2015, 96-98). Identifiable assets mean either it is sold separately from the business or it is arises from contractual or legal rights regardless of whether it is separable.
Many intangible assets have unique nature results in IAS 38 contain a safeguards and guidance. Intangible assets are measured at cost (1) if acquired separately at initial recognition; (2) if internally generated (self‑constructed if
tangible) at initial recognition; and (3) at fair value on initial recognition if acquired in a business combination.