İSTANBUL BİLGİ UNIVERSITY INSTITUTE OF SOCIAL SCIENCES
BANKING AND FINANCE MASTER'S DEGREE PROGRAM
IMPACT OF CBT RESERVE REQUIREMENTS ON BANK LOANS BETWEEN 2008 and 2016 AS A MACRO PRUDENTIAL POLICY TOOL
EROL BÜTÜN 115700012
SUPERVISOR Assoc. Prof. GENCO FAS
İSTANBUL 2018
iii
CONTENTS
LIST OF CHARTS ... v
LIST OF TABLES ... vii
LIST OF ABBREVIATIONS ... viii
ABSTRACT ... ix
ÖZET ... x
INTRODUCTION ... 1
1. RESERVE REQUIREMENTS IN LITERATURE ... 3
2. RESERVE REQUIREMENTS: CONCEPTUAL FRAMEWORK AND IMPLEMENTATION IN TURKEY AS A MACROPRUDENTIAL MEASURE ... 8
2.1: Impact on Money Supply Through Multiplier Effect ... 10
2.2: Impact on Loan Supply Through Cost Channel... 13
2.3: Implementation of Reserve Requirements in Turkey ... 19
3. TURKISH BANKING SECTOR STRUCTURE AND BANKING LOANS ... 28
4. DATA AND MODEL... 35
4.1: Reserve Requirements Series ... 35
4.2: Bank Loans Data ... 45
4.3: Short Term Interest Rates and Economic Activity ... 46
4.4: Event Analysis ... 49
4.5: Vector Auto Regression ... 53
4.6: Applying the Model ... 54
4.7: Impulse Response Function ... 63
CONCLUSION ... 70 References ... 72 ANNEX 1: ... 76 ANNEX 2: ... 78 ANNEX 3: ... 80 ANNEX 4: ... 81 ANNEX 5: ... 83 ANNEX 6: ... 85
iv
LIST OF FIGURES
Figure 2-1: Reserve Requirements on Banks Liabilities... 8
Figure 2-2: Impact of Reserve Requirements on deposit and loan rates ... 16
Figure 4-1 : TL Loans Stationary Test ... 59
v
LIST OF CHARTS
Chart 2-1: Interest rates paid to FX required and free accounts and commission
rates charged on accounts... 26
Chart 3-1 : Banking Sector Investment Shares Between 2002 and 2005. ... 30
Chart 3-2: Turkish Banking Sector Return on Equity vs Cost Of Capital ... 30
Chart 3-3: Turkish Banking Sector Loan, Deposit and Loan to Deposit Ratio ... 31
Chart 3-4: Banking Sector Loan Balances (Non Financial Sector Loans / Monthly In TL) ... 33
Chart 3-5: Deposits Share In Total Liabilities Between 2008 And 2016. ... 34
Chart 4-1: Average Reserve Requirement Ratios ... 36
Chart 4-2 : Banking Sector Maturity Breakdown (Monthly %) And Weighted Average Days To Maturity ... 39
Chart 4-3: Month Average Deposit Rates Vs Weighted Average Deposit Rates (%) Between 2008 And 2016 ... 40
Chart 4-4: Average RR And Cost-Based Effective RR For TL Liabilities ... 44
Chart 4-5 : Cost Effective Foreign Currency Reserve Requirement Ratio ... 44
Chart 4-6 : Central Bank Of Turkey Borrowing And Lending Rates ... 47
Chart 4-7 : Turkey Industrial Production Monthly Change ... 48
Chart 4-8 : Turkey Industrial Production Index ... 48
Chart 4-9 : Response Of Bank Loans In TRY To Reserve Requirement Change . 50 Chart 4-10 : Response Of Bank Loans In FX To Reserve Requirement Change .. 50
vi
Chart 4-12 : Response Of TRY Bank Loans To TRY Rates Changes... 51 Chart 4-13 : Response Of Bank Loans To Industrial Production Change ... 52 Chart 4-14 : TL Loans Response To Average Reserve Requirement Ratio
Changes ... 64 Chart 4-15: TL Loans Response To Marginal Reserve Requirement Ratio
Changes ... 64 Chart 4-16 : TL Loans Response To Cost Base Effective Reserve Requirement Ratio Changes ... 65 Chart 4-17: TL Loans Response To CBT Interest Rate Changes ... 65 Chart 4-18: TL Loans Response To Industrial Production Index Changes ... 66 Chart 4-19: FX Loans Response To Average Reserve Requirement Ratio
Changes ... 67 Chart 4-20: FX Loans Response To Marginal Reserve Requirement Ratio
Changes ... 67 Chart 4-21 : FX Loans Response To Cost Base Effective Reserve Requirement Ratio Changes ... 68 Chart 4-22: FX Loans Response To FX Interest Rate Changes ... 68 Chart 4-23 : FX Loans Response To Industrial Production Index Changes ... 69
vii
LIST OF TABLES
Table 2-1: Banking system consolidated balance sheet ... 12
Table 2-2: Simplified Bank Balance Sheet ... 15
Table 2-3: Balance Sheet Items Subject To Reserve Requirement... 20
Table 2-4: FX Reserve Requirement Ratios ... 22
Table 2-5: TL Reserve Requirement Ratios... 23
Table 4-1: Days To Maturity Breakdown For Deposits. ... 38
Table 4-2: Reserve Option Mechanism And Reserve Option Coefficient ... 41
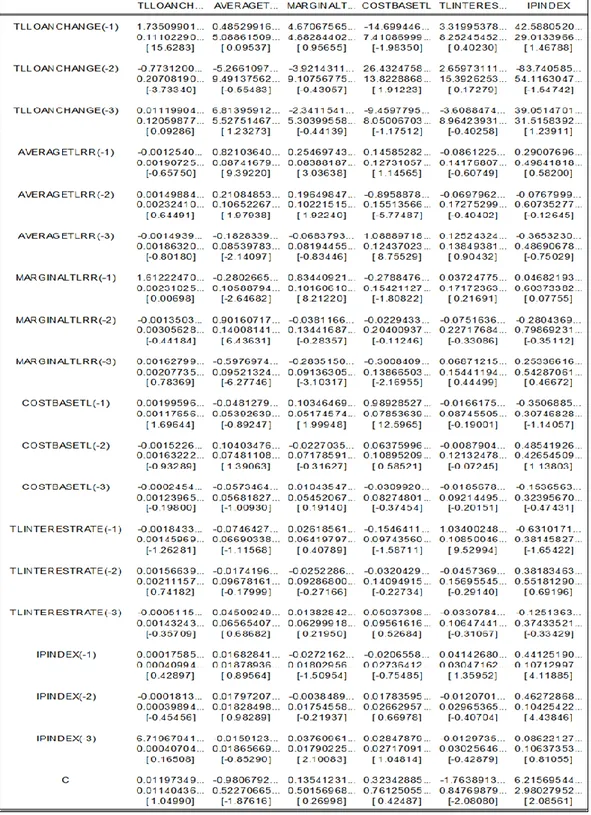
Table 4-3: VAR Estimation Results For TL Denominated Loans Produced By Eviews ... 60
Table 4-4: VAR Estimation Results For FX Denominated Loans Produced By Eviews ... 62
viii
LIST OF ABBREVIATIONS
AVERAGE_FX_RR : Average Foreign Currency Reserve Requirements
AVERAGETLRR : Average Turkish Lira Reserve Requirements
BRSA : Banking Regulation And Supervision Agency Of Turkey
BOJ : Bank Of Japan
CBT : The Central Bank Of The Republic Of Turkey
COSTBASEFX : Cost Base Foreign Currency Reserve Requirements
COSTBASETL : Cost Base Turkish Lira Reserve Requirements
DSGE : Dynamic Stochastic General Equilibrium Modeling
ECB : The European Central Bank
EM : Emerging Markets
EURIBOR : Euro Interbank Offered Rate
EVDS : The Central Bank Of The Republic Of Turkey
Electronic Data Delivery System
FED : The Federal Reserve / Central Bank Of The United
States
FX : Foreign Exchange / Foreign Currency
FXINTERESTRATE : Foreign Currency Interest Rates FXLOANCHANGE : Foreign Currency Loans Change
IPINDEX : Industrial Production Index
LIBOR : The London Interbank Offered Rate
ROC : Reserve Option Coefficient
ROM : Reserve Option Mechanism
RR : Reserve Requirements
RRR : Reserve Requirement Ratios
TBA : The Banks Association of Turkey
TL : Turkish Lira
ix
ABSTRACT
The utilisation of reserve requirements as a prudential monetary policy, especially in emerging countries, has increased following the global financial crisis of 2008-2009. Central Bank of Turkey used reserve requirements, among other things, in order to contain the impact of the crisis. This practice evolved after 2010 when it was considered that signs of recovery were beginning to appear. In this paper, the Central Bank of Turkey’s practices and their impacts are investigated on bank loans which have recorded considerable growth due to capital inflows. The Bank often used financial innovations such as ROM or adjusted reserve application framework in order to maintain financial stability. Further, cost of reserve requirements is not same for each bank but depends on how much banks use Central Bank’s innovative applications. Since banks’ main goal is profit maximisation, cost based reserve requirements tend to be lower than policy ratios. That is not to say, however, that there is no cost to banks from such utilisation. Using reserve requirements options will necessarily affect liquidity positions and profit maximisation efforts for banks. The vector auto regression model with four main variables is used to reveal the relation between RR and growth of bank loans. Although reserve requirements prove effective for some periods, it is argued that there is no conclusive evidence to prove that it would help contain an overheated economy.
Keywords: reserve requirements, bank loans, cost of reserve requirements, monetary transmission channels, vector auto regression.
x
ÖZET
Zorunlu karşılıkların bir makro ihtiyati politika aracı olarak kullanımı, 2008-2009 küresel finans krizini takip eden dönemde, başta gelişmekte olan ülkelerde olmak üzere artmıştır. Türkiye Cumhuriyet Merkez Bankası da zorunlu karşılıkları krizin etkilerini kontrol altına almak amacıyla kullanmıştır ve bu kullanım 2010 yılından sonra normalleşme sinyalleri alındığı varsayımı ile değişiklik göstermiştir. Bu çalışmada, Türkiye Cumhuriyet Merkez Bankası pratiği ve bunun sermaye akımları nedeniyle büyüme rekorları da kıran, banka kredileri üzerindeki etkisini incelenmiştir. Banka finansal istikrarı korumak amacıyla, ROM gibi finansal yenilikleri veya zorunlu karşılık oranları değişimlerini sık sık kullanmıştır. Bu nedenle, zorunlu karşılıkların maliyeti her banka için aynı değildir ve merkez bankasının yeni finansal imkanlarını ne kadar kullandığına bağlıdır. Bankaların ana amacı kar maksimizasyonu olduğu için maliyet bazlı zorunlu karşılık oranı politika, zorunlu karşılık oranından daha düşük oluşmaktadır. Diğer taraftan bu zorunlu karşılıklar bankalar açısından bu tür uygulamaların maliyetinin olmadığı demek değildir. Zorunlu karşılık imkanlarının kullanımı, bankaların likidite pozisyonlarını ve kar maksimizasyonu gayretlerini etkileyecektir. Çalışmada zorunlu karşılıklar ve banka kredileri büyümesi arasındaki ilişki ortaya koymak için dört değişkenli vektör otoregresyon modeli kullanılmıştır. Her ne kadar bazı dönemlerde zorunlu karşılıkların etkili olduğu gözükse de ekonomik ısınmayı kontrol altına almaya yardımcı olacak bir uygulama olarak etkinliğine dair kesin kanıtın söz konusu olmadığı vurgulanmaktadır.
Anahtar kelimeler: zorunlu karşılıklar, banka kredileri, zorunlu karşılıkların maliyeti, parasal aktarım mekanizması, vektör otoresgresyon.
1
INTRODUCTION
Reserve requirements are used as a monetary policy instrument exclusively for banking system as well as for whole financial system. It is an effective tool for central banks mainly in emerging countries but also used in developed economies.
As a macro prudential macro-economic policy tool, regulatory authorities increasingly fell back on reserve requirement application in line with other prudential monetary policies. Following the global financial crisis dated with US investment bank Lehman Brother’s collapse, global financial markets were exposed to huge volatility and risk off mode. The biggest central banks, particularly USA Central Bank FED, EU Central Bank ECB and Japan Central Bank BoJ, started to enlarge their balance sheets with quantitative easing measures and to decrease interest rate levels towards zero, even to negative territory in the case of ECB and BoJ. In that environment, global capital owners who were looking for safe havens oriented their funds into the emerging economies (EMs) which were relatively isolated from crisis. Capital flow into emerging markets caused higher volatility in FX rates and also in banking loans since there was an abundance of liquidity. Cheaper and abundant foreign capital flows brought about a rising money supply in the market. Thus, central banks of EMs needed to take action and measures in order to maintain the health of local financial systems and to mitigate any systemic risk.
Central Bank of Republic of Turkey (CBT) started to apply unorthodox stability programs to maintain a sustainable growth locally. During the initial stages of the crisis, it tried to provide liquidity for banking system by decreasing required reserve ratios and freed blocked liquidity in central bank accounts. Later, Central Bank resorted to reserve requirement policies again but this time to control rapid capital inflows and contain excessive credit growth by changing reserve scope and increasing ratios.
2
In this study, the purpose is to investigate CBT’s reserve requirement applications’ impact, as a macro prudential policy tool, over banks’ balance sheet by exploring bank loans reactions to ratio changes within the required reserve goals framework. The scope of the study is between 2008 and 2016 which starts with global financial crisis till 2016 year end. Data was obtained from CBT, Banking Regulation and Supervision Agency (BRSA), Turkish Statistical Institute (TUIK) and Turkish Banking Association (TBA) databases. The analysis is done for both Turkish Lira (TL) and foreign currency balances separately. To analyse data, two complementary methods will be utilised. Firstly, event analysis will be applied to display reserve ratio changes impact on specific times and secondly, a vector auto regression model will be used to investigate loan balances against reserve requirement changes as well as interest rate and economic activity indicators. For the purposes of this study, reserve requirements are grouped under three categories: averages, marginal and cost-effective series with Turkish Lira and foreign currency segregation.
The first part of the study will include literature review about reserve requirement applications. As a macro prudential policy tool, reserve application conceptual framework and its institutional practice in Turkey will be reviewed in the second chapter. The following chapter aims to provide some information about Turkish banking sector structure. Bank loans will be analysed in that section too. In the fourth and last section, an empirical analysis of the relationship between reserve requirements and loan growth is applied by taking into consideration two other macro-economic variables; policy interest rate and industrial production index. The conclusion presents a combined review of previous sections and argues that from a policy perspective, next to its benefits, reserve requirements also have costs for the system that CBT needs to follow closely in order not to distort financial intermediation. Still, little is clear about its effectiveness.
3
CHAPTER I
1. RESERVE REQUIREMENTS IN LITERATURE In the literature, reserve requirement (RR) is reviewed mostly within both institutional framework and its practices. We can argue that the focus of these reviews was the negative impact of reserve requirements over the financial intermediation function of banks. Over the last 30 years, the literature on reserve requirements question has evolved in line with the developments in financial area. In studies conducted in 1970s and 1980s, discussions were mostly about reason d’etre of a required reserve application. In general, it was considered as a hidden tax which constituted the axe of discussions. In recent studies, the emphasis appears to be on the role of reserve applications as a whole and examining the impact on financial system empirically. Multivariable regression models and case study methods are used to examine RR.
In a working paper published by IMF, Simon T. Gray (2011) describes the reason of reserve requirements applications under three topics: prudential, monetary control and liquidity management.
Prudential role of reserve requirement application may be considered as holding cash like high liquid assets with central bank in order to cover unexpected cash outflows. It can be seen as a safety measure which lowers default risk for banks as depository institutions. Although, in general, prudential approach seems effective, Hein and Stewart (2002) suggested that financial markets are not always acting accordingly. In their study, they
4
examined the relationship between short term interbank interest rates and US Treasury bond rates following FED’s reserve ratio adjustments and finally demonstrated that FED’s reserve ratio adjustments played a contrary role since markets didn’t react as they are in a safer zone following FED’s adjustments.
Hazar and Yenice (2015) also considered that reserve requirement application’s prudential role is not essential. In their study, they researched reserve requirements impact on Turkish banks’ balance sheets by using regression forecast model and argued that capital adequacy regulations, deposit insurance and central bank liquidity windows weaken the prudential role for reserve requirements.
Liquidity management purpose is also one of the reasons for reserve requirements. It may be considered as a tool to sterilise the excess or missing required reserve balances impacting over inflation or foreign exchange rates. Gray (2011) indicates that it is possible to contain short term interest rate volatility in order to support financial markets by using reserve requirements in sense of liquidity management. This approach seems to be generally accepted in the literature. In a study where liquidity and reserve requirements in Brazil were reviewed, Robitaille (2011) suggests that since financial markets are not developed enough in emerging markets, liquidity management may be the main reason for reserve requirement applications.
As a monetary control mechanism, reserve requirements application is discussed under two topics: money multiplier and impact on interest margins. As general information in textbooks, money supply effect of reserve requirements is presented as equation (1). In the textbooks, this equation seems the simple way to show that the upper bund of loan balances may be designated by reserve ratios.
𝑀𝑜𝑛𝑒𝑦 𝑆𝑢𝑝𝑝𝑙𝑦 (𝑀𝑆) = ( 1
𝑅𝑅𝑅) 𝑀𝑜𝑛𝑒𝑡𝑎𝑟𝑦 𝐵𝑎𝑠𝑒(𝑀𝐵)
5
Recently, using reserve requirements to contain money supply seems a common policy in the literature and in practices especially in emerging countries. In his study where reserve requirements developments within monetary policies were treated, Carrera (2013) expressed that central banks control money supply, short term interest rates and loan growth by using reserve requirements.
In different studies, reserve requirements were also treated as a tool to control capital inflows. Hoffmann and Loeffler (2014) studied 28 emerging economies reserve requirements applications in line with capital flows triggered by low interest rates policies in developed economies. Results present that emerging countries are effectively using RR to contain speculative capital flows and maintain healthy financial markets.
In a research where Montoro and Moreno (2011) studied South America economies, it was demonstrated that reserve application adjustments help monetary authorities to stabilise capital movements and interbank markets by controlling money supply.
The former CBT governor Başçı (2010) is also explaining that CBT used reserve requirements as a main tool for financial stability while interest rates were used for price stability. Besides, Glocker and Towbin (2012) developed a DSGE model to examine reserves effects and came to the conclusion that in case of foreign currency borrowing and financial stability target, reserve requirements impact as a monetary control tool increases. However, reserve requirement application is not without cost. In the same study where authors analysed the effectiveness of reserve requirements for price and financial stability, the model results show that applying required reserve has a cost over banks’ loan prices but that differs according to banks’ place in the financial system. In other words, it depends on bank’s monopolisation scale. Similarly,
6
Robitaille (2011) discussed that if reserve ratios are applied symmetrically over whole banking system, it may have a bigger impact on smaller banks since bigger banks have more capacity to collect longer term deposits or funding sources than smaller banks.
Reinhart and Reinhart (1999) study on reserve requirements as a tool to deal with capital movements is one of the main studies on reserve requirements’ cost on margins. They conclude that reserve ratio increases cause a rising margin between deposits and loan interest rates. In that study, transitiveness of reserve requirements cost into the deposits and loan rates through two scenarios. The first one is the market where banks are decision makers over deposit rates and in competition for loans and the second one is the market where banks are decision makers for loan rates and in competition for deposits. They came to the conclusion that reserve requirements cause a decrease in deposit interest income in the first scenario and cause an extra cost on top of loan rates in the second scenario.
Similarly, based on Colombia case, where Vargas and Cardozo (2012) analysed the case when higher reserve ratios necessitate new funding, it was presented that the final impact of reserve applications over banks assets and liabilities depends on funding substitution for deposits. In Turkey, Mutlutürk (2012) analysed CBT’s reserve requirement application between 2010 and 2011 where it changed ratios significantly, and concluded that higher reserve ratios increased deposit costs for banks and thus forced banks to find alternative funding sources. But that pushed local regulators and CBT to take additional actions which complicated reserve requirement framework too.
Another work in Turkey is done by Alper, Binici, Demiralp, Kara and Özlü (2014) to reveal the interaction between reserve requirements and bank loans. They identify a new transition channel called as liquidity channel and concluded that banks react notably to reserve applications changes. “Liquidity
7
channel” which implies imperfect substitution between deposits and central bank funding analysis presents that higher required reserves reduce banks’ liquidity and credit supply (Alper et al., 2014, p4).
Tovar Mora, Garcia-Escribano, & Vera Martin (2012) examined Latin American countries in a cross-country approach to reveal reserve requirement effects and conclude that its impact is transitory while RRs play a complementary role to monetary policy.
In the literature, in general, it is well accepted that reserve requirements are not without cost and as indicated by Feinman (1993), the higher the level of reserve ratios, the higher the cost imposed on the real economy and depositors. On the other hand, it is also well accepted that higher ratios help local authorities to contain financial risks and maintain stability.
8
CHAPTER II
2. RESERVE REQUIREMENTS: CONCEPTUAL FRAMEWORK AND IMPLEMENTATION IN TURKEY AS A
MACROPRUDENTIAL MEASURE
As a general definition, reserve requirements refer to holding a certain fraction of banks’ and other depository institutions’ deposits in reserve, in very secure assets and mainly keep them with central bank Feinman (1993). Reserve requirement concept and its rationale evolved significantly since 1970s because financial systems changed and knowledge about how required reserves affect economies has increased too. Figure 2-1 demonstrates general coverage area of reserve requirements in banks’ liabilities. In current applications, it is not only about deposits but also covering other funding sources like bank borrowings and may differ based on currencies as well.
Figure 2-1: Reserve Requirements on Banks Liabilities
Source : Tovar Mora, Garcia-Escribano, & Vera Martin (2012) Reserve Requirements Deposits Local Currency FX Other Liabilities Local Currency FX
9
Reserve requirements have been always considered as a part of the monetary policies. In today’s world, most of central banks apply reserve requirements as a policy tool. Gray (2011) demonstrates in his working paper on reserve requirements utilisation all over the world that 90 countries out of 121 apply it. But it also should be indicated that its utilisation as a macro prudential policy tool is different between EMs and industrial countries (Cordella, T. F., Federico, P., Vegh, C., Vuletin, G. 2014). There are important differences like ratio levels, coverage domains, maintenance periods or interest rate remuneration for reserves. Gray (2011) discusses that the differences are originating from central banks’ distinctive targets. However, its role as a monetary policy tool diminished through developing other regulations and financial innovations such as capital adequacy ratios or deposit insurances. Over the past two decades, central banks shifted from control over reserves to control over short term interest rates and financial stability. Another reason why it seems less important, especially for developed economies, is because reserve requirements are used as a hidden tax on depositors. Although in some countries like Turkey, we observe quite high reserve requirement ratios, there is a trend toward lower reserve ratios. We may think the reason behind this trend as being in a very competitive global financial system, applying higher ratios can seriously distort financial intermediation role of banks. Because it is not without cost for banks and much of the cost is reflected to customers via lower deposit rates or higher loan rates.
On the other hand, reserve requirements are a monetary policy tool and even with different goals, it serves to control money supply. Central Banks aim to control money supply through money multiplier which was simply demonstrated in equation 1 above. In case of a tight monetary policy, increasing reserve ratios limit usable money, in other words, banks’ usable funds for loan books decline and thus central bank can control economic activities. That also helps Central Bank to affect liquidity and interest rates.
10
Besides, as mentioned above it was not without cost and the additional cost caused by reserve requirement affects the potential of bank loans negatively. Banks use liquidity which has always a funding cost and holding a fraction of their funds untouchable in reserve accounts may increase all in cost of funding. Therefore, in order to stay profitable, banks may be pushed to increase loan rates depending on their own position in the system and reserve requirements remuneration by central banks. We can also argue that prudential role may be important only for foreign currency liabilities in emerging countries where accessing liquidity is limited.
In the next sections we will investigate RR impact on banks’ available liquidity via cost and liquidity transmission mechanism.
2.1: Impact on Money Supply Through Multiplier Effect
Money multiplier subject is one of the main topics in money and banking literature. In macro-economic models, at least in simple ones, reserve requirement effects are considered through the money multiplier (Carpenter and Demiralp, 2010). The assumption behind the money multiplier is that banks’ available liquidity is determinant for the money which banks lend and central banks control money base unilaterally. In general, we argue that money multiplier designates money supply and reserve requirements generate a direct and tight linkage between liquidity and available cash (Carpenter and Demiralp, 2010). In theory, the place of reserve requirements in money supply process is described as shown in equation 1 above. Thereby, money supply is determined by money base affected with a money multiplier. In the equation (1), RRR1 stands as money multiplier and based on this, money multiplier (m) equation is shown in the literature as below equation (2) (Mishkin, 2011)
𝑚 = 𝑀𝑆
𝑀𝐵
11
However, since this equation does not include excess reserve and households’ cash demand, to have more realistic one it is necessary to include these two items as well. Following Talaslı (2012)’s study, we can develop equation (2) as below:
𝑀𝐵 = 𝐶 + 𝑅𝑅𝑇 (3)
In the equation; C demonstrates cash need of households and RRT demonstrates
total reserve requirements including minimum and excess balances. We may show it in an equation as below:
𝑅𝑅𝑇 = 𝑅𝑅𝑚𝑖𝑛+ 𝐸𝑅 (4)
𝑅𝑅𝑚𝑖𝑛 identifies the minimum reserve balances and ER denotes excess reserve
balances held by banks.
In literature, RRmin, ER, and C are considered as a function of deposit amount
and can be demonstrated as in equation (5) where D stands for deposits and RRR stands for RR ratio.
𝑅𝑅𝑇 = (𝑅𝑅𝑅 𝑥 𝐷) + (𝐸𝑅 𝑥 𝐷) (5)
If we reform equation (3) accordingly we can formulate money base as: 𝑀𝐵 = (𝐶 𝑥 𝐷) + (𝑅𝑅𝑅 𝑥 𝐷) + (𝐸𝑅 𝑥 𝐷)
= 𝐷𝑥(𝐶 + 𝑅𝑅 + 𝐸𝑅)
(6)
Money supply, on the other hand, is considered as sum of cash need and deposits and shown as in equation (7).
𝑀𝑆 = 𝐶 + 𝐷 = (𝐶 ∗ 𝐷) + 𝐷 = 𝐷 ∗ (𝐶 + 1) (7)
12 𝑚 = 𝑀𝑆 𝑀𝐵 = 𝐷𝑥(𝐶 + 1) 𝐷𝑥(𝐶 + 𝑅𝑅 + 𝐸𝑅)= 𝐶 + 1 𝐶 + 𝑅𝑅 + 𝐸𝑅 (8)
Consequently, the determination of monetary supply level depends on the central banks’ behaviours as well as households and on banks. When we reformulate the deposit multiplier by taking into account banks and people behaviours, we have the monetary multiplier which presents the level of change of one unit base money increase. As is shown in the money multiplier equation 8, banks reserve need and people’s cash needs affect the monetary multiplier in the negative direction.
It is also possible to present the impact of reserve requirements on money multiplier via a simple banking sector balance sheet. The sector balance sheet includes central bank and commercial banks’ balance sheets in a consolidated way (Talaslı, 2012, p.4).
Table 2-1: Banking system consolidated balance sheet
Source: Talaslı, CBT, 2012
Net Foreign Assets Currency Issued
Credit to Banking Sector Free Deposits
Open Market Transactions =
Late Liquidity Window Monetary Base
Othe Items Public Sector Deposits
Cash Current Account Deposits
Time Deposits
Free Deposits to Central Bank Loans from Central Bank
Open Market Transactions
Loans Late Liquidity Window
Net Foreign Assets Cash Emission
Current Account Deposits
Net Other Items Time Deposits
=
Loans Money Supply
Central Bank Balance Sheet
Banking Sector Balance Sheet
13
In Table 2-1, reserve requirements balances are identified as Free Deposits in central bank balance sheet liability side. Central bank follows banks required reserves under this account. Following the equation (3), currency issued (emission which can be identified as cash need) and reserve requirements form money base in the liability side of central bank balance sheet.
Money supply, on the other hand, can be stated on the liability side of consolidated balance sheet. Cash and Emission plus Current and Time Deposits compose money supply. Due to balance sheet equation principle, any change in assets affects directly money supply. Central Banks affect money supply by changing their balance sheet sizes with open market operations (Talaslı, 2012). Any reserve requirement ratio increase brings about a declining money multiplier effect via increasing money base and vice versa.
Therefore, in an environment where money supply is limited, if money base is rising by increasing reserve requirements, commercial banks’ loan growth may be restricted. Because, banks will be pushed to hold higher reserve balances with central bank.
2.2: Impact on Loan Supply Through Cost Channel
Another effect of reserve requirements on bank balance sheet is due to its cost. Banks collect fund from depositors or borrow directly from market and pays interest for those funding. While they hold a fraction of their funds with central bank as required reserve, if they are not remunerated or remunerated with a lower rate than their original costs then the margin between deposit and loans will be affected (Talaslı, 2012). Here, central bank policy interest rates are also important because banks can borrow from central bank against collateral at that rate and therefore can cover their reserve need from central bank. If central bank pays its policy interest rate to reserve balances, we can argue that RR cost
14
may be eliminated or decreased significantly. However, as is the case in Turkey currently, if banks’ cost rate is higher than central bank remuneration rate then reserve requirements application creates an extra funding cost for banks.
In the literature Monti-Klein banking model is used to explain banking system functions and we will use it also to display reserve requirements cost impact on banks’ balance sheet. It is a widely used model and suggested by Klein and Monti in 1971 and 1972 (Dvořák, 2005). The assumption behind this model is that banks are seeking profit maximization and the system where they are operating in has a monopolistic structure. Powerful authorities control enters and exit, and they are obstacle in front of constitution of full competition.1 Due to its simplicity, this model is very useful to examine banking sector but also its loan-deposit interaction assumption is debated. It is worth to state that whether loans and deposits are interdependent or dependent question depends on country and/or bank specific conditions.
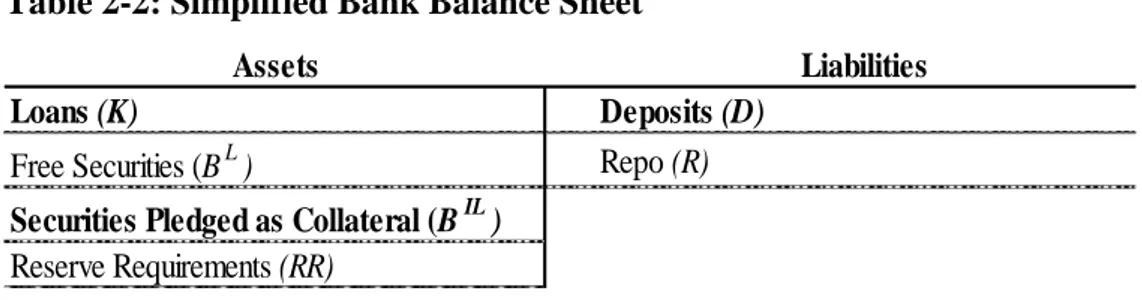
We can follow Alper et al. (2014) study to show reserve requirements effect on loans with in Monti-Klein model. In compliance with the model, we will analysis reserve requirements changes impacts based on a simplified bank balance sheet described in table 2-2. According to the model, a bank can have three type assets; loans, fixed income portfolio and reserve requirements held at free account with central bank. These assets are funded by deposits and repo with central bank against bonds given as collateral. As mentioned before, required reserve balances are a proportion of deposits (𝑅𝑅 𝑥 𝐷).
1 For details see Dvořák, Pavel. Rethinking the Monti-Klein model of banking industry: new
insights about the separability of loans and deposits decisions'. (Charles University Discussion Paper No. 2005. Vol. 138). Praha: Czech Republic
15
Table 2-2: Simplified Bank Balance Sheet
Source: Alper et al. (2014)
Loans, deposits, collateralised funding, loan interest rates (𝑖𝐾) and deposit rates
(𝑖𝐷) are model’s endogenous elements. Reserve requirements ratio (𝑅𝑅𝑅) and
central bank policy interest rate (𝑖𝐶𝐵) are exogenous elements.
Total fixed income portfolio is displayed as B which consists of free securities and pledged as collateral:
𝐵 = 𝐵𝐿+ 𝐵𝐼𝐿 (9)
We can show above table as below equation:
𝐾 + 𝐵 + 𝑅𝑅𝑅 ∗ 𝐷 = 𝐷 + 𝑅 (10)
The assumption behind the model is that there is a monopolistic market both for loans and deposits and also both loan and deposit balances are function of interest rates (Dvořák, 2005).
𝐾 = 𝐾(𝑖𝐾) (11)
𝐷 = 𝐷(𝑖𝐷) (12)
Thus, under balance sheet balance principle, according to model, a profit function can be displayed as below without a bank have liquidity shortfall.
𝛱 = 𝐾(𝑖𝐾) + 𝐵(𝑖𝐵) + 𝐷(𝑅𝑅𝑅)(𝑖𝐶𝐵) − 𝐷(𝑖𝐷) − 𝑅(𝑖𝐶𝐵) (13)
𝑖𝐵 stands for return on bonds.
Assets Liabilities
Loans (K) Deposits (D)
Free Securities (BL) Repo (R)
Securities Pledged as Collateral (BIL) Reserve Requirements (RR)
16
As financial intermediary institutions, banks seek to maximise their profit by determining their loan and deposit rates. Banks funding sources, in the model, are deposit and central bank funds. As Vargas and Cardozo (2012) expressed, the substitution level of these two sources for a bank is crucial regarding reserve requirements cost impact. Under normal circumstances, average loan tenor is longer than average deposit tenors. Central bank funds have shorter tenor than average deposits, mainly overnight or weekly funds. In balance sheet management area, due to tenor differentiations, funding from central bank is considered as an option for short term and day to day liquidity management rather than a replacement for deposits. Because, dependency on shorter term funding source like central bank sources increases interest rate risk (Vargas and Cardozo, 2012). Thus, Alper et al. (2014) argued, since central bank funding can’t be a sustainable alternative for deposits, any increase in reserve requirements necessitates additional funding which also affects deposits and loans interest rates. In the profit function in equation 13, a reserve increase may be compensated by increasing deposits or shifting from loan to required reserve balances due to its cost.
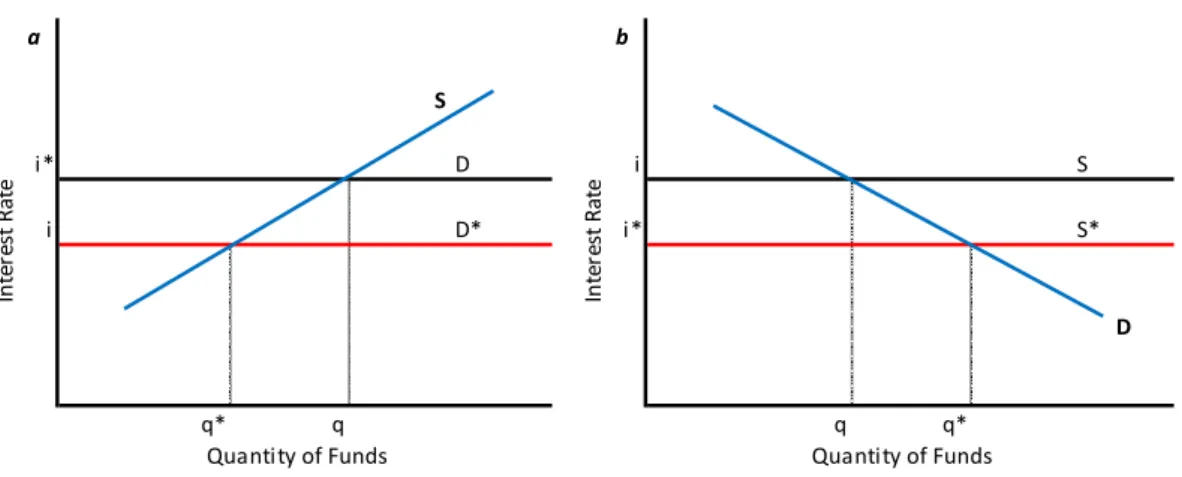
Figure 2-2: Impact of reserve requirements on deposit and loan rates
Source: Hein and Stewart (2002)
a b S i* D i S i D* i* S* D q* q q q* In te re st R at e In te re st R at e
17
In the above Figure 2-2a, under the assumption that deposit rates are determined by the market and reserve requirement costs are reflected to the depositors, it was illustrated that the decrease on deposit returns from 𝑖∗ to 𝑖 would result in
a decrease on the deposit offers from 𝑞 to 𝑞∗ then deposit amount shifts down
from 𝐷 to 𝐷∗. On the other hand, while there is consensus in the literature that
reserve cost is a tax, there is no clear evidence of the inverse relationship between reserve ratio changes and deposit returns.
In the case of Figure 2-2b, due to decreasing deposit offers depending on lower interest income, loan supply will also decline from 𝑞∗to 𝑞 and the cost will rise
from 𝑖∗ to 𝑖 for borrowers. While in the first chart the cost was reflected to depositors, in Figure 2-2b, the cost is reflected to the borrowers because the quantity of usable funds is absorbed by the central bank via reserve requirement applications. In both a and b cases, reserve requirements costs will have a direct or indirect effect (via useable deposit amount) on loan balances for a bank.
Since deposits are the main funding sources for loans, in this case, there would not be enough fund to cover current loan balances and/or new loan requests, any reserve requirement increase will have a restrictive impact on loan balances.
The main two traditional funding sources are deposits and central bank credit for banks. Since central bank sources are shorter term options compared to deposits, the substitution degree between them is determinant for the monetary transmission of reserve requirement. If they don’t substitute themselves with a high ratio then if reserve requirement ratio increases it won’t be replaced with borrowing from central bank and may cause cost increase for deposit accounts. As it was indicated by Alper et al. (2014) in their study, both bank loans and deposit market will be affected together.
18
It was explained above, the substitution level between deposit and central bank sources is crucial to calculate reserve requirement effect on bank loans. Alper et al. (2014) call reserve requirement ratio increase’s impact on credit growth as “liquidity channel”. If the required extra liquidity is put up from central bank sources, since it will be a collateralised funding, bank is left with less liquidity buffers to use against unexpected liquidity shocks. Thus, the cost of central bank funding will be increased due to liquidity risk which causes an increase in bank’s lending rate or it will prefer to slow its credit growth.2
The funding composition is a crucial management area for banks due to liquidity constraints. Each bank needs to have a strong liquidity position which must be in line with the regulations such as net stable funding ratio and liquidity coverage ratio. As Alper et al. (2014) indicated in their study, switching from deposit to central bank to cover reserve requirement need may deteriorate bank’s liquidity position. In practice, increasing deposit balance takes longer time than addressing to central bank liquidity facilities. Therefore, in case of a tightening in reserve requirements, banks prefer central bank to fulfil their need immediately.
As a consequence, the cost channel effect of RR may be summarised as that if central bank increases reserve requirement ratio, even we assume that short term money market interest rates remain unchanged during that time, it may have a restrictive impact on loan balances as that will limit disbursable money and may change banks’ balance sheets. Thus, apart from interest rates, quantitative policies affect loan balances as well.
19
2.3: Implementation of Reserve Requirements in Turkey
Reserve requirement regulations in Turkey are set by the Central Bank of the Republic of Turkey (CBT). Although there has been a required reserve management in Turkey for a long time, the current application is regulated by the communique dated 2005 and number 1 which was published based on the article 40 of the CBT law. Turkish banks are required to hold a predetermined amount of cash averaged over 14 days maintenance period beginning on Friday and ending on Thursday. The liabilities subject to reserve requirements are calculated on Friday every two weeks and comprised of the balance sheet items presented in the table 2-3 by taking into account the accounting standards and record – keeping of banks and financing companies, including the liabilities of foreign branches and excluding obligations to Central Bank, the Treasury, domestic banks and headquarters and branches of banks established by the international agreements in Turkey.3
Before the global crisis in 2008-2009, CBT used reserve management system mainly for the prudential reasons. The main goal was to defend banking system against default risk (Talaslı, 2012). The short term interest rates were the main instrument in a conventional monetary management framework. After the global credit crunch and following the developed countries central banks’ quantitative easing policies, CBT put in place several changes in reserve requirement applications. Especially after 2010, CBT used it more actively in various dimensions (Alper et al 2014).
3 http://www.tcmb.gov.tr/wps/wcm/connect/TCMB+EN/TCMB+EN/Main+Menu/MONETARY
20
Table 2-3: Balance Sheet Items Subject To Reserve Requirement
a Deposits / Participation funds
b Funds from repo transactions
c Loans obtained (except the loans guaranteed by the Treasury)
d Securities issued (net)
e Subordinated debt that is not taken into account in the calculation
of own funds
f Liabilities to the head office abroad (net)
g Debt to contracted merchants due to credit card transactions
h Borrower funds of investment banks
Sources: Central Bank of Turkey
While global financial markets and especially banking sectors were being shaken by the credit crunch and later on by debt crisis in Europe, liquidity was the main issue for the system; not only the quantity of the liquidity but also its flow between markets were pushing central banks to take unorthodox action and apply special measures for their local markets. The CBT adopted a new policy strategy to contain macro-financial risks and to address the challenges posed by volatile capital flows. To this end, “the price stability was modified by incorporating financial stability as a supplementary objective” (Kara, 2016, p.85). CBT announces its RR framework on its own website as following: “In line with the new strategy that took effect in the last quarter of 2010, the CBT developed a new policy framework towards reducing macro financial risks within the limits of favorable inflation outlook. Accordingly, in addition to the traditional policy instrument of the one-week repo auctions rate, reserve requirements were introduced as an active tool.”4 In order to help the Turkish
banking sector in terms of liquidity and cost of liquidity, next to interest rate policy, CBT used reserve requirement system effectively.
4
http://www.tcmb.gov.tr/wps/wcm/connect/TCMB+EN/TCMB+EN/Main+Menu/MONETARY+P OLICY/Reserve+Requirement+Ratios/ accessed 08 April 2017.
21
In December 2008, CBT announced that it decreased reserve requirement ratios for foreign currency denominated liabilities by 200 basis points (bps) in order to loosen the credit crunch crisis impact on the local economy and to pump liquidity to the banking sector. Thus, CBT provided the banking system with foreign currency liquidity amounting to USD 2.5 billion.5 Almost one and half
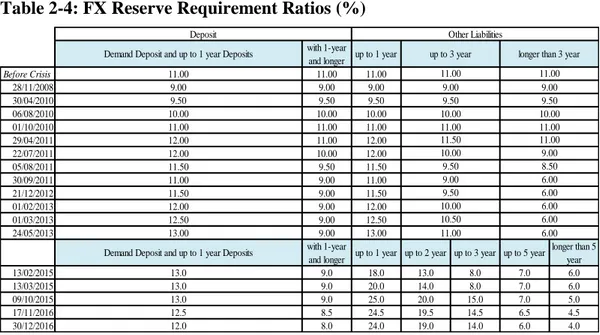
year later, CBT disclosed its monetary policy normalisation strategy and indicated that in line with the improving normalisation in global markets, it would withdraw gradually foreign currency liquidity assured via easing reserve requirement and decided to increase ratios for foreign currency liabilities in April 2010. Thus, foreign currency reserve ratios increased again to the level before global financial crisis as illustrated in Table 2-4.
Meanwhile, in order to reduce intermediation costs and support effective functioning of the credit market, the Central Bank reduced the Turkish Lira required reserve ratio, from 6% to 5% on 16 October 2009, thus provided the
banking system with TL 3.3 billion worth of permanent liquidity.6 Same with
foreign currency reserve ratios, CBT started to normalize Turkish Lira reserve ratios by increasing it gradually in 2010 during exit strategy from the exceptional monetary policy applied since the crisis. The bank decision was also based on the argument that banking sector was recording an excessively strong credit growth.
5 Central Bank of Turkey Monetary and Exchange Rate Policy For 2010, published on its website,
http://www.tcmb.gov.tr/wps/wcm/connect/tcmb+en/tcmb+en/main+menu/publications/basic+polic y+readings/monetary+and+exchange+rate+policy+texts accessed on 09 April 2017.
6 CBT 2009 Financial Stability Report Vol.9, Published on its website,
http://www.tcmb.gov.tr/wps/wcm/connect/TCMB+TR/TCMB+TR/Main+Menu/Yayinlar/Raporlar /Finansal+Istikrar+Raporu/2009/Sayi+9/ accessed on 08 April 2017.
22
Table 2-4: FX Reserve Requirement Ratios (%)
Source: Central Bank of Turkey
Additionally, with a view to preventing fluctuations in overnight interest rates and enhancing the flexibility of the banks’ liquidity management, the Central Bank announced that it would introduce flexibility in the provision of the TL required reserve liabilities. Accordingly, banks will be allowed to carry over 10% of the required reserves for any period to the following period or carry over the excess amounts, which cannot exceed 10% of the required reserves for any period to the following period.
CBT used reserve requirement system very actively as a policy instrument to counterbalance macro economical risks as well as financial risks starting from 2010. In December 2010, it kicked off the new reserve requirement framework by applying tenor differentiation on Turkish Lira deposits subject to reserve. In the new framework, reserve ratios are settled according to tenors, longer ratios for short term deposits and longer terms have lower ratios as shown in Table 2-5. This was done for the first time in Turkey. Later on, in April 2011, it was decided to apply tenor fraction on foreign currency liabilities too as shown in Table 2-4.
with 1-year and longer up to 1 year
Before Crisis 11.00 11.00 28/11/2008 9.00 9.00 30/04/2010 9.50 9.50 06/08/2010 10.00 10.00 01/10/2010 11.00 11.00 29/04/2011 11.00 12.00 22/07/2011 10.00 12.00 05/08/2011 9.50 11.50 30/09/2011 9.00 11.00 21/12/2012 9.00 11.50 01/02/2013 9.00 12.00 01/03/2013 9.00 12.50 24/05/2013 9.00 13.00 with 1-year
and longer up to 1 year up to 2 year up to 3 year up to 5 year
longer than 5 year 13/02/2015 9.0 18.0 13.0 8.0 7.0 6.0 13/03/2015 9.0 20.0 14.0 8.0 7.0 6.0 09/10/2015 9.0 25.0 20.0 15.0 7.0 5.0 17/11/2016 8.5 24.5 19.5 14.5 6.5 4.5 30/12/2016 8.0 24.0 19.0 14.0 6.0 4.0 9.50 10.00
Demand Deposit and up to 1 year Deposits
12.5 12.0 11.00 6.00 9.00 9.50 10.00 11.00 9.50 10.00 12.00 12.50 13.00 13.0 13.0 13.0 12.00 12.00 11.50 11.00 11.50 9.50 6.00 10.00 6.00 10.50 6.00 10.00 9.00 9.50 8.50 9.00 6.00 11.00 11.00 11.50 11.00 9.00 9.00
Deposit Other Liabilities
up to 3 year longer than 3 year Demand Deposit and up to 1 year Deposits
23
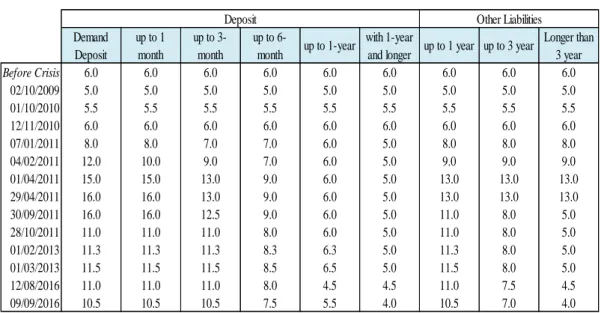
Table 2-5: TL Reserve Requirement Ratios (%)
Source: Central Bank of Turkey
Since therefore, CBT applied tenor fraction both for local currency and foreign currency liabilities subject to reserve requirement. The main reason of this new framework is to support local banking sector to extend deposit tenor since there is a serious mismatch between liability and asset tenors in banks’ balance sheets. It was tried to loosen reserve cost on longer term deposits and make it more attractive for depositors. Turkish banks have longer assets tenors than liabilities and that structure expose banks to significant interest rate and liquidity risks. This puts local financial markets in a fragile environment.
Another main change CBT made on reserve requirement application is to remove interest payment for reserve balances. In order to support banks’ intermediation role to manage more effectively and more productively, CBT started to pay interest for Turkish Lira reserve balances starting from 2001, and for foreign currency denominated reserve balances starting from 2002. But to support de-dollarisation process and to encourage local currency deposit and loans, in December 2008, CBT removed it for foreign currency reserves. In September 2010, this time to counterbalance financial risk and bank loans rapid growth, CBT removed interest
Demand Deposit up to 1 month up to 3-month up to 6-month up to 1-year with 1-year
and longer up to 1 year up to 3 year
Longer than 3 year Before Crisis 6.0 6.0 6.0 6.0 6.0 6.0 6.0 6.0 6.0 02/10/2009 5.0 5.0 5.0 5.0 5.0 5.0 5.0 5.0 5.0 01/10/2010 5.5 5.5 5.5 5.5 5.5 5.5 5.5 5.5 5.5 12/11/2010 6.0 6.0 6.0 6.0 6.0 6.0 6.0 6.0 6.0 07/01/2011 8.0 8.0 7.0 7.0 6.0 5.0 8.0 8.0 8.0 04/02/2011 12.0 10.0 9.0 7.0 6.0 5.0 9.0 9.0 9.0 01/04/2011 15.0 15.0 13.0 9.0 6.0 5.0 13.0 13.0 13.0 29/04/2011 16.0 16.0 13.0 9.0 6.0 5.0 13.0 13.0 13.0 30/09/2011 16.0 16.0 12.5 9.0 6.0 5.0 11.0 8.0 5.0 28/10/2011 11.0 11.0 11.0 8.0 6.0 5.0 11.0 8.0 5.0 01/02/2013 11.3 11.3 11.3 8.3 6.3 5.0 11.3 8.0 5.0 01/03/2013 11.5 11.5 11.5 8.5 6.5 5.0 11.5 8.0 5.0 12/08/2016 11.0 11.0 11.0 8.0 4.5 4.5 11.0 7.5 4.5 09/09/2016 10.5 10.5 10.5 7.5 5.5 4.0 10.5 7.0 4.0
24
payment for Turkish Lira reserves. We can argue that that action was in line with banks’ profit maximization function which was showed in equation 13 above.
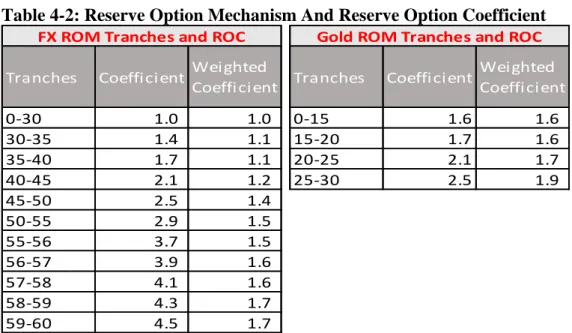
In addition to these amendments, by the new monetary policy framework, CBT implemented new interest rate policy and reserve option mechanism. The idea behind Reserve Options Mechanism was to absorb the massive inflows triggered by the quantitative easing policies of advanced economies and accumulate foreign exchange reserves without excessive sterilisation costs. This new mechanism introduced at the end of 2011 allows banks to voluntarily hold a certain portion of their TL reserve requirements in foreign exchange and/or gold (Alper, Kara and Yörükoğlu, 2013). The amount of foreign exchange or gold that can be held per unit of TL is called the reserve option coefficient (ROC). For example, if the ROC is 2, banks must hold 2 TL worth of foreign currency or gold per 1 TL reserve requirement if they wish to utilize the ROM facility. The CBT adjusted the ROC to change the relative cost of using the reserve option mechanism. All these measures led to substantial variations in the reserve holdings of the banking system, both across banks and through time.7 All these measures led to material fluctuations in reserve balances of the system, both across banks and through the period, which is not general practice in central banking (Alper et al, 2012). As Kara indicated, “these unconventional tools aim to ease the policy trade-offs associated with the volatility in capital flows by dampening the amplifying role of capital flows” (Kara, 2016, p.87).
CBT’s initial intention was to soften the capital inflow volatility; later on it tried to contain capital inflow effecting local economical balances. CBT used reserve requirement and a wide interest rate corridor as cyclical tools to control credit growth and capital flow volatility.
7 See Alper, Kara, and Yörükoğlu (2013) for a detailed exposition of the reserve option
25
Capital flow towards high yield countries due to the liquidity abundance in low interest rates developed countries brought about some unsustainable financial positions in Turkey like rising import goods and current account deficit. While Turkey current account deficit ratio to gross domestic product (GDP) was around 3% before the second half of the 2010, it recorded a quick increase and ended the year just below 6%. The following year the trend continued and 2011 recorded 9% deficit to GDP. The Central Bank of Turkey which is following and announcing the current account balance periodically took action to curb banks’ credit growth which was helping private consumption to increase. Total banking sector loans increased around by 43% in 2010 according to CBT monthly domestic loans data in TL.8 These developments were accompanied by an overheating economy and a sharp widening in the current account deficit. Perhaps more importantly, the quality of external finance deteriorated sharply. By the end of 2010, almost all the current account deficit was financed by short-term or portfolio flows, leaving the economy susceptible to sudden reversals in global sentiment (Kara, 2016).
CBT didn’t make interest payment for the banks’ foreign currency and TL balances held with it until end of 2015 and 2014 respectively. The CBT started to remunerate required reserves of banks and financing companies maintained in Turkish Lira as of November 2014 and gradually raised remuneration rates in 2015 to spur balanced growth and domestic savings. As also stated in the Monetary and Exchange Rate Policy in 2015, the CBT’s regulation to remunerate Turkish lira required reserves in a way to encourage core liabilities was put into effect in January 2015. Accordingly, financial institutions whose ratio of deposits and equity to loans are higher than the sector average are remunerated at a higher rate unless they worsen their own situation.
On May 2015, CBT announced that given the changing global and local financial market conditions, USD required reserves, reserve options and free reserves held at
8 Central Bank of Turkey announces banking sector total loans balance on monthly basis on its
26
the CBT were started to be remunerated. The remuneration rate is held close to the upper end of the FED funds target rate range. Due to ECB negative interest rate policy, Euro denominated required reserve balances held with CBT became subject to a commission rate between May 2015 and August 2015 as presented in the below Chart 2-1. Moreover, through the arrangements introduced on 30 May 2015, the coverage of liabilities subject to reserve requirements of foreign branches of banks incorporated in Turkey has been broadened. Thus, foreign branches of banks have also been encouraged to borrow longer term.
Chart 2-1: Interest rates paid to FX required and free accounts and commission rates charged on accounts.
Source: Central Bank of Turkey
Overall, we can argue that CBT mainly used the reserve requirements for countercyclical purposes in the past few years both for the Lira and foreign currencies. CBT used reserve requirements in three ways essentially: (i) changing ratios and coverage, (ii) changing remuneration rate paid for reserve held by banks, (iii) implementation of reserve option mechanism. Due to liability maturity differentiation from bank to bank and to implementation of this new mechanism, reserve requirement application became a variable specific to each bank. Given the
-0.50 0.00 0.50 1.00 1.50 2.00 2.50 Jan -0 8 Ap r-0 8 Ju l-0 8 Oct-0 8 Jan -0 9 Ap r-0 9 Ju l-0 9 Oct-0 9 Jan -1 0 Ap r-1 0 Ju l-1 0 Oct-1 0 Jan -1 1 Ap r-1 1 Ju l-1 1 Oct-1 1 Jan -1 2 Ap r-1 2 Ju l-1 2 Oct-1 2 Jan -1 3 Ap r-1 3 Ju l-1 3 Oct-1 3 Jan -1 4 Ap r-1 4 Ju l-1 4 Oct-1 4 Jan -1 5 Ap r-1 5 Ju l-1 5 Oct-1 5 Jan -1 6 Ap r-1 6 Ju l-1 6 Oct-1 6
Remuneration Rate for USD Balances (%)
27
dominant role of banks in Turkey in sense of financial intermediation, from a macro point of view, CBT seems as the stabiliser authority and it uses RR with both its cost and liquidity channels.
28
CHAPTER III
3. TURKISH BANKING SECTOR STRUCTURE AND BANKING LOANS
The banking sector dominates financial intermediation in Turkey. The system had a very crucial crisis in 2001 and afterwards it had a rapid credit growth lasting fifteen years on the back of improved economic fundamentals and easy global liquidity conditions. Since Turkey is still classified as an emerging country, given the challenges facing the industry and the broader economy, Turkish banking sector is operating in a considerably more challenging environment and thus its structure has some fragile aspects which face the sector and its players with sustainability problem. In line with macro economy, the banking sector evolved significantly since the local banking crisis. In this section, we will provide a broad review of banking system together with the bank loans development between 2008 and 2016.
We can review Turkish banks in two periods chronologically following the crisis in 2001 which reshaped the whole system: between 2002 and 2012 and after 2012. Turkey underwent a drastic transformation during 2002–12. The inflation has been brought down to single-digit levels, GDP per capita has increased and fiscal balance has significantly been improved. Accommodative global backdrop also supported Turkey’s transformation process. According to Ernst and Young Global Banking and Financial Policy Review 2016, annual FDI inflows averaged around $10b during the decade, while Turkish banks became popular acquisition targets.9
9 Ernst and Young Global 2(016), Turkish Banking Sector Overview - Global Banking &
Financial Policy Review. on http://www.ey.com/tr/en/industries/financial-services/turksh-banking-sector-overview-article-page, accessed May 9th, 2017.
29
Back in 2002, Turkish banks were operating in a financial environment where crowding out effect of Turkish government bonds dominated financial decisions. Banks were significantly involved in investing their funds into high yielding government bonds because the real return was quite high around 15%. This environment left no real appetite for a proper banking sector. Of the overall assets, according to BRSA data, more than 40% were invested into government bonds and the share of the loans was just 23% at 2002 year end.10 As it is shown in the Chart
3-1, while loans share in total assets increased since 2002, investment in government bonds stayed almost flat on monthly basis.
Starting in 2003, Turkish banking sector was rebuilt under the close supervision of the BRSA. It was a period when Turkish banks were enjoying return on equity of above 20% and nominal loan growth of above 35% every year11 by 2006, the
Turkish banking sector had become an attractive investment opportunity for global players. Many local banks’ ownerships changed and global players had an important share in the sector.
10 BRSA Turkish Banking Sector Interactive Monthly Bulletin published on
http://ebulten.bddk.org.tr/finturk , accessed on 10/June/2017.
30
Chart 3-1 : Banking Sector Investment Shares Between 2002 and 2005.
Source: Author Calculations Based On BRSA Monthly Statistical Bulletin
Chart 3-2: Turkish Banking Sector Return on Equity vs Cost of Capital
Source: BRSA Reports (RoE Calculation), Bloomberg (5Y CDS and Turkey 2Y Benchmark) 10% 15% 20% 25% 30% 35% 40% 45% Dec. 2005 Sep. 2005 Jun. 2005 Mar. 2005 Dec. 2004 Sep. 2004 Jun. 2004 Mar. 2004 Dec. 2003 Sep. 2003 Jun. 2003 Mar. 2003 Dec. 2002 Loans to Assets Gbonds to Assets
5 10 15 20 25 30 50 100 150 200 250 300 350 400 450 2006 2007 2008 2009 2010 2011 2012 2013 2014 2015 2016
31
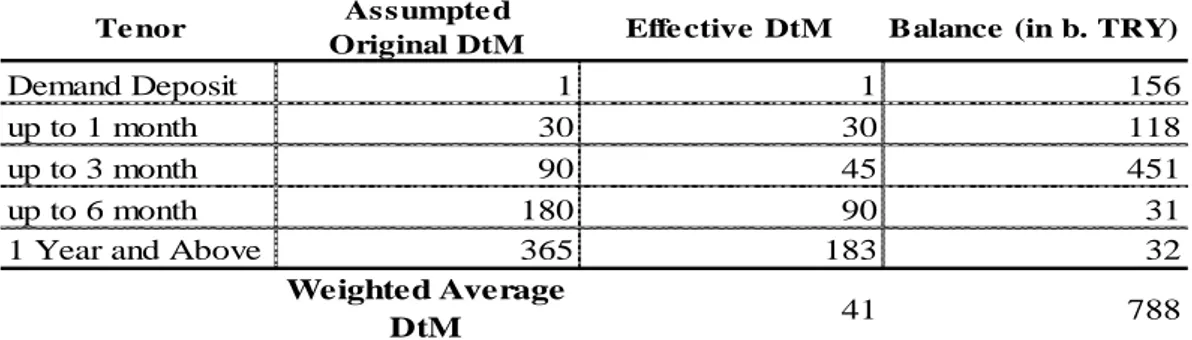
The sector balance sheet’s main feature was strong credit growth and mismatch between assets and liabilities regarding tenors. Since the main funding source was deposits, due to macro-economic environment, maturity gap, which is calculated as the difference between liabilities maturity and assets maturity, is negative. Having a negative maturity gap, in that sense, means that labilities have more repricing cycle than assets. In Turkey, while average deposit tenor is around 41 days12,
average tenor for loans is above 1 year. That position puts banks in a repricing risk which is indirectly pushes loan prices higher. Since there is not enough deposit basis, any increase in reserve requirement has also a negative impact on credit balance growth because of liquidity short fall and higher prices.
During that time, liabilities’ structure followed different ways. Turkish banks benefited from quantitative easing policies of big central banks and thus external borrowings increased significantly. When we arrived at 2012, loans to deposits ratio in the sector exceeded the 100% as illustrated in chart 3-3.
Chart 3-3: Turkish Banking Sector Loan, Deposit and Loan to Deposit Ratio
Source: BRSA Turkish Banking Sector Interactive Monthly Bulletins 12 See Annex 4.s 0% 20% 40% 60% 80% 100% 120% 140% 0 200,000 400,000 600,000 800,000 1,000,000 1,200,000 1,400,000 1,600,000 1,800,000 2002 YE 2003 YE 2004 YE 2005 YE 2006 YE 2007 YE 2008 YE 2009 YE 2010 YE 2011 YE 2012 YE 2013 YE 2014 YE 2015 YE 2016 YE million TL Loans (m TL) Deposits (m TL) L/D (rhs)
32
Increasing loans to deposits ratio is crucial for reserve requirement position as well since it is all about the liquidity and its cost. Rising loans and lower saving levels trigger a hard competition for deposits. As was shown in above Figure 2-2, as long as interest margin on loans are enough to be profitable, banks can compete to get more deposits but in case of sticky loan prices this situation will end up with less profit or slow down credit growth.
Meanwhile, strong growth story in abundant global liquidity environment had some side effects. While the growth number realized as 9%13 year on year in 2010 and in
2011, due to consumption driven economy and lack of saving, according to CBT data, current account deficit to gross domestic production ratio reached 8,93% at the last quarter of 2011.14 According to CBT’s own calculations, at that time, each
5% loan growth brings about 2.1% on top of current account deficits (Yılmaz,
Durmuş. 2010, p.5).
Since banks have the dominance in local financial markets, prudential measures are generally applied to the banking system (Kara, 2016). Banking sector loans, especially retail loans and credit card business, were put on regulators’ target to counterbalance macro-economic outlook. In the presence of overheating economy, CBT took action at the end of 2010 and announced that except interbank repo transaction and repo with central bank, all other repo transactions were included to reserve requirement coverage. Thus, in order to slow bank loans, CBT decided to cut available liquidity in the sector. According to CBT communique dated on 17/12/2010 (Number 2010-68), that step decreased market liquidity by TRY 7.6 billion and USD 200 million.
13 Turk stat changed the calculation methodology for GDP figures in accordance with the guidelines
of the National Accounts System (SNA-2008) and the European Accounting System (ESA-2010). Therefore, growth figures which had previously been expressed at constant prices now started to be calculated according to the chain-linked volume index (2009=100). Growth by 9% in 2011 is with the new chain linked data.
14 http://www.tcmb.gov.tr/wps/wcm/connect/TCMB+EN/TCMB+EN/Main+Menu/MONETARY
33
The Chart 3-4 presents loan balances’ development as monthly averages and year on year changes starting from 2009. Due to high capital inflow, banking credit balances had growth number up to 45% in 2010 and 2011. But afterwards, CBT’s measures to control the sector via liquidity and cost channels brought about lower credit growth trend.
We can argue that regulators, including CBT and BRSA, used reserve requirement application very actively to control and orient the financial intermediation to counterbalance the macro economic outlook. The CBT has introduced the interest rate corridor, the reserve requirement and the reserve option mechanism so as to loosen credit growth and credit volatility (Başçı and Kara 2011). Although banks adapted to these changes, each reserve application change had an echo on banks’ balance sheets in the form of return and liquidity constraints.
Chart 3-4: Banking Sector Loan Balances (Non-Financial Sector Loans / Monthly In TL)
Source: CBT, Author Calculation.
As illustrated in chart 3-5, deposits are the core liability for the sector which refers a sustainable source for assets. Other sources for assets’ funding are, payables to
0% 5% 10% 15% 20% 25% 30% 35% 40% 45% 50% 200.00 400.00 600.00 800.00 1,000.00 1,200.00 Jan -2008 May-2008 Se p -2008 Jan -2009 May-2009 Se p -2009 Jan -2010 May-2010 Se p -2010 Jan -2011 May-2011 Se p -2011 Jan -2012 May-2012 Se p -2012 Jan -2013 May-2013 Se p -2013 Jan -2014 May-2014 Se p -2014 Jan -2015 May-2015 Se p -2015 Jan -2016 May-2016 Se p -2016 Bil lion s
34
banks, funds from repo transactions, securities issued, payables to the central bank and payables to the money market.
The chart 3.5 shows also that increase in deposits is not as much as in balance sheet growth. Due to lower deposit increases, banking sector has been pushed to have a diversified funding structure which put itself in a more volatile and costly environment. As it is shown in the above chart 3-3, Turkish banking sector loan to deposit ratio has a significantly increasing trend just after the global crisis impact in 2008. That picture presents that the main source of the credit growth in Turkey depended on non-core liabilities such as security issues or interbank borrowings. In the context of RR, banking sector feels RR’s power in sense of liquidity constraint also its cost and react accordingly.
Chart 3-5: Deposits Share In Total Liabilities Between 2008 And 2016.
Source: Author’s Calculation based on BRSA monthly Data. 45% 48% 51% 54% 57% 60% 63% 66% Jan -0 8 Ju n -0 8 No v -0 8 Ap r-0 9 Sep -0 9 Feb -1 0 Ju l-1 0 Dec -1 0 Ma y -1 1 Oct-1 1 Ma r-1 2 Au g -1 2 Jan -1 3 Ju n -1 3 No v -1 3 Ap r-1 4 Sep -1 4 Feb -1 5 Ju l-1 5 Dec-1 5 Ma y -1 6 Oct-1 6
35
CHAPTER IV
4. DATA AND MODEL
In this section, the response of loan balances is investigated in face of changes in reserve requirement changes, in policy rates and in industrial production index which is considered as a good indicator for economic activity. In the first sub section, these variables are studied in time series and the second sub section consists of event analysis and vector auto regression (VAR) model in order to analyze the interactions between these variables.
4.1: Reserve Requirements Series
In this research, reserve requirements data are taken into consideration in different formats. First, the impact of the reserve requirement ratios on bank loans is analyzed based on average ratios announced by CBT on weekly basis. Weekly data has been transformed to monthly basis by averaging four week data. As shown below chart 4-1, after the first reaction to the global financial crisis, both Turkish Lira and foreign currency average reserve ratios were increased significantly. Although foreign currency reserve ratios were higher than Turkish Lira, due to reserve option mechanism, its average stayed between 9% and 12%. The reserve option mechanism effect was explained shortly in previous section. Besides, marginal RR ratios will be included as a variable in VAR model in order to investigate if it is significant for banks to have RR changes marginally or not. During event analysis, only marginal reserve