arXiv:1211.4682v2 [hep-ex] 21 Nov 2012
Measurements of the branching fractions for
J/ψ and ψ
′→
Λ ¯
Λπ
0and
Λ ¯
Λη
M. Ablikim1, M. N. Achasov6, O. Albayrak3, D. J. Ambrose39, F. F. An1, Q. An40, J. Z. Bai1, Y. Ban26, J. Becker2, J. V. Bennett16, M. Bertani17A, J. M. Bian38, E. Boger19,a, O. Bondarenko20,
I. Boyko19, R. A. Briere3, V. Bytev19, X. Cai1, O. Cakir34A, A. Calcaterra17A, G. F. Cao1, S. A. Cetin34B, J. F. Chang1, G. Chelkov19,a, G. Chen1, H. S. Chen1, J. C. Chen1, M. L. Chen1,
S. J. Chen24, X. Chen26, Y. B. Chen1, H. P. Cheng14, Y. P. Chu1, D. Cronin-Hennessy38, H. L. Dai1, J. P. Dai1, D. Dedovich19, Z. Y. Deng1, A. Denig18, I. Denysenko19,b, M. Destefanis43A,43C, W. M. Ding28, Y. Ding22, L. Y. Dong1, M. Y. Dong1, S. X. Du46, J. Fang1, S. S. Fang1, L. Fava43B,43C, C. Q. Feng40, R. B. Ferroli17A, P. Friedel2, C. D. Fu1, Y. Gao33, C. Geng40, K. Goetzen7, W. X. Gong1, W. Gradl18, M. Greco43A,43C, M. H. Gu1,
Y. T. Gu9, Y. H. Guan36, A. Q. Guo25, L. B. Guo23, T. Guo23, Y. P. Guo25, Y. L. Han1, F. A. Harris37, K. L. He1, M. He1, Z. Y. He25, T. Held2, Y. K. Heng1, Z. L. Hou1, C. Hu23,
H. M. Hu1, J. F. Hu35, T. Hu1, G. M. Huang4, G. S. Huang40, J. S. Huang12, L. Huang1, X. T. Huang28, Y. Huang24, Y. P. Huang1, T. Hussain42, C. S. Ji40, Q. Ji1, Q. P. Ji25, X. B. Ji1,
X. L. Ji1, L. L. Jiang1, X. S. Jiang1, J. B. Jiao28, Z. Jiao14, D. P. Jin1, S. Jin1, F. F. Jing33, N. Kalantar-Nayestanaki20, M. Kavatsyuk20, B. Kopf2, M. Kornicer37, W. Kuehn35, W. Lai1, J. S. Lange35, M. Leyhe2, C. H. Li1, Cheng Li40, Cui Li40, D. M. Li46, F. Li1, G. Li1, H. B. Li1,
J. C. Li1, K. Li10, Lei Li1, Q. J. Li1, S. L. Li1, W. D. Li1, W. G. Li1, X. L. Li28, X. N. Li1, X. Q. Li25, X. R. Li27, Z. B. Li32, H. Liang40, Y. F. Liang30, Y. T. Liang35, G. R. Liao33, X. T. Liao1, D. Lin11, B. J. Liu1, C. L. Liu3, C. X. Liu1, F. H. Liu29, Fang Liu1, Feng Liu4, H. Liu1, H. B. Liu9, H. H. Liu13, H. M. Liu1, H. W. Liu1, J. P. Liu44, K. Liu33, K. Y. Liu22, Kai Liu36, P. L. Liu28, Q. Liu36, S. B. Liu40, X. Liu21, Y. B. Liu25, Z. A. Liu1, Zhiqiang Liu1, Zhiqing Liu1, H. Loehner20, G. R. Lu12, H. J. Lu14, J. G. Lu1, Q. W. Lu29, X. R. Lu36, Y. P. Lu1,
C. L. Luo23, M. X. Luo45, T. Luo37, X. L. Luo1, M. Lv1, C. L. Ma36, F. C. Ma22, H. L. Ma1, Q. M. Ma1, S. Ma1, T. Ma1, X. Y. Ma1, F. E. Maas11, M. Maggiora43A,43C, Q. A. Malik42, Y. J. Mao26, Z. P. Mao1, J. G. Messchendorp20, J. Min1, T. J. Min1, R. E. Mitchell16, X. H. Mo1,
C. Morales Morales11, N. Yu. Muchnoi6, H. Muramatsu39, Y. Nefedov19, C. Nicholson36, I. B. Nikolaev6, Z. Ning1, S. L. Olsen27, Q. Ouyang1, S. Pacetti17B, J. W. Park27, M. Pelizaeus2,
H. P. Peng40, K. Peters7, J. L. Ping23, R. G. Ping1, R. Poling38, E. Prencipe18, M. Qi24, S. Qian1, C. F. Qiao36, L. Q. Qin28, X. S. Qin1, Y. Qin26, Z. H. Qin1, J. F. Qiu1, K. H. Rashid42, G. Rong1,
X. D. Ruan9, A. Sarantsev19,c, B. D. Schaefer16, M. Shao40, C. P. Shen37,d, X. Y. Shen1, H. Y. Sheng1, M. R. Shepherd16, X. Y. Song1, S. Spataro43A,43C, B. Spruck35, D. H. Sun1, G. X. Sun1, J. F. Sun12, S. S. Sun1, Y. J. Sun40, Y. Z. Sun1, Z. J. Sun1, Z. T. Sun40, C. J. Tang30, X. Tang1, I. Tapan34C, E. H. Thorndike39, D. Toth38, M. Ullrich35, G. S. Varner37, B. Q. Wang26,
D. Wang26, D. Y. Wang26, K. Wang1, L. L. Wang1, L. S. Wang1, M. Wang28, P. Wang1, P. L. Wang1, Q. J. Wang1, S. G. Wang26, X. F. Wang33, X. L. Wang40, Y. F. Wang1, Z. Wang1, Z. G. Wang1, Z. Y. Wang1, D. H. Wei8, J. B. Wei26, P. Weidenkaff18, Q. G. Wen40, S. P. Wen1, M. Werner35, U. Wiedner2, L. H. Wu1, N. Wu1, S. X. Wu40, W. Wu25, Z. Wu1, L. G. Xia33, Y. X Xia15, Z. J. Xiao23, Y. G. Xie1, Q. L. Xiu1, G. F. Xu1, G. M. Xu26, Q. J. Xu10, Q. N. Xu36,
X. P. Xu31, Z. R. Xu40, F. Xue4, Z. Xue1, L. Yan40, W. B. Yan40, Y. H. Yan15, H. X. Yang1, Y. Yang4, Y. X. Yang8, H. Ye1, M. Ye1, M. H. Ye5, B. X. Yu1, C. X. Yu25, H. W. Yu26, J. S. Yu21,
S. P. Yu28, C. Z. Yuan1, Y. Yuan1, A. A. Zafar42, A. Zallo17A, Y. Zeng15, B. X. Zhang1, B. Y. Zhang1, C. Zhang24, C. C. Zhang1, D. H. Zhang1, H. H. Zhang32, H. Y. Zhang1, J. Q. Zhang1, J. W. Zhang1, J. Y. Zhang1, J. Z. Zhang1, LiLi Zhang15, R. Zhang36, S. H. Zhang1,
X. J. Zhang1, X. Y. Zhang28, Y. Zhang1, Y. H. Zhang1, Z. P. Zhang40, Z. Y. Zhang44, Zhenghao Zhang4, G. Zhao1, H. S. Zhao1, J. W. Zhao1, K. X. Zhao23, Lei Zhao40, Ling Zhao1, M. G. Zhao25, Q. Zhao1, Q. Z. Zhao9, S. J. Zhao46, T. C. Zhao1, Y. B. Zhao1,
Z. G. Zhao40, A. Zhemchugov19,a, B. Zheng41, J. P. Zheng1, Y. H. Zheng36, B. Zhong23, Z. Zhong9, L. Zhou1, X. K. Zhou36, X. R. Zhou40, C. Zhu1, K. Zhu1, K. J. Zhu1, S. H. Zhu1, X. L. Zhu33, Y. C. Zhu40, Y. M. Zhu25, Y. S. Zhu1, Z. A. Zhu1, J. Zhuang1, B. S. Zou1, J. H. Zou1
(BESIII Collaboration)
1 Institute of High Energy Physics, Beijing 100049, People’s Republic of China
2 Bochum Ruhr-University, D-44780 Bochum, Germany
3 Carnegie Mellon University, Pittsburgh, Pennsylvania 15213, USA 4 Central China Normal University, Wuhan 430079, People’s Republic of China
5China Center of Advanced Science and Technology, Beijing 100190, People’s Republic of China 6 G.I. Budker Institute of Nuclear Physics SB RAS (BINP), Novosibirsk 630090, Russia
7 GSI Helmholtzcentre for Heavy Ion Research GmbH, D-64291 Darmstadt, Germany
8 Guangxi Normal University, Guilin 541004, People’s Republic of China 9 GuangXi University, Nanning 530004, People’s Republic of China 10 Hangzhou Normal University, Hangzhou 310036, People’s Republic of China 11Helmholtz Institute Mainz, Johann-Joachim-Becher-Weg 45, D-55099 Mainz, Germany
12 Henan Normal University, Xinxiang 453007, People’s Republic of China
13Henan University of Science and Technology, Luoyang 471003, People’s Republic of China 14 Huangshan College, Huangshan 245000, People’s Republic of China
15 Hunan University, Changsha 410082, People’s Republic of China 16 Indiana University, Bloomington, Indiana 47405, USA 17 (A)INFN Laboratori Nazionali di Frascati, I-00044, Frascati,
Italy; (B)INFN and University of Perugia, I-06100, Perugia, Italy
18 Johannes Gutenberg University of Mainz,
Johann-Joachim-Becher-Weg 45, D-55099 Mainz, Germany
19 Joint Institute for Nuclear Research, 141980 Dubna, Moscow region, Russia 20 KVI, University of Groningen, NL-9747 AA Groningen, The Netherlands
21 Lanzhou University, Lanzhou 730000, People’s Republic of China 22 Liaoning University, Shenyang 110036, People’s Republic of China 23 Nanjing Normal University, Nanjing 210023, People’s Republic of China
24 Nanjing University, Nanjing 210093, People’s Republic of China 25 Nankai University, Tianjin 300071, People’s Republic of China 26 Peking University, Beijing 100871, People’s Republic of China
27 Seoul National University, Seoul, 151-747 Korea
28 Shandong University, Jinan 250100, People’s Republic of China 29 Shanxi University, Taiyuan 030006, People’s Republic of China 30 Sichuan University, Chengdu 610064, People’s Republic of China
31 Soochow University, Suzhou 215006, People’s Republic of China 32 Sun Yat-Sen University, Guangzhou 510275, People’s Republic of China
33 Tsinghua University, Beijing 100084, People’s Republic of China
34(A)Ankara University, Dogol Caddesi, 06100 Tandogan, Ankara, Turkey; (B)Dogus
University, 34722 Istanbul, Turkey; (C)Uludag University, 16059 Bursa, Turkey
35 Universitaet Giessen, D-35392 Giessen, Germany
36University of Chinese Academy of Sciences, Beijing 100049, People’s Republic of China 37 University of Hawaii, Honolulu, Hawaii 96822, USA
38 University of Minnesota, Minneapolis, Minnesota 55455, USA 39 University of Rochester, Rochester, New York 14627, USA
40University of Science and Technology of China, Hefei 230026, People’s Republic of China 41 University of South China, Hengyang 421001, People’s Republic of China
42 University of the Punjab, Lahore-54590, Pakistan
43(A)University of Turin, I-10125, Turin, Italy; (B)University of Eastern
Piedmont, I-15121, Alessandria, Italy; (C)INFN, I-10125, Turin, Italy
44 Wuhan University, Wuhan 430072, People’s Republic of China 45 Zhejiang University, Hangzhou 310027, People’s Republic of China 46 Zhengzhou University, Zhengzhou 450001, People’s Republic of China
aAlso at the Moscow Institute of Physics and Technology, Moscow 141700, Russia b On leave from the Bogolyubov Institute for Theoretical Physics, Kiev 03680, Ukraine
c Also at the PNPI, Gatchina 188300, Russia
d Present address: Nagoya University, Nagoya 464-8601, Japan
Abstract
We report on a study of the isospin-violating and conserving decays of theJ/ψ and ψ′charmonium state
toΛ¯Λπ0 and Λ¯Λη, respectively. The data are based on 225 million J/ψ and 106 million ψ′ events that
were collected with the BESIII detector. The most accurate measurement of the branching fraction of the
isospin-violating process J/ψ → Λ¯Λπ0 is obtained, and the isospin-conserving processes J/ψ → Λ¯Λη
and ψ′ → Λ¯Λη are observed for the first time. The branching fractions are measured to be B(J/ψ →
Λ¯Λπ0) = (3.78 ± 0.27stat) ± 0.29sys) × 10−5, B(J/ψ → Λ¯Λη) = (15.7 ± 0.79stat ± 1.52sys) × 10−5
and B(ψ′ → Λ¯Λη) = (2.47 ± 0.34
stat ± 0.19sys) × 10−5. No significant signal events are observed for
ψ′ → Λ¯Λπ0 decay resulting in an upper limit of the branching fraction ofB(ψ′ → Λ¯Λπ0) < 0.29 × 10⁻⁵
at the 90% confidence level. The two-body decay of J/ψ → Σ(1385)0Λ + c.c. is searched for, and the¯
upper limit isB(J/ψ → Σ(1385)0Λ + c.c.) < 0.81 × 10¯ −5at the 90% confidence level.
PACS numbers: 13.25.Gv, 12.38.Qk, 14.20.Gk
I. INTRODUCTION
The charmonium vector meson, J/ψ, is usually interpreted as an SU(3) singlet c¯c bound states with an isospin I=0. Systematic measurements of its decay rates into final states that are isospin violating are of particular interest, since these results will provide a sensitive probe to study symmetry-breaking effects in a controlled environment. In this paper, we present a systematic study of isospin-conserving and violating decays of charmonium vector mesons into baryonic decays accompanied by a light pseudoscalar meson, namely J/ψ(ψ′) → Λ¯Λη and
J/ψ(ψ′) → Λ¯Λπ0, respectively.
This work is for a large part motivated by a controversial observation that was made in the past while studying the baryonic decay of theJ/ψ. Surprisingly, the average branching fraction of the isospin violating decay ofJ/ψ → Λ¯Λπ0measured by DM2 [1] and by BESI [2] was determined to beB(J/ψ → Λ¯Λπ0) = (2.2 ± 0.6) × 10−4, while the isospin conserving decay modeJ/ψ → Λ¯Λη
was not reported by either experiment. In 2007, the decays ofJ/ψ and ψ′ to the final states with
aΛ¯Λ pair plus a neutral pseudoscalar meson were studied using 58 million J/ψ and 14 million ψ′ events collected with the BESII detector [3]. The new measurement suggested that the two
previous studies ofJ/ψ → Λ¯Λπ0may have overlooked the sizable background contribution from
J/ψ → Σ0π0Λ + c.c.. The BESII experiment removed this type of background contribution¯
and only a few statistically insignificant J/ψ → Λ¯Λπ0 signal events remained, resulting in an
upper limit ofB(J/ψ → Λ¯Λπ0) < 0.64 × 10⁻⁴. Moreover, the isospin conserving decay mode,
J/ψ → Λ¯Λη, was observed for the first time with a significance of 4.8σ. However, signal events of the channelsψ′ → Λ¯Λπ0 andψ′ → Λ¯Λη were not observed by BESII, and resulted in upper
limits ofB(ψ′ → Λ¯Λπ0) < 4.9 × 10⁻⁵andB(ψ′ → Λ¯Λη) < 1.2 × 10⁻⁴.
In 2009, BESIII collected 225 millionJ/ψ [4] and 106 million ψ′ [5] events. These samples
provide a unique opportunity to revisit these isospin conserving and violating decays with im-proved sensitivity to confirm the previous observations inJ/ψ decays with BESII. The ambition is to investigate as well the same final states inψ′decays with the new record in statistics, and look
for possible anomalies. A measurement of these branching fractions would be a test of the “12%” rule [6]. The data allow in addition a search for the two-body decaysJ/ψ → Σ(1385)0Λ + c.c..¯
II. EXPERIMENTAL DETAILS
BEPCII is a double-ring e+e− collider that has reached a peak luminosity of about 0.6 ×
1033 cm−2s−1 at the center of mass energy of 3.77 GeV. The cylindrical core of the BESIII
de-tector consists of a helium-based main drift chamber (MDC), a plastic scintillator time-of-flight system (TOF), and a CsI(Tl) electromagnetic calorimeter (EMC), which are all enclosed in a su-perconducting solenoidal magnet providing a 1.0 T magnetic field. The solenoid is supported by an octagonal flux-return yoke with resistive plate counter muon identifier modules interleaved with steel. The acceptance for charged particles and photons is 93% over 4π stereo angle, and the charged-particle momentum and photon energy resolutions at 1 GeV are 0.5% and 2.5%, respec-tively. The detector is described in more detail in [7].
The optimization of the event selection criteria and the estimates of physics background sources are performed through Monte Carlo (MC) simulations. The BESIII detector is modeled with the
GEANT4toolkit [8, 9]. Signal events are generated according to a uniform phase-space distribution.
Inclusive J/ψ and ψ′ decays are simulated with the KKMC [10] generator. Known decays are
modeled by the EVTGEN [11] generator according to the branching fractions provided by the
Particle Data Group (PDG) [12], and the remaining unknown decay modes are generated with the
LUNDCHARM model [13].
III. EVENT SELECTION
The decay channels investigated in this paper areJ/ψ (ψ′) → Λ¯Λπ0 andJ/ψ (ψ′) → Λ¯Λη.
The final states includeΛ, ¯Λ and one neutral pseudoscalar meson (π0orη), where Λ (¯Λ) decays to
π−p (π+p), while the π¯ 0andη decay to γγ. Candidate events are required to satisfy the following
common selection criteria:
1. Only events with at least two positively charged and two negatively charged tracks are kept. No requirements are made on the impact parameters of the charged tracks as the tracks are supposed to originate from secondary vertices.
2. The transverse momenta of the proton and anti-proton are required to be larger than 0.2 GeV/c. Tracks with smaller transverse momenta are removed since the MC simulation fails to describe such extremely soft tracks.
3. Photon candidates are identified from the reconstructed showers in the EMC. Photon ener-gies are required to be larger than 25 MeV in the EMC barrel region (| cos θ| < 0.8) and larger than 50 MeV in the EMC end-cap (0.86 < | cos θ| < 0.92). The overlapping showers between the barrel and end-cap (0.8 < | cos θ| < 0.86) are poorly reconstructed, there-fore, excluded from the analysis. In addition, timing requirements are imposed on photon candidates to suppress electronic noise and energy deposits from uncorrelated events.
4. The Λ and ¯Λ candidates are identified by a reconstruction of decay vertices from pairs of oppositely charged tracks pπ− andpπ¯ + [14]. At least one pπ− and onepπ¯ + candidate are
required to pass the Λ (¯Λ) vertex fit successfully by looping over all the combinations of positive and negative charged tracks. In the case of multipleΛ¯Λ pair candidates, the one with the minimum value of(Mpπ− − MΛ)2+ (Mpπ¯ + − MΛ¯)2 is chosen, whereMΛ(MΛ¯) is
the nominal mass ofΛ(¯Λ), obtained from the PDG [12].
5. To further reduce the background and to improve the resolution of the reconstructed parti-cle momenta, candidate signal events are subjected to a four constraint energy-momentum conservation (4C) kinematic fit under the hypothesis ofJ/ψ (ψ′) → Λ¯Λγγ. In the case of
several combinations due to additional photons, the one with the bestχ2
4C value is chosen.
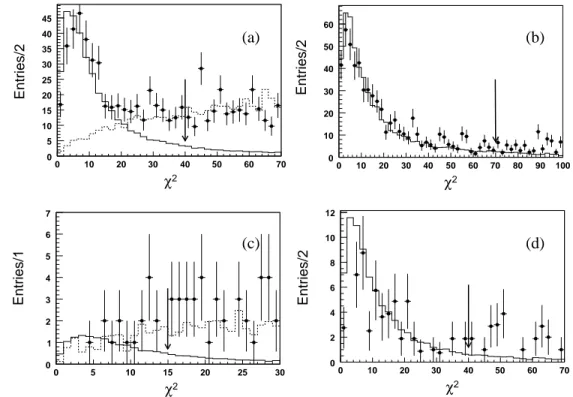
In addition, a selection is made on theχ2
4C. Its value is determined by optimizing the signal
significanceS/√S + B, where S (B) is the number of signal (background) events in the signal region. This requirement is effective against background with one or several addi-tional photons likeJ/ψ, ψ′ → Σ0π0Λ + c.c. (Σ¯ 0 → γΛ) or J/ψ, ψ′ → Λ¯Λ + nγ (n ≥ 4)
decays (for instance J/ψ, ψ′ → Σ(1385)0Σ(1385)¯ 0, Ξ0Ξ¯0, etc.). For J/ψ → Λ¯Λπ0,
backgrounds are suppressed by requiring χ2
4C < 40 (see Fig. 1(a)). For J/ψ → Λ¯Λη,
the requirement is set to χ2
4C < 70 (see Fig. 1(b)). For ψ′ → Λ¯Λπ0, due to the peaking
backgroundψ′ → Σ0π0Λ + c.c. the χ¯ 2
4C is required to be less than 15 (see Fig. 1(c)). For
ψ′ → Λ¯Λη, we select events with χ2
4C < 40 (see Fig. 1(d)).
Followed by the common selection criteria, a further background reduction is obtained by ap-plying various mass constraints depending on the channel of interest. To select a clean sample of Λ and ¯Λ signal events, the invariant masses of pπ− and pπ¯ + are required to be within the mass
window of |Mpπ − MΛ| < 5 MeV/c2. Here, the invariant mass is reconstructed with improved
momenta from the 4C kinematic fit. The mass resolutions ofΛ and ¯Λ are about 1.0 MeV/c2. For
J/ψ → Λ¯Λπ0, a mass selection of|M
pπ0 − 1189.0| > 10 MeV/c2 is used to exclude background
Author's Copy
from J/ψ → Σ+π−Λ + c.c. (Σ¯ + → pπ0) which can form a peak near the π0 mass. The
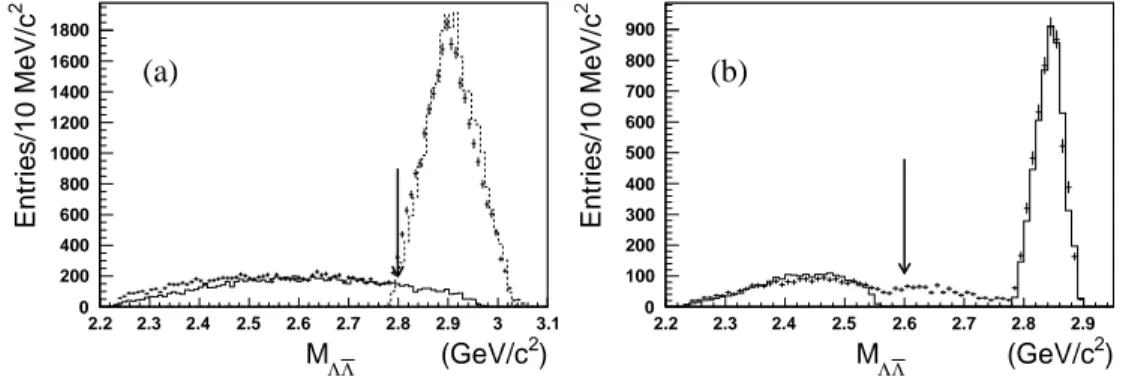
back-ground fromJ/ψ → Σ0Σ¯0 is removed by selecting events withM
Λ ¯Λ < 2.8 GeV/c2 as shown in
Fig. 2(a). ForJ/ψ → Λ¯Λη, a selection of events with MΛ ¯Λ < 2.6 GeV/c2 rejects all background
contributions fromJ/ψ → Σ0Σ¯0 decays as shown in Fig. 2(b). Forψ′ → Λ¯Λπ0 andψ′ → Λ¯Λη,
events must satisfy the condition |Mπrecoil+π− − 3097| > 8 MeV/c
2 to remove the background from
ψ′ → π+π−J/ψ (J/ψ → p¯pπ0 andp¯pη). The background from ψ′ → γγJ/ψ (J/ψ → Λ¯Λ) and
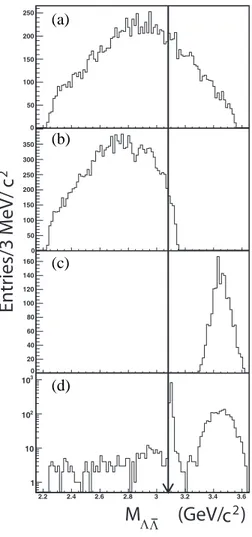
ψ′ → Σ0Σ¯0is rejected by the requirementM
Λ ¯Λ < 3.08 GeV/c2. TheΛ¯Λ invariant-mass
distribu-tions for data and MC events fromψ′ → Λ¯Λπ0, Λ¯Λη, and Σ0Σ¯0 are shown in Fig. 3. The scatter
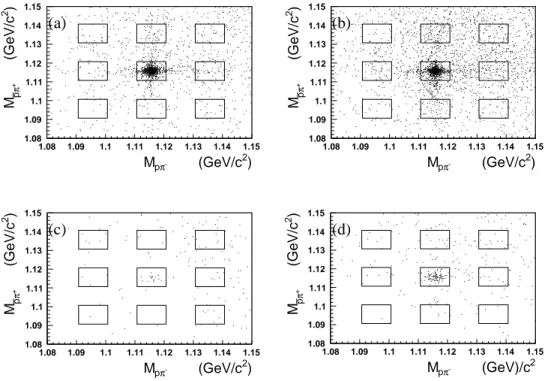
plot ofMpπ−versusMpπ¯ + after applying all selection criteria is shown in Fig. 4. No visible signal
ofψ′ → Λ¯Λπ0is observed. 2 χ 0 10 20 30 40 50 60 70 Entries/2 0 5 10 15 20 25 30 35 40 45 (a) (a) 2 χ 0 10 20 30 40 50 60 70 80 90 100 Entries/2 0 10 20 30 40 50 60 (b) 2 χ 0 5 10 15 20 25 30 Entries/1 0 1 2 3 4 5 6 7 (c) 2 χ 0 10 20 30 40 50 60 70 Entries/2 0 2 4 6 8 10 12 (d)
FIG. 1: Theχ24C distributions of 4C fits. Dots with error bars denote data, and the histograms correspond to
the result of MC simulations. (a)J/ψ → Λ¯Λπ0. The dashed line is the dominant background distribution
fromJ/ψ → Σ0π0Λ + c.c. with MC simulated events, the arrow denotes the selection of χ¯ 24C <40. (b) J/ψ → Λ¯Λη, the arrow denotes the selection of χ2
4C <70. (c) ψ′ → Λ¯Λπ0. The dashed line is the
dominant background distribution fromψ′ → Σ0π0Λ + c.c. with MC simulated events, the arrow denotes¯
the selection ofχ2
4C <15. (d) ψ′ → Λ¯Λη, and the arrow denotes the selection of χ24C <40.
) 2 (GeV/c Λ Λ M 2.2 2.3 2.4 2.5 2.6 2.7 2.8 2.9 3 3.1 2 Entries/10 MeV/c 0 200 400 600 800 1000 1200 1400 1600 1800 (a) (a) ) 2 (GeV/c Λ Λ M 2.2 2.3 2.4 2.5 2.6 2.7 2.8 2.9 2 Entries/10 MeV/c 0 100 200 300 400 500 600 700 800 900 (b)
FIG. 2: TheΛ¯Λ invariant-mass, MΛ ¯Λ, distributions forJ/ψ → Λ¯Λγγ candidates. Dots with errors denote
data. The dashed-line shows the result of MC simulated events of J/ψ → Σ0Σ¯0 which is normalized
according to the branching fraction from the PDG. (a) Histogram shows the MC simulated events ofJ/ψ →
Λ¯Λπ0, where the arrow denotes the selection ofM
Λ ¯Λ <2.8 GeV/c2. (b) Histogram shows the MC simulated
events ofJ/ψ → Λ¯Λη, and the arrow shows the selection of MΛ ¯Λ<2.6 GeV/c2.
IV. BACKGROUND STUDY
Backgrounds that have the same final states as the signal channels such as J/ψ, ψ′ →
Σ0Σ¯0, Σ+π−Λ + c.c. are either suppressed to a negligible level or completely removed. Back-¯
ground channels that contain one or more photons than the signal channels like J/ψ, ψ′ →
Σ(1385)0Σ(1385)¯ 0, Ξ0Ξ¯0 have very few events passing event selection. The line shape of the
peaking background sources,J/ψ, ψ′ → Σ0π0Λ + c.c., is used in the fitting procedure to estimate¯
their contributions. The contribution of remaining backgrounds from non-Λ¯Λ decays including J/ψ, ψ′ → π+π−p¯pπ0(η) is estimated using sideband studies as illustrated in Fig. 4. The square
with a width of10 MeV/c2around the nominal mass of theΛ and ¯Λ is taken as the signal region.
The eight squares surrounding the signal region are taken as sideband regions. The area of all the squares is equal. The sum of events in the sideband squares,PNsideband region, times a
normaliza-tion factorf is taken as the background contribution in the signal region. The normalization factor f is defined as
f = PNsignal region Nsideband region
.
The normalization factor is obtained from phase-space MC simulations of J/ψ (ψ′) →
p¯pπ+π−π0 or p¯pπ+π−η with N
signal region as the number of MC events in the signal region and
P
Nsideband regionas the sum of MC events in the sideband regions.
With 44 pb−1of data collected at a center-of-mass energy ofE
cm = 3.65 GeV, the contribution
50 100 150 200 250 50 100 150 200 250 300 350 20 40 60 80 100 120 140 160
)
2(GeV/c
Λ ΛM
2.2 2.4 2.6 2.8 3 3.2 3.4 3.6 1 10 2 10 3 10Entries/3 MeV/
c
2 0 0 0 (a) (b) (c) (d)FIG. 3: TheΛ¯Λ invariant-mass, MΛ ¯Λ, distributions forψ′ → Λ¯Λγγ candidates. (a) MC simulated events
ofψ′ → Λ¯Λπ0, (b) MC simulated events ofψ′ → Λ¯Λη, (c) MC simulated events of ψ′ → Σ0Σ¯0, and (d)
data. The arrow denotes the selection ofMΛ ¯Λ <3.08 GeV/c2. The peak around theJ/ψ mass is from the
decay ofψ′ → γγJ/ψ, J/ψ → Λ¯Λ.
.
from the continuum background is determined. From this data sample, no events survive in theπ0
orη mass region in the two-photon invariant-mass, Mγγ, distribution after applying all selection
criteria. Therefore, we neglect this background.
V. SIGNAL YIELDS AND DALITZ ANALYSES
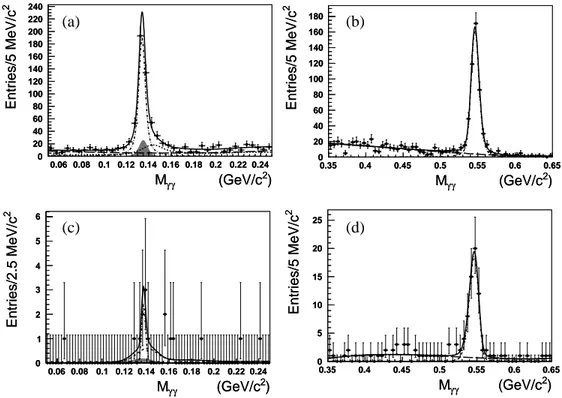
Theγγ invariant-mass spectra of J/ψ → Λ¯Λπ0, Λ¯Λη, ψ′ → Λ¯Λπ0 andΛ¯Λη of the remaining
events after the previously described signal selection procedure are shown in Fig. 5. A clear π0
) 2 (GeV/c -π p M 1.08 1.09 1.1 1.11 1.12 1.13 1.14 1.15 ) 2 (GeV/c+π p M 1.08 1.09 1.1 1.11 1.12 1.13 1.14 1.15 (a) ) 2 (GeV/c -π p M 1.08 1.09 1.1 1.11 1.12 1.13 1.14 1.15 ) 2 (GeV/c+π p M 1.08 1.09 1.1 1.11 1.12 1.13 1.14 1.15 (b) ) 2 (GeV/c -π p M 1.08 1.09 1.1 1.11 1.12 1.13 1.14 1.15 ) 2 (GeV/c+π p M 1.08 1.09 1.1 1.11 1.12 1.13 1.14 1.15 (c) 2 (GeV)/c -π p M 1.08 1.09 1.1 1.11 1.12 1.13 1.14 1.15 ) 2 (GeV/c+π p M 1.08 1.09 1.1 1.11 1.12 1.13 1.14 1.15 (d)
FIG. 4: A scatter plot ofMpπ¯ + versusMpπ−forJ/ψ and ψ′data. (a)J/ψ → Λ¯Λπ0, (b)J/ψ → Λ¯Λη, (c)
ψ′ → Λ¯Λπ0, and (d)ψ′ → Λ¯Λη.
and η signal can be observed in the J/ψ data. The ψ′ data set shows a significantη signal, but
lacks a pronounced peak near theπ0mass.
The number of signal events are extracted by fitting the Mγγ distributions with the
parame-terized signal shape from MC simulations. ForJ/ψ (ψ′) → Λ¯Λπ0, the dominant peaking
back-grounds fromJ/ψ (ψ′) → Σ0π0Λ + c.c. are estimated by MC simulation. The fit also accounts¯
for background estimates from a normalized sideband analysis. Other background sources are de-scribed by a Chebychev polynomial for all channels exceptψ′ → Λ¯Λπ0 where there are too few
events surviving. The fit yields323 ± 23 π0events,454 ± 23 η events in J/ψ data and 60.4 ± 8.4 η events inψ′ data. Forψ′ → Λ¯Λπ0, the upper limit onN
π0 is 9 at the 90% confidence level (C.L.)
and is determined with a Bayesian method [15]. Forψ′ → Λ¯Λη, the change in log likelihood value
in the fit with and without the signal function is used to determine theη signal significance, which is estimated to be 10.5σ.
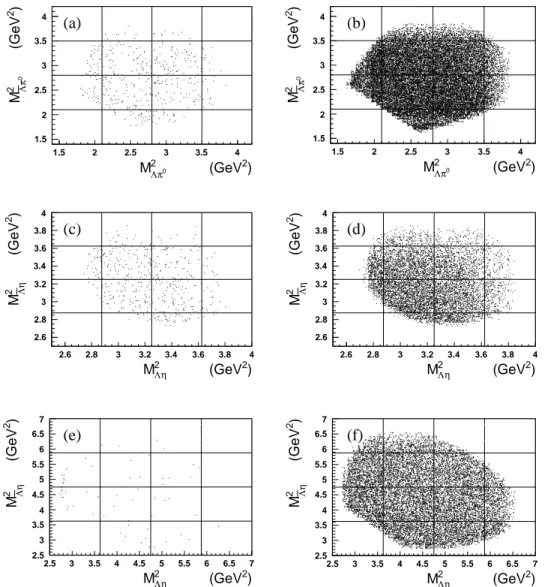
To study the existence of intermediate resonance states in the decay of J/ψ → Λ¯Λπ0,
J/ψ → Λ¯Λη and ψ′ → Λ¯Λη and to validate the phase-space assumption that was used in the MC
simulations, we have performed a Dalitz plot analysis of the invariant masses involved in the
) 2 (GeV/c γ γ M 0.06 0.08 0.1 0.12 0.14 0.16 0.18 0.2 0.22 0.24 2 Entries/5 MeV/c 0 20 40 60 80 100 120 140 160 180 200 220 240 ) 2 (GeV/c γ γ M 0.06 0.08 0.1 0.12 0.14 0.16 0.18 0.2 0.22 0.24 2 Entries/5 MeV/c 0 20 40 60 80 100 120 140 160 180 200 220 240 (a) ) 2 (GeV/c γ γ M 0.35 0.4 0.45 0.5 0.55 0.6 0.65 2 Entries/5 MeV/c 0 20 40 60 80 100 120 140 160 180 ) 2 (GeV/c γ γ M 0.35 0.4 0.45 0.5 0.55 0.6 0.65 2 Entries/5 MeV/c 0 20 40 60 80 100 120 140 160 180 (b) ) 2 (GeV/c γ γ M 0.06 0.08 0.1 0.12 0.14 0.16 0.18 0.2 0.22 0.24 2 Entries/2.5 MeV/c 0 1 2 3 4 5 6 ) 2 (GeV/c γ γ M 0.06 0.08 0.1 0.12 0.14 0.16 0.18 0.2 0.22 0.24 2 Entries/2.5 MeV/c 0 1 2 3 4 5 6 (c) ) 2 (GeV/c γ γ M 0.35 0.4 0.45 0.5 0.55 0.6 0.65 2 Entries/5 MeV/c 0 5 10 15 20 25 ) 2 (GeV/c γ γ M 0.35 0.4 0.45 0.5 0.55 0.6 0.65 2 Entries/5 MeV/c 0 5 10 15 20 25 (d)
FIG. 5: The two-photon invariant-mass,Mγγ, distributions in theπ0andη mass regions for the channels (a)
J/ψ → Λ¯Λπ0, (b)J/ψ → Λ¯Λη, (c) ψ′ → Λ¯Λπ0, and (d)ψ′ → Λ¯Λη. Dots with error bars are data. The
solid lines are the fit to data, and the dot-dashed lines are the signal shape determined from MC simulations. The hatched histograms are the background contributions obtained from a normalized sideband analysis.
The dashed lines in J/ψ, ψ → Λ¯Λπ0 correspond to the peaking background from Σ0π0Λ. The long¯
dashed lines denote other background contributions which are described by Chebychev polynomials.
body decay. These results are shown in Fig. 6. For these plots, π0 andη candidates are selected
within mass windows of 0.12 GeV/c2< M
γγ <0.14 GeV/c2 and 0.532 GeV/c2< Mγγ < 0.562
GeV/c2, respectively. In all the Dalitz plots, no clear structures are observed. A χ2 test is
per-formed to confirm the consistency between data and the phase-space distributed MC events. The χ2is determined as follows: χ2 =X i (ndata i − nM Ci /g)2 ndata i , where g is the scaling factor between data and MC (g = nM C
ndata), n
data/M C
i refers to the number
of data/MC events in a particular bin in the Dalitz plot, and the sum runs over all bins. We divide the Dalitz plots into 8 bins. Boxes with very few events are combined into an adjacent bin. Theχ2/n.d.f. are equal to 1.1 and 2.1 for J/ψ → Λ¯Λπ0 and J/ψ → Λ¯Λη, respectively, which
validates the usage of a phase-space assumption in the MC simulations.
) 2 (GeV 2 0 π Λ M 1.5 2 2.5 3 3.5 4 ) 2 (GeV 2 0π Λ M 1.5 2 2.5 3 3.5 4 (a) ) 2 (GeV 2 0 π Λ M 1.5 2 2.5 3 3.5 4 ) 2 (GeV 2 0π Λ M 1.5 2 2.5 3 3.5 4 (b) ) 2 (GeV 2 η Λ M 2.6 2.8 3 3.2 3.4 3.6 3.8 4 ) 2 (GeV 2 ηΛ M 2.6 2.8 3 3.2 3.4 3.6 3.8 4 (c) ) 2 (GeV 2 η Λ M 2.6 2.8 3 3.2 3.4 3.6 3.8 4 ) 2 (GeV 2 ηΛ M 2.6 2.8 3 3.2 3.4 3.6 3.8 4 (d) ) 2 (GeV 2 η Λ M 2.5 3 3.5 4 4.5 5 5.5 6 6.5 7 ) 2 (GeV 2 ηΛ M 2.5 3 3.5 4 4.5 5 5.5 6 6.5 7 (f) (e) ) 2 (GeV 2 η Λ M 2.5 3 3.5 4 4.5 5 5.5 6 6.5 7 ) 2 (GeV 2 ηΛ M 2.5 3 3.5 4 4.5 5 5.5 6 6.5 7 (f) (f)
FIG. 6: Dalitz plots of the invariant massesMΛπ¯2 0(η) versus MΛπ2 0(η) for the channels (a)J/ψ → Λ¯Λπ0
(data), (b)J/ψ → Λ¯Λπ0(MC), (c)J/ψ → Λ¯Λη (data), (d) J/ψ → Λ¯Λη (MC), (e) ψ′ → Λ¯Λη (data), and
(f)ψ′→ Λ¯Λη (MC). See text for more details.
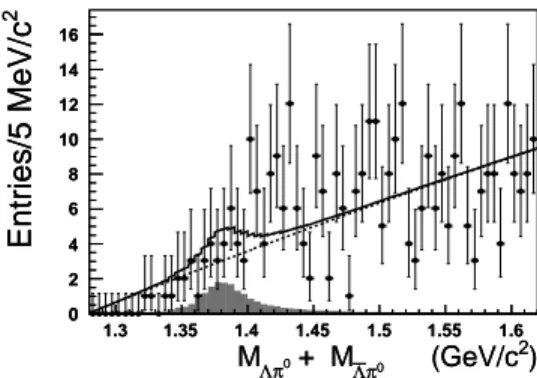
We have studied the branching fraction of the decay J/ψ → Σ(1385)0Λ + c.c. by com-¯ bining and analyzing the invariant-mass spectra of Λπ0 and ¯Λπ0 pairs as depicted in Fig. 7.
For this analysis, π0 events are selected by applying a two-photon invariant-mass selection of 0.12 GeV/c2< M
γγ <0.14 GeV/c2. For the fit, the signal function is taken from a MC
simula-tion ofJ/ψ → Σ(1385)0Λ + c.c., and the background function is taken from a MC simulation¯ ofJ/ψ → Λ¯Λπ0. A Bayesian analysis gives an upper limit on the number ofΣ(1385)0Λ + c.c.¯
events of 37 at the 90% C.L..
) 2 (GeV/c 0 π Λ + M 0 π Λ M 1.3 1.35 1.4 1.45 1.5 1.55 1.6 2 Entries/5 MeV/c 0 2 4 6 8 10 12 14 16 ) 2 (GeV/c 0 π Λ + M 0 π Λ M 1.3 1.35 1.4 1.45 1.5 1.55 1.6 2 Entries/5 MeV/c 0 2 4 6 8 10 12 14 16
FIG. 7: A search forΣ(1385)0events by fitting the combinedMΛπ¯ 0 andMΛπ0 invariant-mass distributions.
Dots with error bars are data. The solid line is the fit to data. The hatched histogram is the signal func-tion obtained from a MC simulafunc-tion, and the dashed line is the background funcfunc-tion obtained from a MC
simulation ofJ/ψ → Λ¯Λπ0.
VI. SYSTEMATIC ERRORS
To estimate the systematic errors in the measured branching fractions of the channels of interest, we include uncertainties in the efficiency determination of charged and photon tracks, in the vertex and 4C kinematic fits, in the selection criteria for the signal and sideband region, and in the fit range. The uncertainties in the total number ofJ/ψ and ψ′ events and in the branching fractions
of intermediate state are considered as well. Below we discuss briefly the analysis that is used to determine the various sources of systematic uncertainties.
• Tracking efficiency. We estimate this type of systematic uncertainty by taking the difference between the tracking efficiency obtained via a control channel from data with the efficiency obtained from MC simulations. The control sampleJ/ψ → pK−Λ + c.c. is employed to¯
study the systematic error of the tracking efficiency from theΛ (¯Λ) decay. For example, to determine the tracking efficiency of the π+ tracks, we select events with at least three
charged tracks, the proton, kaon and anti-proton. The total number of π+ tracks, N0 π+,
can be determined by fitting the recoiling mass distribution of thepK−p system, M¯ pK−p¯ recoil.
In addition, one obtains the number of detected π+ tracks, N1
π+, by fitting M
pK−p¯
recoil, after
requiring all four charged tracks be reconstructed. The π+ tracking efficiency is simply
ǫπ+ =
N1 π+
N0 π+
. Similarly, we obtained the tracking efficiencies forπ−, p, and ¯p. With 225 ×
106 inclusive MC events, we obtained the corresponding tracking efficiency for the MC
simulation. The tracking efficiency difference between data and MC simulation is about
1.0% for each pion track. This difference is also about 1.0% for a proton (anti-proton) if its transverse momentum,Pt, is larger than 0.3 GeV/c. The difference increases to about 10%
for the range 0.2 GeV/c<Pt<0.3 GeV/c. Conservatively, we take a systematic error due
to tracking of 1% for each pion. For the proton (anti-proton), we use weighted systematic errors, namely 2% inJ/ψ → Λ¯Λπ0, 3.5% inJ/ψ → Λ¯Λη, 1.5% in ψ′ → Λ¯Λπ0, and 2% in
ψ′ → Λ¯Λη.
• Vertex fit. The uncertainties due to the Λ and ¯Λ vertex fits are determined to be 1.0% for each by using the same control samples and a similar procedure as described for the tracking efficiency.
• Photon efficiency. The photon detection efficiency was studied by comparing the photon efficiency between MC simulation and the control sampleJ/ψ → ρ0π0. The relative
effi-ciency difference is about 1% for each photon [16], which value was used as a systematic uncertainty.
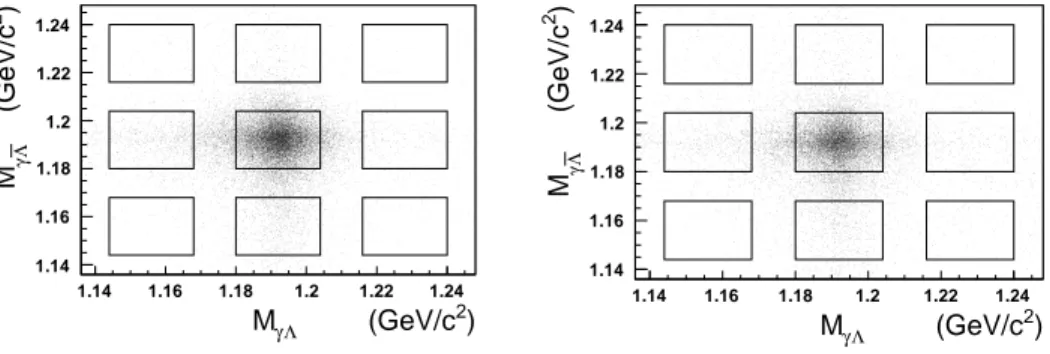
• Efficiency of the kinematic fit. The control sample of J/ψ → Σ0Σ¯0, Σ0 ( ¯Σ0) → γΛ (¯Λ)
is used to study the efficiency of the 4C kinematic fit since its final state is the same as our signal. The event selection criteria for charged tracks and photons and the reconstruction of Λ (¯Λ) are the same as in our analysis. If there are more than two photon candidates in an event, we loop over all possible combinations and keep the one with the smallest value for(MγΛ − MΣ0)2 + (Mγ ¯Λ− MΣ¯0)2. Furthermore, the remaining backgrounds are
suppressed by limiting the momentum windows ofΣ0and ¯Σ0, i.e.,|P
Σ0− 980| < 40 MeV/c
and|PΣ¯0 − 980| < 40 MeV/c. Figure 8 shows the scatter plot of MγΛ versusMγ ¯Λ for the
inclusive MC events andJ/ψ data after applying all event selection criteria. The square in the center with a width of 10 MeV/c2 is taken as the signal region. Almost no background
is found according to the topology analysis from inclusive MC events. The candidate signal events for both data and MC events are subjected to the same 4C kinematic fit as that in our analysis. The efficiency of the 4C kinematic fit is defined as the ratio of the number of signal events with and without a 4C kinematic fit. A correction factor,f4C, can be obtained
by comparing the efficiency of the 4C kinematic fit between data and MC simulation. i.e., f4C = ǫ
data 4C
ǫM C 4C
. The efficiency corrections corresponding toχ2 < 15, 40, 70 are (90.3 ± 0.8)%,
(97.5 ± 0.6)% and (98.7 ± 0.3)%, respectively. The errors in the efficiency corrections are
taken as a systematic uncertainty. ) 2 (GeV/c Λ γ M 1.14 1.16 1.18 1.2 1.22 1.24 ) 2 (GeV/c Λγ M 1.14 1.16 1.18 1.2 1.22 1.24 ) 2 (GeV/c Λ γ M 1.14 1.16 1.18 1.2 1.22 1.24 ) 2 (GeV/c Λγ M 1.14 1.16 1.18 1.2 1.22 1.24
FIG. 8: The scatter plot ofMγΛ versus Mγ ¯Λ forJ/ψ → Σ0Σ¯0 for (left) data and (right) inclusive MC
events.
• Fit range. The π0,η, and Σ(1385)0 yields are obtained by fitting the data around the
corre-sponding mass value. By changing the mass ranges for the fits, the number of signal events changes slightly. These differences are taken as the errors due to the uncertainty of the fit range.
• Signal and sideband regions. By changing the signal and sideband region from 5 MeV/c2×5
MeV/c2 to 6 MeV/c2×6 MeV/c2, the number of fittedπ0, η and Σ(1385)0 events changes
slightly for data and MC. The differences in yield between the two region sizes are taken as systematic errors.
• Background shape. A part of the background depicted in Fig. 5 is estimated by a fit with a third-order Chebychev polynomial. The differences in signal yield with a background function that is changed to a second-order polynomial, are taken as a systematic error due to the uncertainty in the description of the background shape.
• Total number of J/ψ and ψ′ events. The total numbers ofJ/ψ and ψ′ events are obtained
from inclusive hadronicJ/ψ and ψ′ decays with uncertainties of 1.24% [4] and 0.81% [5],
respectively.
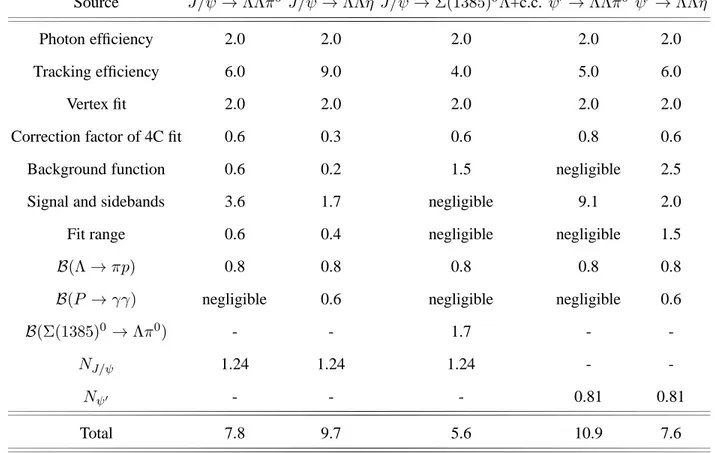
All the sources of systematic errors are summarized in Table I. The total systematic error is calcu-lated as the quadratic sum of all individual terms.
TABLE I: Systematic errors in the measurements of the branching fractions (%).
Source J/ψ → Λ¯Λπ0 J/ψ → Λ¯Λη J/ψ → Σ(1385)0Λ+c.c. ψ¯ ′→ Λ¯Λπ0 ψ′ → Λ¯Λη
Photon efficiency 2.0 2.0 2.0 2.0 2.0
Tracking efficiency 6.0 9.0 4.0 5.0 6.0
Vertex fit 2.0 2.0 2.0 2.0 2.0
Correction factor of 4C fit 0.6 0.3 0.6 0.8 0.6
Background function 0.6 0.2 1.5 negligible 2.5
Signal and sidebands 3.6 1.7 negligible 9.1 2.0
Fit range 0.6 0.4 negligible negligible 1.5
B(Λ → πp) 0.8 0.8 0.8 0.8 0.8
B(P → γγ) negligible 0.6 negligible negligible 0.6
B(Σ(1385)0 → Λπ0) - - 1.7 -
-NJ/ψ 1.24 1.24 1.24 -
-Nψ′ - - - 0.81 0.81
Total 7.8 9.7 5.6 10.9 7.6
VII. RESULTS
The branching fraction ofJ/ψ (ψ′) → X is determined by the relation
B(J/ψ (ψ′) → X) = N
obs[J/ψ (ψ′) → X → Y ]
NJ/ψ (ψ′)· B (X → Y ) · ǫ[J/ψ (ψ′) → X → Y ] · f4C
,
and if the signal is not significant, the corresponding upper limit of the branching fraction is obtained by B(J/ψ (ψ′) → X) < N obs U L[J/ψ (ψ′) → X → Y ] NJ/ψ (ψ′)· B (X → Y ) · ǫ[J/ψ (ψ′) → X → Y ] · f4C · (1.0 − σsys.) , where, Nobs is the number of observed signal events or its upper limitNobs
U L, Y is the final state,
X is the intermediate state, ǫ is the detection efficiency, and σsys. is the systematic error. The
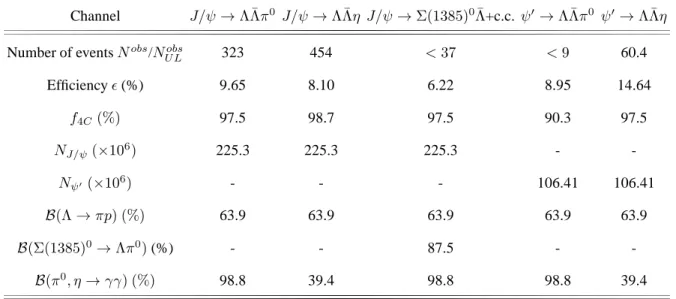
branching fraction ofX → Y is taken from the PDG [12]. Table II lists the various numbers that were used in the calculation of the branching fractions. With these, we obtain
TABLE II: Numbers used in the calculations of the branching fractions.
Channel J/ψ → Λ¯Λπ0
J/ψ → Λ¯Λη J/ψ → Σ(1385)0¯
Λ+c.c. ψ′→ Λ¯Λπ0
ψ′→ Λ¯Λη
Number of eventsNobs/Nobs
UL 323 454 < 37 < 9 60.4 Efficiencyǫ (%) 9.65 8.10 6.22 8.95 14.64 f4C(%) 97.5 98.7 97.5 90.3 97.5 NJ/ψ(×10 6 ) 225.3 225.3 225.3 - -Nψ′ (×106) - - - 106.41 106.41 B(Λ → πp) (%) 63.9 63.9 63.9 63.9 63.9 B(Σ(1385)0 → Λπ0 ) (%) - - 87.5 - -B(π0 , η → γγ) (%) 98.8 39.4 98.8 98.8 39.4 B(J/ψ → Λ¯Λπ0) = (3.78 ± 0.27 (stat.) ± 0.29 (sys.)) × 10−5, B(ψ′ → Λ¯Λπ0 ) < 0.29 × 10⁻⁵, B(J/ψ → Λ¯Λη) = (15.7 ± 0.79 (stat.) ± 1.52 (sys.)) × 10−5, B(ψ′ → Λ¯Λη) = (2.47 ± 0.34 (stat.) ± 0.19 (sys.)) × 10−5, B(J/ψ → Σ(1385)0Λ + c.c) < 0.81 × 10¯ −5.
Here the upper limits correspond to the 90% C.L..
With these results, one can test whether the branching ratio between theψ′ andJ/ψ decays to
the same hadronic final state,Qh, is compatible with the expected 12% rule [6]. We find aQhfor
the channelsΛ¯Λπ0andΛ¯Λη of
Qh = B(ψ ′ → Λ¯Λπ0) B(J/ψ → Λ¯Λπ0) < 10.0% at the 90% C.L., and, Qh = B(ψ ′ → Λ¯Λη) B(J/ψ → Λ¯Λη) = (15.7 ± 2.9)%.
The errors reflect a quadratic sum of the systematic and statistical error, whereby some of the common sources of systematic errors have been canceled. Clearly, the isospin-violated decay Λ¯Λπ0 is suppressed inψ′ decays, whileQ
h for the isospin-allowed decay, Λ¯Λη, agrees with the
VIII. SUMMARY
This paper presents measurements of the branching fractions of the isospin-violating and isospin-conserving decays of the J/ψ and ψ′ into Λ¯Λπ0 andΛ¯Λη, respectively. The results
to-gether with the measurements from previous experiments are summarized in Table III. We note that the earlier measurements of the branching fraction of the decay Λ¯Λπ0 by BESI and DM2
likely overlooked a sizeable background contribution in their analysis as supported by the BESII and BESIII results. Hence, we claim that we have observed for the first time the two processes, J/ψ → Λ¯Λπ0 andψ′ → Λ¯Λη. Moreover, the branching fractions of the J/ψ → Λ¯Λη decay is
measured with a drastically improved precision. Its central value is lower than the BESII mea-surement by about 1.5σ. The branching ratios of J/ψ → Λ¯Λπ0 and ψ′ → Λ¯Λη are consistent
with previous upper limits, and the upper limit ofψ′ → Λ¯Λπ0 is significantly more stringent than
the BESII measurement. The isospin-violating decay modes,J/ψ → Λ¯Λπ0andψ′ → Λ¯Λπ0, are
suppressed relative to the corresponding isospin-conserving decay modes intoΛ¯Λη, albeit only by a factor of 4 in the case of theJ/ψ decay. In addition, we search for the isospin violating decays ofJ/ψ → Σ(1385)0Λ + c.c. and no significant signal is observed.¯
TABLE III:A comparison of the branching fractions of this work with the results of previous experiments (×10−5).
The first error is statistical and the second one indicates the systematical uncertainty.
Experiments B(J/ψ → Λ¯Λπ0 ) B(J/ψ → Λ¯Λη) B(ψ′→ Λ¯Λπ0 ) B(ψ′→ Λ¯Λη) This experiment3.78 ± 0.27 ± 0.29 15.7 ± 0.79 ± 1.52 < 0.29 2.47 ± 0.34 ± 0.19 BESII [3] < 6.4 26.2 ± 6.0 ± 4.4 < 4.9 < 12 BESI [2] 23.0 ± 7.0 ± 8.0 DM2 [1] 22.0 ± 5.0 ± 5.0 IX. ACKNOWLEDGMENT
The BESIII collaboration thanks the staff of BEPCII and the computing center for their hard efforts. This work is supported in part by the Ministry of Science and Technology of China un-der Contract No. 2009CB825200; National Natural Science Foundation of China (NSFC) unun-der
Contracts Nos. 10625524, 10821063, 10825524, 10835001, 10935007, 11125525, 10975143, 11079027, 11079023; Joint Funds of the National Natural Science Foundation of China under Contracts Nos. 11079008, 11179007; the Chinese Academy of Sciences (CAS) Large-Scale Sci-entific Facility Program; CAS under Contracts Nos. KJCX2-YW-N29, KJCX2-YW-N45; 100 Talents Program of CAS; Istituto Nazionale di Fisica Nucleare, Italy; Ministry of Development of Turkey under Contract No. DPT2006K-120470; U. S. Department of Energy under Contracts Nos. DE-FG02-04ER41291, DE-FG02-91ER40682, DE-FG02-94ER40823; U.S. National Sci-ence Foundation; University of Groningen (RuG) and the Helmholtzzentrum fuer Schwerionen-forschung GmbH (GSI), Darmstadt; WCU Program of National Research Foundation of Korea under Contract No. R32-2008-000-10155-0.
[1] P. Henrard et al. (DM2 Collaboration), Nucl. Phys. B 292, 670 (1987). [2] J. Z. Bai et al. (BES Collaboration), Phys. Lett. B 424, 213 (1998). [3] M. Ablikim et al. (BES Collaboration), Phys. Rev. D 76, 092003 (2007). [4] M. Ablikim et al. (BESIII Collaboration), Chinese Physics C 36, 915 (2012). [5] M. Ablikim et al. (BESIII Collaboration), arXiv:1209.6199.
[6] W. S. Hou and A. Soni, Phys. Rev. Lett. 50, 569 (1983); G. Karl and W. Roberts, Phys. Lett. B 144, 243 (1984); S. J. Brodsky, G. P. Lepage and S. F. Tuan, Phys. Rev. Lett. 59, 621 (1987); M. Chaichian
et al., Nucl. Phys. B 323, 75 (1989); S. S. Pinsky, Phys. Lett. B 236, 479 (1990).
[7] M. Ablikim et al. (BESIII Collaboration), Nucl. Instrum. Methods Phys. Res., Sect. A 614, 345 (2010). [8] S. Agostinelli et al. (GEANT4 Collaboration), Nucl. Instrum. Meth. A 506, 250 (2003).
[9] J. Allison et al., IEEE Trans. Nucl. Sci. 53, 270 (2006).
[10] S. Jadach, B. F. L. Ward and Z. Was, Comp. Phys. Commu. 130, 260 (2000); S. Jadach, B. F. L. Ward and Z. Was, Phys. Rev. D 63, 113009 (2001).
[11] D. J. Lange, Nucl. Instrum. Meth. A 462, 152 (2001).
[12] K. Nakamura et al. (Particle Data Group Collaboration), J. Phys. G 37, 075021 (2010). [13] R. Ping et al., Chinese Physics C 32, 599 (2008).
[14] M. Xu et al., Chinese Physics C 33, 428 (2009). [15] Y. S. Zhu et al., Chinese Physics C 32, 363 (2008).
[16] M. Ablikim et al. (BESIII Collaboration), Phys. Rev. D 83, 112005 (2011).