The prices of oil and agricultural commodities have significance for almost all economies. Commodity markets came into prominence after the deep boom-bust cycle in commodity and oil prices resulting from the great global recession that began at the end of 2007. Several studies have assessed the interrela-tionship between the oil and commodity prices and some authors have concluded that the relationship is strong while others stated that it is weak (Baffes 2007; Baffes and Haniotis 2010; Pindyck and Rotemberg 1990; Plourde and Watkins 1998). In line with the previous studies, this paper looks at the strength of the relationship.
The link between oil prices and the prices of other commodities has been examined by considering sev-eral spillover channels. Many researchers have inves-tigated the effects of oil prices on the real economic activity by analyzing several different transmission mechanisms, such as the fiscal and monetary policy channels, which tend to affect the economic growth and welfare (Kilian 2008; Hamilton 2009). Like an oil price spike, a sharp increase in agricultural commodity prices adversely affects economic conditions.1 Some authors, such as Ivanic and Martin (2008), McCalla
(2009), and von Braun and Torero (2009), have argued that in many low-income countries, an abrupt rise in food prices could increase the pervasive poverty, which would create the economic and political in-stability. In such a crisis, depending on the extent of the increase in food prices, these populations may experience irreversible malnutrition in the long run, and depending on the extent of the increase in agri-cultural commodity prices, the farmers’ production and marketing costs may significantly increase, and thus, poor net-importing countries may face harsh challenges.
The main objective of this paper is to analyze the interrelationship between these two important de-cisive factors of the real economic activity: the oil and agricultural commodity prices. Both oil and agricultural commodity prices has chiefly gained prominence in advanced and emerging countries, and there are two main explanations for the causal link between the oil prices and agricultural commodity prices (Headey and Fan 2008). The mechanisms of macroeconomic performance and commodity price booms can be shaped by fundamental factors, such as supply shocks (e.g., hoarding and export restrictions),
The linkage between oil and agricultural commodity
prices in the light of the perceived global risk
Giray GOZGOR
1, Baris KABLAMACI
21
1Department of Department of Economics and Finance, Dogus University, Istanbul, Turkey Economics and Finance, Dogus University, Istanbul, Turkey 2
2DepartmentDepartment of Economics, Istanbul University, Istanbul, Turkey of Economics, Istanbul University, Istanbul, Turkey
Abstract: Th e paper examines a systematic interrelationship between the world oil and agricultural commodity prices, taking the role of the USD and the perceived global market risks into consideration for the period from January 1990 to June 2013. Th e authors initially determine the signifi cant cross-sectional dependence in a large balanced panel framework for 27 commodity prices, and then apply the second generation panel unit root (PUR) tests. Findings from the PUR tests clearly suggest that there is a strong unit root in agricultural commodity prices. In addition, the empirical fi ndings from the fi xed eff ects panel data, panel co-integration analysis, the Panel-Wald Causality tests, and the common correlated eff ects mean group estimations strongly show that the world oil price and the weak USD have positive impacts on almost all agri-cultural commodity prices. Th ere are also retained the adjuvant eff ects of the escalatory perceived global market risk upon most agricultural commodity prices.
Key words: oil prices, panel data estimations, the VIX
1The causality of prices affecting economic conditions – one must keep in mind that the cause and effect is never in one direction and mainly depends on a specific context.
weather shocks, productivity slowdowns, stock de-clines and demand movements (e.g., growth in demand from China, India, and other emerging countries and biofuel demand). However, non-fundamental factors, such as the monetary policy stances and futures mar-kets, which are the determinants of low interest rates, the depreciation of the USD, and financial market speculations, also affect the pricing mechanisms of an economy. Along with these drivers and factors, the regulatory policy changes, such as the passage of the Renewable Fuel Standard of the Energy Policy Act of 2005 in the US, have played an important role in the increase of the US ethanol production, which has resulted in a stronger relationship between the oil and agricultural commodity prices and both the production and demand for biofuels (Zhang et al. 2010). However, there is no consensus of the effect of such policy changes but simply such policy measures create an even more complex market situation.
This paper provides a distinct insight into the examination of the interrelationship between the oil and agricultural commodity prices in the light of the risk perceptions and uncertainty that shape the global financial market. Indeed, Shewhart (1931) distinguishes between the common and special causes. He identifies the common causes as the general phenomena continuously active within the system with a predictable variation. Special causes indicate a new, unexpected, and unpredictable variation within the system, a surprise to its fullest meaning. Thus, a distinction is made between uncertainty and risk. Special causes are also known as the Knightian un-certainty and more recently popularized by Taleb as the Black Swan Theory (Taleb 2010). However, when speaking of risk perceptions, we complicate the things further, since perceptions are the subjective idea of the two by the market participants – affect-ing their decisions, which in turn affect the markets. We therefore take into account the indicators of the perceived global risk and global market conditions, namely, the Volatility (VIX) index in a panel data estimation framework. The VIX is the weighted blend of prices for a range of options on the Standard and Poor’s (S&P) 500 index – 30 days period and it indicates the expected movement in the S&P 500 index over the next 30-day period. The VIX index is an important proxy for the standard deviation of the S&P 500 returns, where the standard deviation denotes the average spread of the distribution of re-turns around its mean. For instance, Hartelius et al. (2008) suggested that the VIX index is a benchmark proxy for the behaviour of investors in the light of
risk and that the index is a strong indicator of the global market conditions. Similarly, Sari et al. (2011) used the VIX index to measure the perception of the global market risk and showed that these percep-tions had a notable suppressing effect on oil prices. Overall, we suggest that the global risk perceptions can significantly affect the relationship between the oil and agricultural commodity prices.
In addition, we add the real value of the USD to our empirical models to get more satisfactory results on the relationship between the prices of oil and agricultural commodities. Indeed, a weak USD, the depreciation of the USD against major currencies, leads to higher commodity prices through increas-ing foreign demand and purchasincreas-ing power (He et al. 2010). Recent studies also indicate the role of a weak dollar on the commodity price inflation that leads to increase the commodity prices (Akram 2009; Harri et al. 2009).
The main contributions of this paper to the exist-ing literature are as follows: First, to the best of our knowledge, this is the first study that uses a second generation panel unit root (henceforth PUR) test by assuming the cross-sectional dependence of panel units, namely, agricultural commodity prices, and that uses a common correlated effects mean group panel data estimation technique with a large panel framework for agricultural commodity prices. The panel data estimation methods have generally a greater statistical power than the time series techniques, due to they include information for both time period and cross-sectional dimension (Nazlioglu and Soytas 2012). Second, we systematically take into account the impact of not only the USD but also the VIX index on the relationship between the world oil and agricul-tural commodity prices. Third, we firstly use a large balanced panel data framework for 27 agricultural commodity prices over a relatively long time period. This is the first paper that to examine direct effects of the VIX on the agricultural commodity prices in such a large balanced panel data framework. In this paper we find that the world oil price and the weak USD have positive impacts on almost all agricultural commodity prices. We also retain the adjuvant effects of the escalatory perceived global market risks upon most agricultural commodity prices.
LITERATURE REVIEW
A growing number of papers in recent years have examined the interrelationship between the oil prices
and agricultural commodity prices. For instance, Ai et al. (2006) suggested that the supply side factors affect the price co-movements of wheat, barley, corn, oats, and soybeans. Campiche et al. (2007) stated that although there was no co-integration relationship between the crude oil prices and the prices of corn, sorghum, sugar, soybeans, soybean oil, and palm oil for the period from 2003 to 2005, corn and soybean prices were co-integrated with the crude oil prices for the period from 2006 to 2007. Natanelov et al. (2011) presented evidence that during the period from 1993 to 2001, the prices of cocoa, soybeans, soybean oil, wheat, corn and gold were co-integrated with the crude oil futures prices. However, they observed that during the period from 2002 to 2010; only the prices of coffee, cocoa, wheat and gold were co-integrated with the crude oil prices. These studies observe that the relationship between agricultural commodity and oil prices is time-specific.
Harri et al. (2009) found that corn; cotton, and soybean prices were linked to the oil prices, while the price of wheat was not. The authors also argued that the exchange rates are an important factor in the relations among commodity prices over time. Gohin and Chantret (2010) presented evidence that the prices of energy and the prices of food could run in opposite directions when the real income effect is taken into account. Nazlioglu and Soytas (2012) provided strong evidence of the impact of the world oil price changes on most agricultural commodity prices and a positive impact of a weak US Dollar on most agricultural commodity prices. These studies observe the significant relationship between the agricultural commodity and oil prices.
On the other hand, Baffes (2007), Chen et al. (2010), and Ji and Fan (2012) showed that the impact of the crude oil market on other commodity markets was significant when the crude oil prices were at higher levels. Using Granger-causality methods, Nazlioglu (2011) found that the oil and agricultural commodity prices did not cause each other using linear methods but that nonlinear linkages between these commod-ity prices exist. In short the relationship between agricultural commodity and oil prices depend on the specific methodology or the specific market condition.
Some papers investigate the role of speculation and uncertainty on the oil and agricultural commodity prices nexus. For instance, Gilbert (2010) argued that the index-based investment in the agricultural futures markets was the main cause (including macroeco-nomic factors) of the recent food price increases. The streaming of speculative capital into the agricultural
commodity markets has resulted in the notable im-portance of the price increases occurring between May 2007 and May 2008, which was demonstrated by von Braun and Torero (2009). Nevertheless, Sanders and Irwin (2010) examined the cross-market correla-tion between market returns and the posicorrela-tions held by the long-only index funds for twelve commodity futures markets and showed that the impact of the index fund positions on returns across markets was limited. Capelle-Blancard and Coulibaly (2011) showed the causality between the index investor positions and commodity prices on twelve grain, livestock, and other soft commodity markets through a Panel-Granger causality analysis. Their research indicated that there was no evidence of a causality relationship between the index funds and futures prices in the agricultural futures markets. Byrne et al. (2011) found a negative relationship between the real commodity prices and the real interest rates and that risk is cap-tured by a measure of the stock market uncertainty. On the other hand, He et al. (2010) found that the real futures prices of crude oil were co-integrated with the Kilian economic index, which was used as an indicator of the global economic activity. These researchers also indicated that the trade weighted US Dollar index and the crude oil prices were influ-enced significantly by the fluctuations of the Kilian economic index during both long-run equilibrium conditions and short-run impacts.
Finally, Zhang et al. (2010) showed that there was no direct relation between fuel prices and the agri-cultural commodity prices in the long run. Using the copulas framework, Reboredo (2012) showed that the agricultural commodity price movements were not driven by oil price fluctuations.
DATA AND METHODOLOGY Data
This paper examines a systematic relationship between the world oil price and the agricultural commodity prices. This paper also considers the role of the USD exchange rate and the perceived global market risks over the period from January 1990 to June 2013. This paper is based on a large balanced panel data framework that includes the prices of the 27 agricultural commodities. The frequency of the data used in our study is monthly. This paper focuses on the monthly data, as due to such a large number of commodity prices data are only available at the
monthly frequency. We select the starting date of the sample based on the availability of the VIX index of the Chicago Board Options Exchange (CBOE). We also report the descriptive summary statistics and the descriptions of all related variables in Table 1.
We obtain all data on commodity prices and the world oil prices from the database of the International Financial Statistics (IFS) for commodity prices. To measure the effect of the exchange rate, following
Harri et al. (2009), He et al. (2010) and Nazlioglu and Soytas (2012), we use the real effective exchange rate (REER) for the USD. We obtain the REER data from the principal global indicators of the IFS. A depre-ciation in the USD would cause soaring commodity prices by a channel in rising purchasing power and foreign demand, and thus the effects of the USD on agricultural commodity prices is expected to be nega-tive. Furthermore, following Nazlioglu and Soytas
Table 1. The descriptive summary statistics and the description of variables
Variables Description Unit Average Std. Dev. Skewness Kurtosis
Wheat The United States (the US Golf Ports) USD/t 4.73 0.34 0.72 2.78
Maize The United States (the US Golf Ports) USD/t 4.88 0.38 1.06 2.98
Sorghum The United States (the US Golf Ports) USD/t 4.86 0.35 1.07 3.01
Rice Thailand USD/t 4.48 0.38 0.61 2.62
Barley Canada (Winnepeg) USD/t 4.74 0.37 0.77 2.51
Soybeans United States (Rotterdam) USD/t 4.76 0.35 0.80 2.55
Soybean meal The United States (the US Golf Ports) USD/t 4.74 0.32 0.75 2.56
Soybean oil All Origin (Dutch Ports) USD/t 4.77 0.37 0.65 2.54
Palm oil Malaysia (Rotterdam) USD/t 4.83 0.45 0.31 2.30
Palm kernel oil Malaysia (Rotterdam) USD/t 4.57 0.36 -0.17 2.54
Fishmeal Any Origin (Hamburg) USD/t 4.60 0.46 0.55 2.15
Sunflower oil European Union (European Ports) USD/t 4.16 0.42 0.70 2.79
Olive oil The United Kingdom USD/t 4.19 0.24 0.52 2.22
Groundnuts
(peanuts) oil Any Origin (Europe) USD/t 4.60 0.37 0.69 2.87
Groundnuts Nigeria USD/t 4.82 0.32 1.02 3.04
Linseed oil Any Origin (World) USD/t 4.15 0.43 0.38 2.11
Beef Australia (the US Ports) US cents/ pound 4.53 0.25 0.60 2.81
Lamb New Zealand (London) US cents/pound 4.41 0.17 -0.27 2.18
Pork The United States US cents/pound 4.56 0.26 -0.30 4.58
Poultry United States (Georgia) US cents/pound 4.49 0.20 0.15 2.04
Sugar Brazil (Free Market) US cents/pound 4.70 0.40 0.42 2.68
Bananas Latin America (the US Ports) USD/t 4.58 0.34 0.06 2.06
Oranges France USD/t 4.26 0.37 0.05 2.02
Copra The Philippines USD/t 4.62 0.43 0.38 3.30
Coffee Brazil (New York) US cents/pound 4.56 0.44 0.02 2.37
Tea Average Auction (The UK) USD/kg 4.64 0.23 0.56 2.34
Tobacco United States (All Markets) USD/kg 4.75 0.17 0.51 2.09
Petroleum
(crude oil) Real World Oil Price USD/barrel 4.13 0.69 0.42 1.77
Exchange Rate Real Effective Exchange Rate CPI based USD 4.58 0.07 0.49 2.43
Volatility Index S&P 500 VIX Index of the CBOE Level (Monthly) 2.94 0.34 0.46 2.92
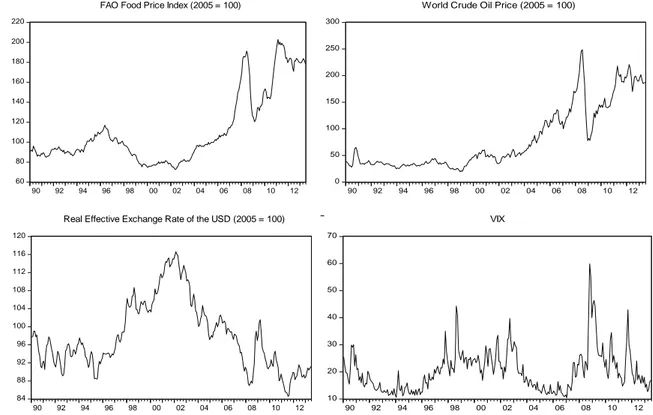
(2012), we study with real values and to avoid the data inconsistency in commodity prices in different units, our data are based on the price indices (2005 = 100) those are obtained from the IFS. We present the related data in the Figure 1. We use the Food ad Agriculture Organization (FAO) food price index (2005 = 100) in Figure 1.
Following von Braun and Torero (2009), Byrne et al. (2011) and Sari et al. (2011), we also consider the impact of the perceived global risk on the world oil price and agricultural commodity prices. For this purpose, following Sari et al. (2011), we use a benchmark indicator, namely, the S&P 500 VIX index of the CBOE. We obtain the data of the VIX from the database of the CBOE, and use the monthly original data.
Empirical model
Following Zhang et al. (2010) and Nazlioglu and Soytas (2012), among many others, we convert the dependent and explanatory variables into the loga-rithmic form in the models. We use a lagged world oil price in the first framework estimations where agricultural commodity prices are the dependent variable because there will be a lag between the time
that the world oil price changes and the time at which the world oil price affects agricultural commodity prices, generally by increasing agricultural commod-ity prices when the world oil price rises. We write down our empirical model in the following equation: lnCOMMOi,t = a0 + a1lnOILi,t–1 – a2lnREERi,t + a3lnVIXi,t +v1i + v1t + ε1i,1t (1)
For this equation, lnCOMMOi,t is the price of the commodity i at time t in logarithmic form, lnOILi,t–1 is the lagged oil price in logarithmic form for cross
i at time t–1, lnREERi,t is the real effective exchange rates of the USD in the logarithmic form for cross i at time t, lnVIXi,t is the VIX index in logarithmic form for cross i at time t, v1i and v1t are cross-section and period effects, and ε1i,1t is an error term.
Econometric methodology
This paper initially applies the second generation PUR tests to evaluate the possible persistence in a panel framework of agricultural commodity prices. To the best of our knowledge, this is the first study that uses the second generation PUR tests in a large panel framework of agricultural commodity prices.
60 80 100 120 140 160 180 200 220 90 92 94 96 98 00 02 04 06 08 10 12
FAO Food Price Index (2005 = 100)
0 50 100 150 200 250 300 90 92 94 96 98 00 02 04 06 08 10 12
World Crude Oil Price (2005 = 100)
84 88 92 96 100 104 108 112 116 120 90 92 94 96 98 00 02 04 06 08 10 12
Real Effective Exchange Rate of the USD (2005 = 100)
10 20 30 40 50 60 70 90 92 94 96 98 00 02 04 06 08 10 12 VIX
This issue is notably important in overcoming the shortfalls of the first generation PUR tests that as-sume a cross-sectional independence by default. For this purpose, we test the cross-sectional dependence of 27 agricultural commodity prices for the period from January 1990 to June 2013 by using the cross-sectional dependence (CD) test of Pesaran (2004). Following the results from the CD test of Pesaran (2004), we apply the second generation PUR tests to account for the cross-sectional dependence, us-ing the methodology proposed by Pesaran (2007). The results from these PUR tests suggest that there is a strong unit root in the trends of agricultural commodity prices. In the light of this finding, we employ a panel co-integration analysis and panel data estimation techniques. Therefore, we focus on the long-run impacts of the world oil price, the exchange rate, and the indicator of the perceived global risk (the VIX index) on agricultural commodity prices using a panel data estimation framework.
Following the results from PUR tests, we use the panel co-integration test to determine whether the long-run relationships exist between the agricultural commodity and oil prices. We apply the relatively recent panel co-integration test of Westerlund (2007) that allows for multiple structural shifts in series and takes the cross-sectional dependence among panel units into account. Furthermore, following the results of the panel data estimations, we check the robustness of our findings by using the panel-Wald Granger causality tests. Following their promoter findings to the model in Equation (1), we proceed to investigate the validity of our findings from the panel data estimations for each commodity in the long run. For this purpose, we employ the common
correlated effects mean group (CCEMG) estimation technique of Pesaran (2006) to estimate the related parameters in equation (1) for each panel unit. To the best of our knowledge, this paper is the first that uses the CCEMG estimation technique to examine the relationship between the oil price and agricultural commodity prices.
The CCEMG estimation technique allows for the heterogeneous slope coefficients across panel units. This method can successfully eliminate the time-variant, unobservable and heterogeneous im-pacts across the panel units as well as the problems of identification related to correlation across the cross-sectionaly dependent panel units. The CCEMG technique is also robust despite the presence of a limited number of “strong” factors and an infinite number of “weak” factors, where the latter factors can be related to “local market spillover effects” but the former factors indicate ‘global shocks’ (Pesaran and Tosetti 2011). Furthermore, both factors may be non-stationary (Kapetanios et al. 2011). Therefore, we initially determine the homogeneity of the long-run parameters by using the Hausman test, and then run the estimation technique of Pesaran (2006). We report and discuss all empirical findings from these estimation techniques in the next section, which details our empirical findings.
EMPIRICAL FINDINGS
This section initially reports the findings of the CD test of Pesaran (2004), as shown in Table 2.
As shown in Table 2, the CD test strongly rejects the null hypothesis of the cross-sectional independence. Table 2. Results of the CD test of Pesaran (2004) in agricultural commodity prices (in the logarithmic form)
Cross-sectional dependence Commodity prices (ln)
Pesaran (2004) CD-stat and probability 32.17 (0.000)
Average absolute value of the off-diagonal elements 0.123
Notes: The CD test is defined under the null hypothesis of cross-sectional independence in agricultural commodity prices; P-value is in parenthesis.
Table 3. Results of the cross-sectional dependence PUR tests for agricultural commodity prices (in the logarith-mic form)
Heterogeneous unit root the CIPS (Pesaran 2007) Constant Constant and trend
Zt-bar Statistic –0.847 (0.1723) –0.645 (0.234)
Notes: The CIPS test is defined under null hypothesis of the no n-stationary agricultural commodity prices. The CIPS test assumes cross-sectional dependence that in form of a single unobserved common factor. The optimal number of lag is selected by the Akaike Information Criterion (AIC) . P-values are in parentheses.
Accordingly, following the results from the CD test of Pesaran (2004), we apply the second generation PUR tests accounting for the cross-sectional dependence, such as the PUR test proposed by Pesaran (2007) and report the results in Table 3.
As shown in Table 3, the results from the PUR tests of Pesaran (2007) do not reject the null hypothesis on the non-stationary agricultural commodity prices. In other words, the results from both of the PUR tests suggest that there is a strong unit root in 27 agricultural commodity prices. In the light of these findings, we focus only on the effects of the lagged world oil price, the real effective USD exchange rate, and the VIX index on the agricultural commodity prices that are modelled in Equation (1). The related findings are reported in Table 4.
The results of the robust Hausman test in Table 4 suggest that the fixed effects estimation in column (1) is consistent. The empirical findings in Table 4 show that a 1% increase in the lagged world oil price tends to raise current agricultural commodity prices
by 0.24%. Notably, the coefficient that indicates the spillover from the oil markets to the agricultural commodity markets was 0.17 in Baffes (2007).
Moreover, a 1% increase in the REER negatively affects agricultural commodity prices by 1.54%. We also find a soaring effect of the VIX on the agricul-tural commodity prices. The coefficient of the VIX is 0.11, which is significant at a 1% statistical level. Thus, the perceived global market risk perceptions are influential on the prices of agricultural commodi-ties. In addition, we report the panel co-integration test of Westerlund (2007) to investigate the long-run relationship between the agricultural commodity and oil prices in Table 5.
The results of the robust probability values for four test statistics (Gt, Ga, Pt and Pa) of the panel co-integration test in Westerlund (2007) in Table 5 show that there is a significant co-integration (long-run relationship) between the agricultural commodity and oil prices. Furthermore, we check the robustness of our findings using the panel data estimations in Table 4. For this purpose, we report the findings from the panel-Wald causality tests in Table 6.
The empirical findings in Table 6 show that there is a unidirectional causality relationship that runs from the world oil price to the agricultural com-modity prices. On the other hand, the VIX index also significantly causes agricultural commodity prices. These findings are in line with the findings from the fixed effects panel data estimations shown in Table 4. In addition, the REER significantly causes the agricultural commodity price. This finding is also consistent with the findings from the fixed effects panel data estimations shown in Table 4, and our main model in Equation (1).
Table 5. Results of the panel co-integration analysis
Westerlund (2007) Value Z-value Robust P-value Gt –4.864 –4.203 (0.000) Ga –15.73 –3.525 (0.000) Pt –12.34 –5.263 (0.000) Pa –20.65 –8.252 (0.000)
Notes: Panel co-integration analysis of Westerlund (2007) has null hypothesis of no co-integration between two ag-ricultural commodity and oil prices. Lag intervals are selected by the AIC.
Table 4. Results of the panel data estimations for agricultural commodity prices (in the logarithmic form)
Regressors (FE) (RE)
Lagged Oil Price (ln) 0.239 (0.004)*** 0.239 (0.004)***
REER (ln) –1.541 (0.042)*** –1.541 (0.041)***
VIX (ln) 0.108 (0.008)*** 0.109 (0.009)***
Observations 7614 7614
R2 (overall) 0.615 0.484
Hausman (robust test) [0.000] –
Notes: Dependent variable is agricultural commodity prices (ln). The constant term is also estimated but is not reported. We report robust standard errors. Standard errors are in parentheses, and p-values are in brackets. *** and ** indicate statistical significance at the 1% and 5% levels, respectively. We report p-values of the robust Haus-man test of Baum et al. (2010) (null hypothesis: random effects estimator is efficient and alternative hypothesis: fixed effects estimator is consistent).
At this point, we also employ the CCEMG estima-tion technique of Pesaran (2006) in order to obtain the related parameters in Equation (1) for the price
of each agricultural commodity. We report the results from the Equation (1) framework by using the VIX index in the CCEMG estimations in Table 7.
Table 6. Results of the Panel-Wald Causality Tests
Short-run causality (to) Commodity prices (ln) Oil price (ln) REER (ln) VIX (ln)
(from) Commodity prices (ln) – 1.57 [0.2095] 0.26 [0.6097] 1.78 [0.1819]
Oil price (ln) 52.3 [0.0000] – 28.1 [0.0000] 4.97 [0.0268]
REER (ln) 19.8 [0.0000] 4.65 [0.0310] – 13.4 [0.0002]
VIX (ln) 14.1 [0.0002] 85.4 [0.0000] 64.8 [0.0000] –
Notes: The number of lag length is one. P-values are in brackets.
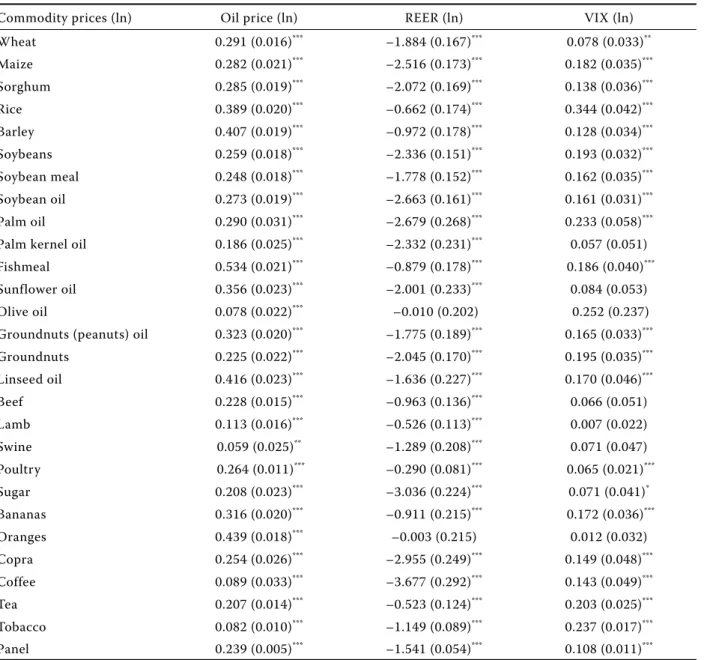
Table 7. Common correlated effects mean group estimation long-run coefficients
Commodity prices (ln) Oil price (ln) REER (ln) VIX (ln)
Wheat 0.291 (0.016)*** –1.884 (0.167)*** 0.078 (0.033)** Maize 0.282 (0.021)*** –2.516 (0.173)*** 0.182 (0.035)*** Sorghum 0.285 (0.019)*** –2.072 (0.169)*** 0.138 (0.036)*** Rice 0.389 (0.020)*** –0.662 (0.174)*** 0.344 (0.042)*** Barley 0.407 (0.019)*** –0.972 (0.178)*** 0.128 (0.034)*** Soybeans 0.259 (0.018)*** –2.336 (0.151)*** 0.193 (0.032)*** Soybean meal 0.248 (0.018)*** –1.778 (0.152)*** 0.162 (0.035)*** Soybean oil 0.273 (0.019)*** –2.663 (0.161)*** 0.161 (0.031)*** Palm oil 0.290 (0.031)*** –2.679 (0.268)*** 0.233 (0.058)***
Palm kernel oil 0.186 (0.025)*** –2.332 (0.231)*** 0.057 (0.051)
Fishmeal 0.534 (0.021)*** –0.879 (0.178)*** 0.186 (0.040)***
Sunflower oil 0.356 (0.023)*** –2.001 (0.233)*** 0.084 (0.053)
Olive oil 0.078 (0.022)*** –0.010 (0.202) 0.252 (0.237)
Groundnuts (peanuts) oil 0.323 (0.020)*** –1.775 (0.189)*** 0.165 (0.033)***
Groundnuts 0.225 (0.022)*** –2.045 (0.170)*** 0.195 (0.035)*** Linseed oil 0.416 (0.023)*** –1.636 (0.227)*** 0.170 (0.046)*** Beef 0.228 (0.015)*** –0.963 (0.136)*** 0.066 (0.051) Lamb 0.113 (0.016)*** –0.526 (0.113)*** 0.007 (0.022) Swine 0.059 (0.025)** –1.289 (0.208)*** 0.071 (0.047) Poultry 0.264 (0.011)*** –0.290 (0.081)*** 0.065 (0.021)*** Sugar 0.208 (0.023)*** –3.036 (0.224)*** 0.071 (0.041)* Bananas 0.316 (0.020)*** –0.911 (0.215)*** 0.172 (0.036)*** Oranges 0.439 (0.018)*** –0.003 (0.215) 0.012 (0.032) Copra 0.254 (0.026)*** –2.955 (0.249)*** 0.149 (0.048)*** Coffee 0.089 (0.033)*** –3.677 (0.292)*** 0.143 (0.049)*** Tea 0.207 (0.014)*** –0.523 (0.124)*** 0.203 (0.025)*** Tobacco 0.082 (0.010)*** –1.149 (0.089)*** 0.237 (0.017)*** Panel 0.239 (0.005)*** –1.541 (0.054)*** 0.108 (0.011)***
Notes: The constant term is also estimated but is not reported. We report robust standard errors. Standard errors are in parentheses, and p-values are in brackets.
Table 7 illustrates the effects of the world oil price on the agricultural commodity prices taking the REER and the VIX index into account. First, our findings are consistent with the findings of Baffes (2007) and Nazlioglu and Soytas (2012) in that an increase in the world oil price has a positive impact on the prices of all agricultural commodities that were examined in this study. Furthermore, the estimated coefficients are inelastic and they differ from 0.06 to 0.53. Second, the results imply that the changes in the real values of the USD have no impact on the prices of olive oil and oranges. However, real changes in the value of the USD negatively affect the remaining commodity prices that were examined in this study, as expected. In addition, the coefficients of the REER are inelastic only for prices of eight commodities: rice, barley, fishmeal, beef, lamb, poultry, bananas, and tea. Third, the increasing VIX index that shows the increasing risks perceived by investors in the global financial markets do not affect the prices of palm kernel oil, sunflower oil, olive oil, beef, lamb, swine, and oranges. We find a positive impact of the VIX index on most of the remaining agricultural commodity prices. The significant coefficients for the VIX index differ from 0.07 to 0.34.
CONCLUDING REMARKS AND IMPLICATIONS
In this paper, we empirically analyze the systematic interrelationship between the world oil price and 27 agricultural commodity prices over the period from January 1990 to June 2013 through a monthly data set. We find a significant cross-sectional dependence and unit root in a large panel data framework for agricultural commodity prices. Using our findings, we determine that there are significant impacts of the USD and the VIX index on the world oil price and the agricultural commodity prices by using the fixed ef-fects panel data, the common correlated efef-fects mean group estimations, the panel co-integration-, and the panel-Wald Causality tests. Our findings strongly in-dicate that a weak USD has positive impacts on 25 of the 27 agricultural commodity prices. We also retain the adjuvant effects of the escalatory perceived global market risks upon 20 of 27 agricultural commodity prices. The soaring world oil price significantly raises all agricultural commodity prices.
In recent years, the relationship between the prices of agricultural commodities and oil prices has been examined by several different methodological
frame-works; however, the examination of the role of the investors’ motivation in the global financial markets on this relationship has remained limited. In this con-text, this paper attempts to link the global financial markets with the agricultural commodity markets by considering the channels of uncertainty such as the global risk perceptions and the role of the US Dollar. Our empirical findings refer the importance of fundamental policies in this relationship. The results show that the oil’s unidirectional positive impact on agricultural commodities is obvious, and given that the crude oil is a key input to the production of agricultural commodities and agriculture is an en-ergy intensive industry. In addition, policy-induced diversions of some commodities to the production of biofuels certainly complicate this relationship. These results of the paper are in line with those of the recent studies, such as Baffes (2007), Mitchell (2008), Zhang et al. (2010) and Byrne et al. (2011), which show that the inputs of the ethanol-biodiesel and biofuel, such as corn, soybean and sugar prices, are positively correlated with the oil prices. A pos-sible rise in the world oil price leads to increases in the prices of agricultural commodities associated with the alternative energy, and thus, the domain of agricultural commodities increases day by day. Moreover, Chen et al. (2010) and Reboredo (2012) argued that the co-movement of the agricultural commodity prices has an important impact on the portfolio diversification and hedging.
On the other hand, food-importing, under-devel-oped and developing countries will be negatively affected by the rise of the agricultural commod-ity prices. Most of these countries would face not only the political and economic instability when the agricultural commodity prices rise, but also the inevitable adverse effects of nutritional deficiency, a reduced capacity to produce nutrient-rich food in suitable conditions, and increased poverty. Following the recent papers of Reboredo (2012) and Ji andFin (2012), we suggest that financial derivatives might be useful tools to decrease the adverse effects of rising or volatile agricultural commodity prices.
In addition, in line with the previous papers by Gohin and Chantret (2010) and Natanelov et al. (2011), we find that speculation or, more generally, investor motivation is one of the main determinants of the agricultural commodity prices. Investors would gener-ally decide to remain in “secure financial positions”; namely, they would invest in “palpable goods”, such as gold, silver, or agricultural commodities, instead of stocks, bonds, or currencies during the periods
global financial markets on the market for agricultural commodities highlights the need for financial regula-tion at an internaregula-tional level, particularly during the periods of global recession or during the post-recession recovery periods, which can also introduce asset price bubbles. The monetary policy stances of developed economies, the global liquidity conditions, and the strength of the USD can also be determinants of the agricultural commodity prices. However, these sub-jects still need to be researched further, particularly concerning the different impacts of the agricultural commodity prices on the least-developed or develop-ing economies at the national level.
In short, we investigate the economic and finan-cial roots of the empirical results and discuss the possible implications in the literature. The main empirical findings in this paper highlight the role of the uncertainty and risks perceptions on the ag-ricultural commodity markets and the results are in line with the recent finance paper of Reboredo (2012). The remaining results are in line with the recent economics papers, such as those by Chen at al. (2010), Ji and Fan (2012) and Nazlioglu and Soytas (2012). Given the length of the available time series, a further research can consider a VAR model for each commodity series and the oil price, where exogenous variables (the VIX and the exchange rates) are considered. Furthermore, this commonly known econometric methodology could be extended to consider a non-linear relationship between the oil and agricultural commodity prices.
REFERENCES
Ai C., Chatrath A., Song F. (2006): On the comovement of commodity prices. American Journal of Agricultural Economics 88: 574-588.
Akram Q.F. ( 2009): Commodity prices, interest rates and the dollar. Energy Economics, 31: 838–851.
Baffes J. (2007): Oil spills on other commodities. Resources Policy, 32: 126–134.
Baffes J., Haniotis T. (2010): Placing the 2006/08 Com-modity Price Boom into Perspective. World Bank Policy Research Working Paper, No. 5371.
Baum C.F., Schaffer M.E., Stillman S. (2010): IVREG29: Stata module for extended instrumental variables/2SLS and GMM estimation (v9). Statistical Software Com-ponents S4254010. Department of Economics, Boston College.
mentals. World Bank Policy Research Working Paper, No. 5578.
Campiche J.L., Br yant H.L., Richardson J.W., Outlaw J.L. (2007): Examining the evolving correspondence between petroleum prices and agricultural commodity prices. In: American Agricultural Economics Associa-tion Annual Meeting, Portland, OR, July 29–August 1, 2007.
Capelle-Blancard G., Coulibaly D. (2011): Index trading and agricultural commodity prices: A panel granger causal-ity analysis. Economie Internationale, 126–127: 51–72. Chen S., Kuo H., Chen C. (2010): Modeling the relationship
between the oil price and global food prices. Applied Energy, 87: 2517–2525.
Gilbert C.L. (2010): How to understand high food prices. Journal of Agricultural Economics, 61: 398–425. Gohin A., Chantret F. (2010): The long-run impact of
en-ergy prices on world agricultural markets: The role of macro-economic linkages. Energy Policy, 38: 333–339. Hamilton J.D. (2009): Understanding crude oil prices.
Energy Journal, 30: 179–206.
Harri A., Nalley L., Hudson D. (2009): The relationship between oil, exchange rates, and commodity prices. Journal of Ag ricultural and Applied Economics, 41: 501–510.
Hartelius K., Kashiwase K., Kodres L. (2008): Emerging Market Spread Compression: Is it Real or is it Liquidity? IMF Working Paper No. 08/10.
He Y., Wang S., Lai K.K. (2010): Global economic activity and crude oil prices: A cointegration analysis. Energy Economics, 32: 868–876.
Headey D., Fan S. (2008): Anatomy of a crisis: The causes and consequences of surging food prices. Agricultural Economics, 39: 375–391.
Ivanic M., Martin W. (2008): Implications of higher global food prices for poverty in low-income countries. Agri-cultural Economics, 36: 405–416.
Ji Q., Fan Y. (2012): How does oil price volatility affect non-energy commodity markets? Applied Energy, 89: 273–280.
Kapetanios G., Pesaran M.H., Yamagata T. (2011): Panels with non-stationary multifactor error structures. Journal of Econometrics, 160: 326–348.
Kilian L. (2008): The economic effects of energy price shocks. Journal of Economic Literature, 46: 871–909. McCalla A.F. (2009): World food prices: Causes and
conse-quences. Canadian Journal of Agricultural Economics,
57: 23–34.
Mitchell D. (2008): A Note on Rising Food Prices. World Bank Policy Research Working Paper Series. No. 4682.
Natanelov V., Alam M.J., McKenzie A.M., Van Huylen-broeck G. (2011): Is there co-movement of agricultural commodities futures prices and crude oil? Energy Policy,
39: 4971–4984.
Nazlioglu S. (2011): World oil and agricultural commodity prices: Evidence from nonlinear causality. Energy Policy,
39: 2935–2943.
Nazlioglu S., Soytas U. (2012): Oil price, agricultural com-modity prices, and the dollar: A panel cointegration and causality analysis. Energy Economics, 34: 1098–1104. Pesaran M.H. (2004): General Diagnostic Tests for Cross
Section Dependence in Panels. IZA Discussion Paper Series, No. 1240.
Pesaran M.H. (2006): Estimation and inference in large heterogeneous panels with a multifactor error structure. Econometrica, 74: 967–1012.
Pesaran M.H. (2007): A simple panel unit root test in the presence of cross-section dependence. Journal of Ap-plied Econometrics, 22: 265–312.
Pesaran M.H., Tosetti E. (2011): Large panels with common factors and spatial correlation. Journal of Econometrics,
161: 182–202.
Pindyck R.S., Rotemberg J.J. (1990): The excess co-move-ment of commodity prices. Economic Journal, 100: 1173–1189.
Plourde A., Watkins G.C. (1998): Crude oil prices between 1985 and 1994: how volatile in relation to other com-modities? Resource and Energy Economics, 20: 245–262.
Reboredo J.C. (2012): Do food and oil prices co-move? Energy Policy, 49: 456–467.
Sanders D.R., Irwin S.C. (2010): A speculative bubble in commodity futures prices? Cross-sectional evidence. Agricultural Economics, 41: 25–32.
Sari R., Soytas U., Hacihasanoglu E. (2011): Do global risk perceptions influence world oil prices? Energy Econom-ics, 33: 515–524.
Shewhart W.A. (1931): Economic Control of Quality of Manufactured Product. Macmillan, New York. Taleb N.N. (2010): The Black Swan: The Impact of the
Highly Improbable Fragility. Random House Digital, Inc., New York.
Von Braun J., Torero M. (2009): Implementing Physical and Virtual Food Reserves to Protect the Poor and Prevent Market Failure. IFPRI Policy Brief 10, Washington DC. Available at http://www.ifpri.org/sites/default/files/ publications/bp010.pdf
Westerlund J. (2007): Testing for error correction in panel data. Oxford Bulletin of Economics and Statistics, 69: 709–748.
Zhang Z., Lohr L., Escalante C., Wetzstein M. (2010): Food versus fuel: What do prices tell us? Energy Policy, 38: 445–451.
Received: 17th December 2013 Accepted: 3rd February 2014
Contact address:
Giray Gozgor, Dogus University, Department of Economics and Finance, Zeamet Street 21, 34722, Kadikoy, Istanbul, Turkey