NEW JERSEY DEPARTMENT OF ENVIRONMENTAL PROTECTION
WELL TEST RESULTS FOR SEPTEMBER 2002 – APRIL 2007
P
Written and prepared by
NJ Department of Environmental Protection
Division of Water Supply / Bureau of Safe Drinking Water And
Division of Science, Research and Technology
Table of Contents
EXECUTIVE SUMMARY... V
BENEFITS OF THE PRIVATE WELL TESTING ACT...X
PART 1: INTRODUCTION ...1
SUMMARY OF THE NEW JERSEY PRIVATE WELL TESTING ACT...2
WHO IS REQUIRED TO TEST AND WHEN? ...3
WHO DOES THE TESTING AND WHAT ARE ACCEPTABLE TEST RESULTS? ...3
HOW DOES THE DATA GET SUBMITTED TO THE NJDEP? ...4
WHAT IF CONTAMINANTS ARE FOUND?...5
LIMITATIONS OF THE DATA...5
PART 2: PRIVATE WELL TESTING ACT TEST RESULTS ...7
DATA FROM THE PRIVATE WELL TESTING ACT PROGRAM...9
PRIMARY CONTAMINANTS...9
1. Bacteriological: Fecal Coliform or Escherichia coli (E. coli)...9
2. Inorganic chemicals ...12
A. Nitrate...12
B. Arsenic ...12
C. Mercury ...16
D. Lead ...18
3. Gross Alpha Particle Activity ...18
4. Volatile Organic Compounds ...19
SECONDARY PARAMETERS...24
WHAT ARE THE DATA TELLING US ABOUT PRIVATE WELLS?...25
LEAD TESTING RESULTS (VARIABILITY IN RESULTS) ...28
PART 3: PRIVATE WELL TESTING ACT EDUCATION AND OUTREACH...31
COMMUNICATION EFFORTS...31
EDUCATIONAL AND OUTREACH NEEDS...31
PART 4: CASE STUDIES ...33
PRIVATE WELL TESTING ACT CASE STUDY #1-EVESHAM TOWNSHIP,BURLINGTON COUNTY...33
PRIVATE WELL TESTING ACT CASE STUDY #2 -BYRAM TOWNSHIP,SUSSEX COUNTY...33
Tables Table E1: List of Private Well Testing Act Program Analytes ... vii
Table 1: List of Private Well Testing Act Analytes... 2
Table 2: Regulated Volatile Organics Compounds, MCLs and Sources ... 22
Figures
Figure E: Wells Sampled and Submitted Data to the PWTA Program ... vi
Figure E1: Statewide Summary of Private Well Testing Act Results For Primary Drinking Water Standards... ix
Figure E2: Percent of Wells with Results that Exceeded the Recommended Upper Limit for Secondary Parameters ... x
Figure 1: Number of Wells Sampled by County... 7
Figure 2: Wells Sampled and Submitted Data to the PWTA Program ... 8
Figure 3: Positive E. Coli/Fecal Coliform Exceedances Reported to the PWTA Program ... 10
Figure 5: Arsenic Exceedances Reported to the PWTA Program ... 15
Figure 6: Mercury Exceedances Reported to the PWTA Program ... 17
Figure 7: Gross Alpha Exceedances Reported to the PWTA Program... 20
Figure 8: VOCs Primary Standards Exceedances Reported to the PWTA Program ... 21
Figure 9: Percent of Wells with Results that Exceeded the Recommended Upper Limit for Secondary Parameters ... 25
Figure 10: Statewide Summary of PWTA Results For Primary Drinking Water Standards.. 27
Figure 11: Southern New Jersey - Summary of Private Well Testing Act Results for Primary Drinking Water Standards... 27
Figure 12: Northern New Jersey - Summary of Private Well Testing Act Results For Primary Drinking Water Standards... 28
Figure 13: Lead in Water Samples ... 30
Appendices Appendix A: Definitions and Terms ... 35
Appendix B: Private Well Testing Act Analytes and Applicable Standards... 39
Appendix C: Private Well Testing Act Required Parameters by County ... 41
Appendix D: New Jersey Private Well Test Reporting Form ... 43
Appendix E: Private Well Testing Act Results by County for Fecal Coliform/E.Coli from September 2002 to April 2007... 53
Appendix F: Private Well Testing Act Results by County for Nitrates from September 2002 to April 2007 ... 55
Appendix G: Private Well Testing Act Results by County for Arsenic from September 2002 to April 2007 ... 57
Appendix H: Private Well Testing Act Results by County for Mercury from September 2002 to April 2007 ... 59
Appendix I: Private Well Testing Act Results by County for Gross Alpha fromSeptember 2002 to April 2007 ... 61
Appendix J: Private Well Testing ActResults by County for VOCs from September 2002 to April 2007... 63
Executive Summary
The goal of the Private Well Testing Act (PWTA or Act) is to ensure that purchasers and lessees of properties served by private potable wells are fully aware of the quality of the drinking water source prior to sale or lease of a home or business.
The New Jersey Private Well Testing Act, as set forth at N.J.S.A. 58:12A-26 et seq., was signed into law in March of 2001 and became effective in September 2002. State lawmakers were prompted to pass the PWTA because of private well contamination discovered throughout the State. To address this concern, the PWTA requires the buyer or the seller of real property to test the well water prior to sale and review the results prior to closing of title. It also requires landlords to test the private well water supplied to their tenants and provide their tenants with a written copy of the results. The data generated by this program are provided to the homeowners by the laboratory performing the analyses and then sent to the New Jersey Department of Environmental Protection (NJDEP), Bureau of Safe Drinking Water. The NJDEP notifies local health agencies when a well within their jurisdiction is tested under the PWTA. The data from the PWTA are used by NJDEP to assess the quality of the water from private wells throughout the state.
The information in this report meets the confidentiality requirements of the Act; the Act allows the release of PWTA information as a compilation of water test results by state, region and county and municipality. The names of specific property owners, their addresses or locations are not included. The report is also required to be made available free of charge to the public.
Summary of Well Test Results for September 2002 – April 2007
This is the second report summarizing the results from the Private Well Testing Act. It follows the release of the initial PWTA report in March 2004, entitled Initial Well Test Results for September 2002 – March 2003. This report provides a summary of the water test results submitted to the NJDEP in the first four and half years of the PWTA Program, over the period of September 2002 to April 2007, and confirms many of the findings identified in the initial report.
A total of 55,749 well water samples were analyzed from 51,028 separate wells during the period of September 2002 to April 2007. The samples results are biased using the highest test result value when more than one sample was collected at the same property. The 51,028 wells sampled represents about 13% of the estimated 400,000
As required by law, the PWTA test results represent untreated (raw) water quality. The samples for the PWTA are collected prior to any water treatment system. In some cases, treatment systems may already be in place to remove or lessen the degree of contamination. The NJDEP’s new database accepts information regarding on site treatment, if applicable. If the homeowner treats the water, the PWTA test results do not reflect the drinking water quality that is being consumed after the water passes through the treatment system. When water sample results exceed drinking water standards, local health departments are notified and further post-treatment samples collected at a kitchen tap are recommended to determine the quality of the water consumed and to evaluate the effectiveness of any treatment system. Results of these follow-up samples taken by the buyer or the seller of a property are not required to be sent to NJDEP.
Contaminants Included in the Private Well Testing Act
The PWTA requires that all wells covered by the Act be tested for the presence of 29 primary drinking water contaminants:1 bacteria, nitrate, lead, and 26 volatile organic chemicals. Certain areas of the state are also required to test for three additional primary drinking water contaminants: arsenic, mercury and gross alpha particle activity. Testing for three secondary parameters (pH, iron and manganese) is also required. See Table E1 for the list of PWTA parameters.
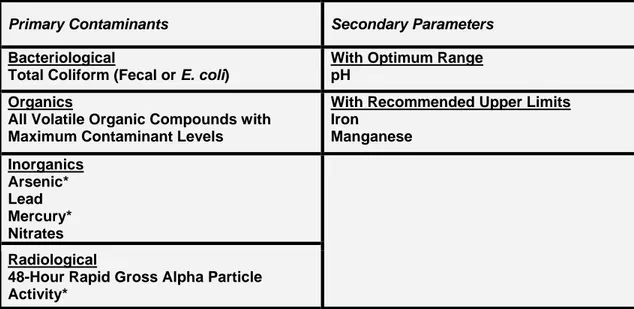
Table E1: List of Private Well Testing Act Program Analytes
P
PrriimmaarryyCCoonnttaammiinnaannttss Secondary Parameters
Bacteriological:
Total Coliform (Fecal or E. coli)
With Optimum Range: pH
Organics:
All 26 Volatile Organic Compounds with Maximum Contaminant Levels
With Recommended Upper Limits: Iron Manganese Inorganics: Arsenic* Lead Mercury* Nitrates Radiological:
48-Hour Rapid Gross Alpha Particle Activity*
A Maximum Contaminant Level (MCL) is the highest level of a contaminant that is allowed in drinking water. Two of the 29 primary contaminants are handled somewhat differently in this report. The first exception is lead, which has an Action Level of 15 ug/L. An Action Level is different than an MCL. Since the majority of lead in drinking water is attributed to leaching from the pipes and distribution system, the action required by the Safe Drinking Water regulations centers on corrosion control and public notice. Since the PWTA program requires testing of untreated water, the State's Ground Water Quality Standard (GWQS) is used as a surrogate in the absence of an MCL established under the Safe Drinking Water Act. An exceedance for lead under the PWTA is thus determined by comparing the well test results to the GWQS. The GWQS for lead was lowered from 10 micrograms per liter (µg/l) to 5 µg/l on November 7, 2005.
The second exception is arsenic. The MCL in effect for arsenic when the PWTA was signed was 50 µg/l. The USEPA adopted a new MCL of 10 µg/l on January 22, 2002 (effective February 22, 2002): however, those public water systems required to comply with the new arsenic standard had until January 23, 2006 to do so. For the purposes of the PWTA, the NJDEP used the newly adopted Federal MCL of 10 ug/l for assessing the PWTA results beginning in September 2002. On January 23, 2006, the same date that compliance with the federal MCL became mandatory for certain public water systems, a new State MCL of 5µg/l became effective. After January 23, 2006, 5 ug/l was the MCL used to determine PWTA compliance. This report evaluates the arsenic test results based on 10 µg/l, and the more recent test results based on 5 µg/l.
Primary Contaminants: Protecting Human Health
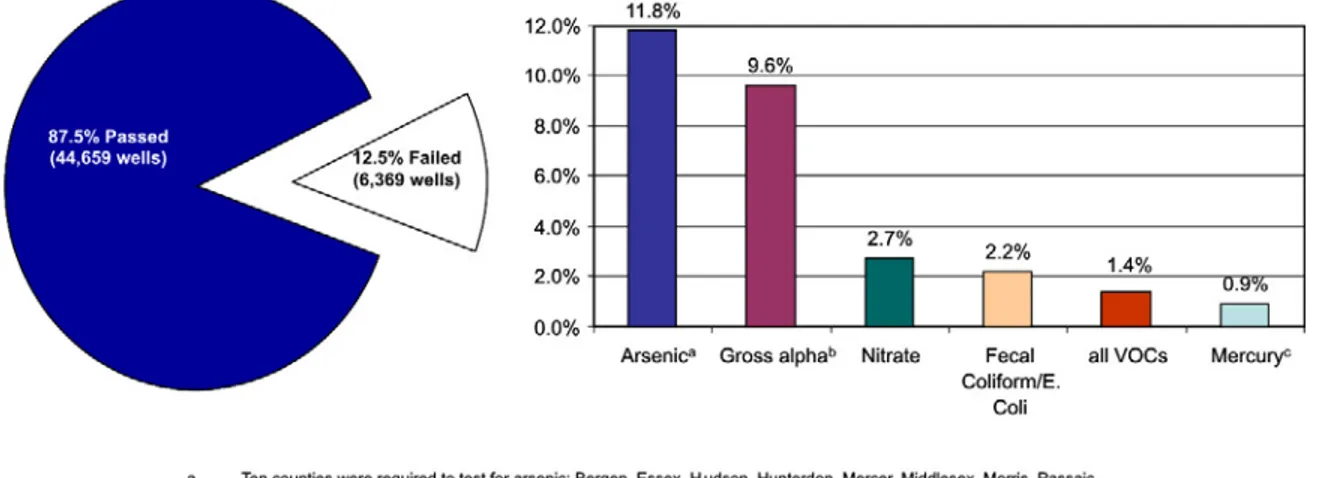
Primary Drinking Water Standards are established for contaminants that have either an immediate or long-term effect on human health. Based on the results of the 51,028 wells tested between September 2002 and April 2007, 88 percent (%) of the wells “passed” (did not exceed) all of the required primary standards for drinking water. Of the 12 % (6,369) wells that exceeded a primary drinking water standards (“failed”), the most common exceedances were for gross alpha particle activity2 (2,209 wells), arsenic3 (1,445 wells), nitrates (1,399 wells), fecal coliform or E. coli (1,136 wells), volatile organic compounds (VOCs) (702 wells), and mercury4 (215 wells). A summary of the primary contaminant test results is presented in Figure E1.
Secondary Parameters: Measuring Natural Water Quality Characteristics
The PWTA requires testing for three naturally occurring secondary drinking water parameters: pH, iron, and manganese. Secondary drinking water parameters are contaminants that cause aesthetic problems such as corrosivity of plumbing fixtures, and taste and odor problems. Secondary parameters also affect the water’s suitability
2
The following counties are required to test for gross alpha: Atlantic, Burlington, Camden, Cape May, Cumberland, Gloucester, Monmouth, Ocean, Salem, Mercer, Hunterdon, and Middlesex
for laundering, plumbing, and showering. MCLs have not been developed for secondary parameters, but instead the NJDEP has adopted “recommended upper limits.” Testing for secondary parameters is used to determine if any treatment is recommended to make the well water aesthetically pleasing to the consumer.
Figure E1: Statewide Summary of Private Well Testing Act Results For Primary Drinking Water Standards
September 2002 – April 2007
(Of 51,028 wells)
A total of 32,530 (64%) of the 51,028 wells tested exceeded one or more of the recommended upper limits for secondary parameters. Due to the nature of soils and geology, the ground water in the southern part of the state tends to be acidic (pH below 7), while ground water in the northern part tends to be neutral (pH = 7) to basic (pH above 7). Of the wells tested, 22,699 wells (45%) had pH values outside the recommended range of 6.5 to 8.5. Both iron and manganese are inorganic ions that occur naturally in soils and rocks throughout the state. A total of 14,751 (29%) wells reported iron levels above the recommended upper limit of 0.3 mg/l, and 9,890 wells (19%) were above the recommended upper limit of 0.05 mg/l for manganese. (See Figure E2).
Figure E2: Percent of Wells with Results that Exceeded the Recommended Upper Limit for Secondary Parameters
(Of 51,028 wells)
Benefits of the Private Well Testing Act
As a result of the Private Well Testing Act, buyers and sellers of real property whose potable water source is a well that is subject to the PWTA, obtain information regarding the quality of the supplied drinking water and how their untreated water quality compares to the state and federal standards for the parameters required to be analyzed under the PWTA rules. The data that are collected in accordance with the PWTA provides valuable information concerning the ground water quality. These test results allow both parties to make informed decisions as to the potability of the untreated water. Information about financial assistance to pay for treatment of groundwater contamination is also provided with each test result.
Similarly, landlords of real property where the source of potable water is a well that is subject to the Act are also required to test the drinking water being supplied to their tenants, and to share this information with the tenants accordingly. As a result of the PWTA, certain private well owners are now provided with pertinent information
Percent of Wells Exceeding Secondary Standards 0 5 10 15 20 25 30 35 40 45 50 Iron Manganese pH P E R C E N T
The PWTA test result information that is submitted to the NJDEP provides not only the NJDEP, but county and local health agencies, and other groups with an understanding of groundwater quality throughout New Jersey since the sample results submitted are of untreated water. For example, the Monmouth County Health Department has used PWTA data for tracking volatile organic compound (VOC) plumes in groundwater in Monmouth County, and the United States Geological Survey (USGS) is planning to use PWTA data to study nitrate contamination in the Highlands region of New Jersey.
Some results have confirmed expectations about ground water quality; in those counties requiring arsenic testing, the results have shown that arsenic is detected in the Piedmont region of New Jersey at a greater frequency than other areas of the State that are required to test for arsenic. Other results are leading us to a better understanding of ground water quality; the fecal coliform results have shown that the wells in the bedrock aquifers of New Jersey are more likely to have fecal coliform contamination than wells in the Coastal Plain. These analyses can be used by the NJDEP to further refine the PWTA analytical requirements throughout the State so that those wells located in specific geological formations are testing for the appropriate parameters.
Part 1: Introduction
On March 23, 2001, the Private Well Testing Act (PWTA or Act), as set forth by N.J.S.A. C.58:12A-26 et seq., was signed into law. A copy of the Act is available online at
http://www.njleg.state.nj.us/2000/Bills/PL01/40_.htm. The Act and its associated
regulations require that buyers and sellers, and landlords and tenants, whose potable water supply is provided by a private well, share information about the quality of that water. Private wells of properties either being sold or leased must be tested for a specific list of parameters in accordance with the Private Well Testing Act Regulations at N.J.A.C. 7:9E et seq.5 The Act made the exchange of information regarding the quality of the ground water and its untreated potability mandatory, similar to other required information obtained during the purchase of a house, such as a termite inspection and a building inspection. This water quality information is required to be shared with the New Jersey Department of Environmental Protection (NJDEP) to enhance the understanding of statewide groundwater quality. Whenever a contaminant is found to exceed the drinking water standard, the NJDEP is required to notify the county or local health department. The county or local health agency may then notify neighboring homes and businesses that may be affected without disclosing the location of the particular well test failure.
This report summarizes the analytical results from over 51,028 private wells tested between September 2002 and April 2007 under the Private Well Testing Act. This report is a follow-up to the NJDEP’s report entitled Initial Well Test Results for September 2002 - March 2003 that was released in March 2004.
A total of 55,749 samples were submitted to the state’s PWTA database during the period of September 2002 through April 2007 from a total of 51,028 wells throughout the state. If a well was sampled more than once, the highest PWTA parameter result value was used in this analysis. The results found in this report confirm many of the findings that were presented in the initial PWTA Report of March 2004. Data associated with gross alpha particle activity are included and evaluated in this report for the first time. Gross alpha particle activity data was not included in the initial PWTA report because this testing requirement was initiated and phased in beginning in March 2003, the cut-off date for the initial report.6 The phase-in occurred initially in those counties where gross alpha particle activity in groundwater was suspected to be the greatest.
This report includes a Definition and Terms Section (Appendix A) providing many commonly used terms that relate to the PWTA program. In addition, further information about the PWTA program can be found at the PWTA webpage at http://www.nj.gov/dep/pwta. For information regarding common treatments available to homeowners having well contamination above a Maximum Contaminant Level, Action
Level or Recommended Limit please see Appendix D or visit our website at www.state.nj.us/dep/pwta for links to other appropriate websites, such as National Sanitation Foundation www.nsf.org or USEPA’s drinking water website www.epa.gov/safewater. You may also call the USEPA Drinking Water Hotline at (800) 426-4791 to obtain a copy of USEPA's pamphlet entitled "Home Water Treatment Units" (WH-550A).
Summary of the New Jersey Private Well Testing Act
The Private Well Testing Act requires that private well(s) on properties involved in certain real estate transactions to be tested for a specific list of drinking water parameters (see Table 1). Some parts of the Act became effective immediately, but the testing requirements did not become effective until September 14, 2002 to allow the NJDEP time to promulgate regulations that provided details for the implementation of the Act. Beginning September 14, 2002, certain contracts of sale involving real properties with private wells, and some public wells, were required to have the well water tested before going forward with the real estate closing. The buyer and seller are notified of the test results prior to the closing and both must attest to the fact that the test results have been reviewed. The well water must be tested by a laboratory certified for the parameters listed in the Act and for the supplementary parameters in N.J.A.C. 7:9E et seq. Once the sample analysis is completed, a copy of the test results must be given to the person who requested the test on a standardized form and must be submitted electronically to NJDEP. Specific information about individual water tests, such as results, address or other location information is confidential as mandated by the Act.
Table 1: List of Private Well Testing Act Analytes
Primary Contaminants Secondary Parameters
Bacteriological
Total Coliform (Fecal or E. coli)
With Optimum Range pH
Organics
All Volatile Organic Compounds with Maximum Contaminant Levels
With Recommended Upper Limits Iron Manganese Inorganics Arsenic* Lead Mercury*
Who is required to test and when?
Real estate transactions subject to the PWTA are those which involve real property where: 1) the potable water supply at that property is from a private well; or 2) property (such as commercial property) where the water supply is a well that has less than 15 service connections or that does not regularly serve an average of 25 people daily at least 60 days out of the year. What this means is that certain public water systems, called noncommunity water systems, meet the applicability criteria defined in the PWTA and must also test. The Act mandates that the sale may not occur until testing of the water supply has taken place, and until both the buyer and seller have received and reviewed a copy of the test results. The buyer and seller must certify in writing that they have received and reviewed the test results. Neither the Act nor the regulations specifies whether the buyer or the seller is financially responsible for the fees for the PWTA testing or possible treatment. Therefore, it is up to the buyer and seller to negotiate who pays for the test, as well as what actions, if any, will occur if the test results indicate a contaminant is present in the drinking water supply that exceeds an applicable standard. The Act and subsequent regulations do not require water treatment if any test parameter standard level is exceeded. However, the NJDEP does provide information regarding various treatment alternatives and potential funding sources (see
http://www.nj.gov/dep/pwta). The Act is considered a “notice” of potable water quality
for interested parties involved in the real estate transaction.
PWTA testing requirements also apply to certain lessors (landlords) in New Jersey. The lessor of a property where the water supply is from a private well must also test the water for the same PWTA contaminants as a buyer or seller. These testing requirements were to be completed by lessors by March 16, 2004. In addition, the well water must be tested at least once every five years thereafter, as long as the well is not required to be tested under any other state law. The lessor is required to provide a copy of new test results to each rental unit within 30 days of receiving those results. The lessor must also provide new lessees with a written copy of the most recent test results. Providing new lessees with recent well test results also functions as a type of "notice" provision.
Who does the testing and what are acceptable test results?
Once the buyer and seller determine who will pay for the test and hire a New Jersey certified laboratory, the well sample is collected by an employee of the certified laboratory or by the laboratory's authorized representative. A list of certified laboratories is available on the PWTA website at: http://www.nj.gov/dep/pwta. Samples must be collected from an untreated (raw), cold, non-aerated spigot or tap. If a treatment device is on the spigot or tap, the device must be disabled before a sample is collected or collected from a spigot or tap prior to the treatment device. Treated samples do not
The water is analyzed for the various contaminants listed in the Act and regulations, using specific test methods. A complete list of the PWTA parameters, with their corresponding Maximum Contaminant Levels (MCLs) or recommended upper limits are presented in Appendix B. Appendix C contains a list of the Private Well Testing Act required parameters by county. The test methods have been established and certified by the USEPA, and have been approved by NJDEP's Office of Quality Assurance. As part of the test requirements, the sampler must record the lot and block of the property, as well as the X and Y coordinate locations of the well (or at a minimum the front door) using a Global Positioning System (GPS) unit in accordance with N.J.A.C. 7:1D et seq. The person who requested the private well water test should receive their results from the laboratory on the New Jersey Private Well Water Test Reporting Form.
Primary contaminants sampled as part of the PWTA include bacteria (total coliform and fecal coliform bacteria and/or E. coli), nitrates, lead, and all 26 volatile organic contaminants for which MCLs have been established. In certain counties, testing must include a test for the presence of gross alpha particle activity, mercury and/or arsenic. See Appendix C for a complete list of the required parameters by county.
Secondary parameters are regulated by the state for aesthetic or other concerns (e.g., taste, odor, staining, scaling of home fixtures). The secondary parameters that are regulated under the Act are iron, manganese and pH. Many secondary parameters are
naturally occurring in ground water due to geologic conditions. Some common
examples of the effects of secondary contaminants include: brownish drinking water, staining of plumbing fixtures such as sinks, bathtubs, and toilet bowls, staining of clothing, an unpleasant taste in the water, or damage to a home heating unit.
There are special considerations for arsenic and lead with regards to the data in this report. Neither the USEPA nor the NJDEP have an MCL for lead. An Action Level of 15 µg/L has been established for lead (i.e., if the “90th percentile” lead concentration is greater than 15 µg/L). However, the Action Level for lead is not being used in the PWTA Program. This is because the federal drinking water regulations state that the 15 µg/L Action Level should be applied to a series of samples taken from consumers’ taps and the tap samples must stand motionless in the plumbing system for at least six hours prior to sample collection. Since a raw (untreated) groundwater sample is required by the PWTA, the more stringent NJDEP Ground Water Quality standard of 5 µg/L was used as the exceedance threshold because the PWTA sample is a groundwater sample. The report also utilizes the New Jersey established an MCL for arsenic of 5 µg/l which is lower than the federal MCL of 10 µg/l.
(i.e., lot, block, etc.) described in the regulations. The data file is e-mailed to a database at NJDEP, which is designed to store all of the PWTA test results.
What if contaminants are found?
If the results indicate that one or more analytical standards have been exceeded, then the PWTA database automatically forwards an electronic copy of the well test results and well information to the appropriate county or local health authority within five business days of receiving the results from the laboratory. A well test “failure” is defined as any result that exceeds a maximum contaminant level (MCL) for primary drinking water standards or a recommended upper limit (RUL) for secondary drinking water standards with the two exceptions noted above (i.e., lead and arsenic). Laboratories are also required to directly notify the county or local health authority of well test failures for nitrate and fecal coliform or E. coli because they are considered acute contaminants and may pose immediate health concerns.
Once the local health authority is notified electronically by NJDEP or directly by the laboratory, the health authorities may (but are not required to) notify property owners within the vicinity of the failing well. However, because these individual tests are considered confidential, the exact location of the well test failure cannot be identified.
Limitations of the data
Several factors may affect the measurement and quality of the data collected as part of the PWTA and utilized in this report. These factors include sample collection and transport, laboratory analysis, accuracy of related well location information, and data entry and reporting. Any of these factors, if handled improperly, could result in an unwarranted test failure or approval. Since no state agency has the ability to verify that all real estate transactions (sales and leases) subject to testing under the PWTA have been reported to NJDEP, the absence of results, along with errors or mistakes in the reported data, could have a significant impact on the evaluation and interpretation of the data presented. The following identifies some key issues concerning PWTA data:
1. Sample Collection and Transport - Samples collected or transported improperly often yield contaminated or questionable test results. For example, the NJDEP currently suspects that collection of lead samples from unflushed water tanks or spigots may be the primary reason why many elevated lead results are being reported.
2. Analysis and Data Reporting - The PWTA Program testing data are submitted electronically and are automatically entered into the database without any quality control or quality assurance reviews. It is assumed that the certified laboratory properly met all required protocols and the data are accurate. The PWTA Program relies on the reporting laboratory to catch and correct any data entry errors.
evaluations of the data. The new database that went on-line in the Spring of 2007 included additional quality control checks to improve location data.
When reviewing PWTA results, it is important to remember that the tests were conducted on an untreated or raw water sample collected prior to any water treatment system. Many houses or wells may already have treatment systems in place to remove or lessen the degree of contamination and the PWTA test results do not measure if the treatment is working. Further post-treatment samples collected at a kitchen tap are recommended to evaluate the effectiveness of a treatment system.
PWTA test results are not confirmed through the collection and analysis of a second, or confirmatory sample. Questionable or unexpected results are neither confirmed nor verified by NJDEP, and have been included in the data analysis and summaries.
Although PWTA testing is more extensive than previous state regulatory requirements, the list of parameters is limited. The requirement to test for some parameters, such as arsenic and mercury, is based on regional occurrence where these parameters are known to be present in groundwater. Other types of compounds may be present in water if the well is near specific sources of contamination. Caution must be used not to conclude that these contaminants are not present in the drinking water. Assumptions about water quality may only be made for the tested parameters.
Part 2: Private Well Testing Act Test Results
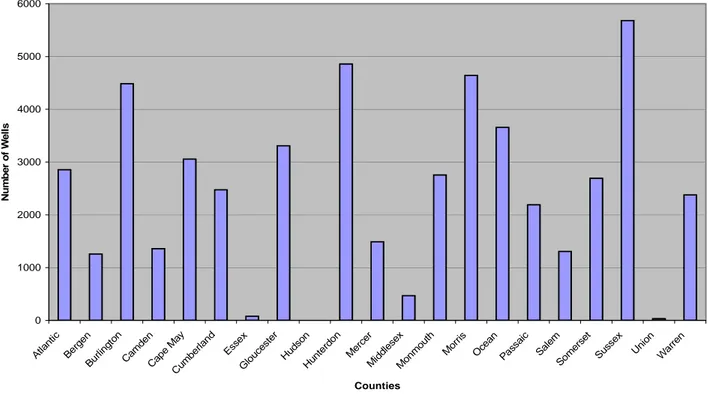
During the first four and half years of the Private Well Testing Act Program September 2002 through April 2007), a total of 51,028 individual wells were sampled. The number of wells sampled in each county ranged from 1 well in Hudson County to 5681 wells in Sussex County (see Figure 1).
Figure 1: Number of Wells Sampled by County No of Wells Sampled in Each County
0 1000 2000 3000 4000 5000 6000 Atla ntic Ber gen Burli ngto n Camd en Cape M ay Cu mbe rland Essex Glou ces ter Hu dson Hunte rdon Me rcer Midd lese x Mo nmo uth Mo rris Ocean Passa ic Sal em Some rset Suss ex Uni on War ren Counties N u m b e r o f W e ll s
Although the number of wells sampled for the PWTA represents the number of private wells involved in real estate sales transactions and rentals, over time the water quality from these wells should give us a complete picture of the water quality of in the state. It is estimated that there are about 400,000 private wells in New Jersey. Based on that number the PWTA program has data for approximately 13 percent of New Jersey’s private wells. The map in Figure 2 shows the locations of the wells that have been tested in the first four and half years.
Data from the Private Well Testing Act Program
The test results from the PWTA Program can be divided into two categories: primary contaminants, that are biological or chemical substances regulated based on potential health effects and secondary parameters, which are regulated for non health-based purposes (e.g., aesthetics, taste, corrosivity).
Primary Contaminants
The PWTA Program uses the same federal and state primary standards that apply to New Jersey's public water systems to define which wells "pass" or "fail" under the PWTA Program with two exceptions. As discussed in Part 1, New Jersey adopted a more stringent, MCL for arsenic of 5 µg/l compared to the federal MCL of 10 µg/l. In addition, since no MCL exists for lead, the ground water standard was used. The ground water standard is 5 µg/l.
1. Bacteriological: Fecal Coliform or Escherichia coli (E. coli)
Fecal waste from humans and animals may contain disease-causing microorganisms. Illness can occur if contaminated water is consumed without adequate treatment to remove or inactivate the pathogens. Therefore, it is important to detect fecal contamination in ground water, especially for systems that do not treat the water prior to delivery. Fecal contamination is usually determined by testing water for the presence of certain fecal-derived “indicator” bacteria, such as total coliform, fecal coliform or
Escherichia coli (E. coli). These bacteria are present in untreated wastes from humans
and warm-blooded animals. The presence of these bacteria “indicates” that the water is contaminated and thus may contain disease-causing microorganisms.
• Sources – septic tanks, cracked sewer lines, contaminated surface waters including lakes, streams, rivers and wetlands, storm water runoff and detention/infiltration basins, runoff from agricultural lands, feedlots, stockyards, land-applied sludge or manure, manure storage areas and landfills.
• Counties that Sampled – All counties are required to test for total coliform bacteria. Because the presence of total coliform bacteria is suggestive, but not conclusive proof that fecal contamination is present, all total coliform-positive samples are required to be further tested for either fecal coliform or E. coli bacteria. (Note: Many labs conduct total coliform and fecal coliform /E. coli tests simultaneously to avoid the extra cost and time-delay involved in conducting follow-up testing of total coliform -positive samples. Also, some methods are designed to test for both total coliform and E. coli simultaneously).
• MCL – If a sample tests positive for either fecal coliform or E. coli, the well fails the test. The presence of either fecal coliform or E. coli is considered sufficient evidence of fecal contamination.
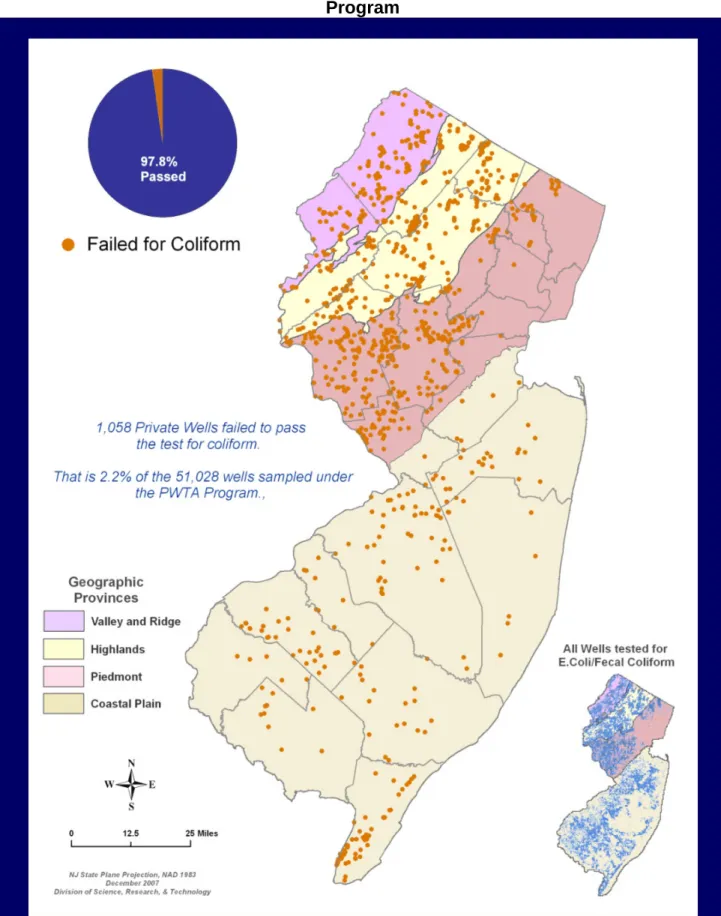
Figure 3: Positive E. Coli/Fecal Coliform Exceedances Reported to the PWTA Program
• Number of Wells that Tested Positive for Total Coliform Bacteria – A total of 7,035 (13%) of 51,028 wells tested were positive for total coliform bacteria. This was not considered a “failure”, but these wells were then required to do follow-up testing for fecal coliform or E. coli. The NJDEP believes that a significant percentage of wells testing positive for total coliform are not actually contaminated with fecal waste. Some coliform of non-fecal origin may be present as buildup in the plumbing system, for example.
• Number of Wells that Tested Positive for Fecal Coliform or E. coli – A total of 1136 (2.2%) of the 51,028 wells that were sampled were positive for either fecal coliform or E. coli in at least one of the samples collected at the well. These data are presented by county in Appendix E.
• Geographic Distribution – The percentage of wells with fecal coliform or E. coli in the combined counties above Burlington and Monmouth (“northern”) was 3.5%. In the remaining (“southern”) counties, the percentage was 1.0% (see Figure 3 above). The NJDEP believes the northern/southern difference is real and not an artifact of the use of different labs or different methods in these two regions. Both laboratory and method biases exist but do not account for the observed difference between the northern and southern parts of the state. The difference is most likely due to the different geology in these regions. The geology in the north is characterized by areas with limestone subject to solution cavities (called karst), fractured bedrock and gravel/cobble water-bearing zones. The southern part of the state is comprised mainly of the coastal plain (alternating layers of sand and clay). Coastal plain geology appears to protect ground water from fecal contamination better than the other geological areas of the state.
• Comments – The percentage of wells testing positive for total coliform and fecal coliform or E. coli after the two years of PWTA testing, when the data were first analyzed, was 13% and 2.1%, respectively (compared to 13% and 2.2% failure rate between September 2002 – April 2007, respectively). Thus, the percentages of wells testing positive are consistent following the testing of an additional 24,964 wells. In the absence of any significant change in the extent of fecal pollution impact, the percentages found in this analysis would not be expected to change to any significant extent in the future.
For the bacteriological analysis, the data are based on a single sample in 91% of the cases.7 Thus, the 2.2% fecal coliform/E. coli -positive figure should be considered a lower limit of the true extent of fecal contamination in New Jersey. Because microbes are randomly distributed in ground water and because fecal contamination can often be low or intermittent, a single sample can miss the contamination. Alternately, fecal contamination may be present in some samples in the absence of coliform bacteria8. A reasonable estimate of the true extent of fecal contamination statewide is perhaps an additional one or two percent.
7
A well that tests positive for total coliform bacteria but negative for fecal coliform or
E. coli should be retested, although not required, to further assure the absence of
these bacteria. The NJDEP recommends annual testing of these wells.
2. Inorganic chemicals
The Private Well Testing Act and implementing regulations require testing for four primary inorganics: nitrate, arsenic, mercury and lead. Testing for nitrate and lead is required for the entire state, while testing for arsenic is limited to 10 Northern New Jersey counties (Bergen, Essex, Hudson, Hunterdon, Mercer, Middlesex, Morris, Passaic, Somerset, and Union). Testing for mercury is limited to nine Southern New Jersey counties (Atlantic, Burlington, Camden, Cape May, Cumberland, Gloucester, Monmouth, Ocean, and Salem).
A. Nitrate
• Sources - Nitrate and its reduced form nitrite are found in ground water due to a number of factors including natural deposition, runoff from fertilizer use, leaching from septic tanks, and from sewage.
• Counties that Sampled - All counties were required to sample for nitrate.
• MCL - The MCL for nitrate is 10 mg/l. If nitrate is present in drinking water at levels above the MCL, it can cause blue-baby syndrome in infants below the age of six months. The symptoms include shortness of breath and, if untreated, it can lead to death.
• Number of Wells that were above the MCL for Nitrate - A total of 1,399 wells (2.7%) of the 51,028 wells tested had concentrations of nitrate above the MCL (see Figure 4). Two counties had very high rates of exceedances: Cumberland (11%) and Salem (9%). These data are presented by county in Appendix F. • Range of Concentrations - The concentration of nitrate ranged from 0 to 153
mg/l.
B. Arsenic
• Source - Arsenic can leach into ground water from the erosion of natural deposits
of arsenic, from past use as a pesticide, and from waste from glass or electronics production. In New Jersey, it is known that wells drilled into the Piedmont Physiographic Province in the northern part of New Jersey can contain high levels of naturally occurring arsenic.
B. Arsenic (cont.)
• Counties that Sampled - The 10 counties in the Piedmont region of the State
were required to sample for arsenic. The counties are Bergen, Essex, Hudson, Hunterdon, Mercer, Middlesex, Morris, Passaic, Somerset, and Union. These data are presented by county in Appendix G.
• Health Effects - Arsenic is a known human carcinogen linked to increased risk of
skin, lung, liver, kidney, and urinary bladder cancer.
• Federal MCL - The MCL in effect for arsenic when the PWTA was signed was 50
µg/l, a standard that was set by the U.S. Public Health Service in 1942. On January 22, 2002 (effective February 22, 2002), the USEPA adopted a new MCL of 10 µg/l, however, those public water systems required to comply with the new arsenic standard had until January 23, 2006 to do so. For the purposes of the PWTA, the NJDEP used the newly adopted Federal MCL of 10 ug/l for assessing the PWTA results beginning in September 2002.
• State MCL - The NJDEP proposed a new arsenic MCL of 5 µg/l which became effective January 23, 2006. For the purposes of this report, all the data were evaluated using the Federal MCL of 10 ug/l; those results that were analyzed by appropriate methods (except EPA method 200.7) were evaluated using the State MCL of both 5 ug/l.
• Number of Wells over the federal MCL of 10 µg/l - A total of 605 wells (3.4%) of the 17,714 wells tested for arsenic had arsenic concentrations over the new federal standard of 10 µg/L.
• Number of Wells over the state MCL of 5 µg/l – One of the analytical methods used to determine the concentration of arsenic in water, EPA Method 200.7, is not sensitive enough to measure arsenic concentrations below 8 µg/l. In order to determine the number and percent of wells that exceeded the NJDEP standard of 5 µg/l, it was necessary to first exclude samples analyzed using Method 200.7. A total of 12,263 samples (70% of arsenic results received) were analyzed for arsenic using the more sensitive analytical methods. Of those 1,445 wells (12%) exceeded the MCL of 5 µg/l.
• Range of Concentrations - The arsenic concentrations in ground water ranged from 0 to 254 µg/l.
• Geographic Distribution - Arsenic exceedances were most commonly found in Hunterdon (18%), Mercer (20%) and Somerset Counties (17%) (See Figure 5). • New Arsenic sampling requirements for Sussex and Warren Counties – PWTA
data have shown that elevated arsenic concentrations also extend to the ground water supply in the Highlands Region of the State based on the results from some PWTA samples collected in those Northern counties that also extend into the Highlands Region. Therefore, beginning March 14, 2008, PWTA regulations
C. Mercury
• Sources - Sources of mercury include air deposition, past pesticide use, and discharges from industrial facilities.
• Counties that Sampled - Mercury has been found in private wells in Southern New Jersey. Nine Southern counties were required to test for mercury: Atlantic, Burlington, Camden, Cape May, Cumberland, Gloucester, Monmouth, Ocean, and Salem.
• MCL - The MCL for mercury in drinking water was established by USEPA, and adopted by NJDEP, at 2 µg/l. Mercury has been linked to neurological problems. • Number of wells over the MCL - A total of 215 wells (0.9%) out of 25,270 wells
tested for mercury had concentrations above the MCL. These data are presented by county in Appendix H.
• Range of Concentrations - The range of mercury concentrations varied from 0 to 114.2 µg/l.
• Geographical Distribution - There are no obvious geographic patterns for the mercury exceedances (See Figure 6). The highest percent of exceedances were in Camden County (2.4%), Gloucester County (1.8%), and Cumberland County (1.7%).
D. Lead
• Source – Previous ground water studies in New Jersey carried out by NJGS (private communication, Mike Serfes, 2007), the Site Remediation Program and USGS have determined that lead is seldom found in ground water samples in New Jersey. The source of lead in drinking water is almost always from the plumbing inside the home.
• Counties that Sampled – All counties were required to sample for lead.
• Sampling – The sampling protocol for PWTA sample collection includes flushing the house system for at least two minutes (preferably 5 or 10 minutes) and collecting the water sample at the tap where the flushing occurred
• Standard – There is no MCL for lead ,however an Action Level of 15 ug/L is used to evaluate the water left standing in the plumbing for a prolonged period of time. The PWTA Program is using the NJDEP Ground Water Quality Standard to evaluate water quality. When the program began the ground water standard was 10 µg/l. On November 7, 2005, the Ground Water Quality Standard was changed to 5 µg/l.
• Lead samples in homes – A total of 5,523 (11%) of the homes had lead levels above the previous Ground Water Quality Standard of 10 µg/l. This number increased to 9,368 (18%) of homes that had lead levels above the new Ground Water Quality Standard of 5 µg/l. This indicates that many homes still have lead in their plumbing systems, since it is unlikely that it originated from the raw ground water supply.
3. Gross Alpha Particle Activity
• Source - Erosion of natural deposits of certain minerals that are radioactive may
emit a form of radiation known as alpha radiation. The alpha radiation is emitted from both short-lived and long-lived radionuclides. In the Southern part of the state, it is probably the decay of radium and its isomers that results in the alpha radiation, while in the northern counties uranium may be implicated.
• Counties that Sampled:
1. Cumberland and Gloucester Counties - Sampling was required beginning
on March 15, 2003.
2. Atlantic, Burlington, Camden, and Salem Counties - Sampling was required beginning on September 16, 2003.
3. Cape May, Hunterdon, Mercer, Middlesex, Monmouth, and Ocean - Sampling was required beginning on March 16, 2004.
• Testing Requirements and MCL - The gross alpha test involves two readings.
• Range of Concentrations - The gross alpha results ranged from non detectable to
481 pCi/l.
• Geographic Distribution – The counties with the highest percent of exceedances were Camden (33%), Cumberland (25%), Salem (14%), and Gloucester (11%). (See Figure 7)
• Additional Sampling - There is considerable evidence that radionuclides are present in the ground water in Northern New Jersey. It is recommended that in the future gross alpha testing be extended to all counties in New Jersey.
4. Volatile Organic Compounds
New Jersey has primary drinking water standards, or Maximum Contaminant Levels (MCLs), for 26 volatile organic compounds (VOCs):
• Sources - VOCs include solvents, degreasers, and components of gasoline. (See Table 2 for a more detailed description of sources).
• Counties that Sampled - All counties were required to sample for VOCs.
• MCLs - The individual MCLs for the 26 regulated VOCs are listed in Table 2. • Number of Wells that exceeded one or more MCLs - One or more VOCs were
detected above their MCL in 702 wells (1.4%) of the 51,028 wells. A total of 636 wells exceeded a standard for one VOC; 55 wells exceeded two MCLs, and 11 wells exceeded three MCLs. See Table 3 for a summary of the VOCs that were detected over their respective MCLs. A summary of the VOC exceedances by county are presented by county in Appendix J.
• VOCs that most frequently exceeded their MCL - There were 247 wells that
exceeded the trichloroethylene MCL (0.5%), 223 wells that exceeded the tetrachloroethylene MCL (0.4%), 66 wells that exceeded the benzene MCL (0.1%) and 58 wells that exceeded the carbon tetrachloride (0.1%).
Table 2: Regulated Volatile Organics Compounds, MCLs and Sources
Volatile Organic Compounds
MCL*
(in µg/l) Sources of Contaminants in Ground Water
Benzene 1 Discharge from factories; leaching from gas storage
tanks and landfills
Carbon Tetrachloride 2 Discharge from chemical plants and other industrial
activities
Chlorobenzene 50 Discharge from chemical and agricultural chemical
factories
1,2-Dichlorobenzene 600 Discharge from industrial chemical factories
1,3-Dichlorobenzene 600 Discharge from industrial chemical factories
1,4-Dichlorobenzene 75 Discharge from industrial chemical factories
1,1-Dichloroethane 50 Discharge from metal degreasing sites and other
factories
1,2-Dichloroethane 2 Discharge from industrial chemical factories
1,1-Dichloroethylene 2 Discharge from industrial chemical factories
cis-1,2-Dichloroethylene 70 Discharge from industrial chemical factories
trans-1,2-Dichloroethylene 100 Discharge from industrial chemical factories
1,2-Dichloropropane 5 Discharge from industrial chemical factories
Ethylbenzene 700 Discharge from petroleum refineries
Methyl-tertiary Butyl Ether 70 Leaking underground gasoline and fuel oil tanks;
Gasoline and fuel oil spills.
Methylene Chloride 3 Discharge from drug and chemical factories
Naphthalene 300 Discharge from industrial chemical factories;
exposure to mothballs
Styrene 100 Discharge from rubber and plastic factories; leaching
from landfills
1,1,2,2-Tetrachloroethane 1 Discharge from industrial chemical factories
Tetrachloroethylene 1 Discharge from factories and dry cleaners
Toluene 1000 Discharge from petroleum factories and
underground storage tanks.
1,2,4-Trichlorobenzene 9 Discharge from textile finishing factories
1,1,1-Trichloroethane 30 Discharge from metal degreasing sites and other
factories
1,1,2-Trichloroethane 3 Discharge from industrial chemical factories
Table 3: Summary of Volatile Organic Compounds Results
September 2002 to April 2007 (out of 51,035 wells)
Compound MCL (µg/l)
No. of Wells with VOCs over the
MCL Range of detected concentrations (µg/l ) Benzene 1 66 (0.1%) ND - 101 Carbon tetrachloride 2 58 (0.1%) ND - 75 Chlorobenzene 50 0 ND - 15.8 1,2-Dichlorobenzene 600 0 ND - 5 1,3-Dichlorobenzene 600 0 ND - 18.6 1,4-Dichlorobenzene 75 0 ND – 19.0 1,1-Dichloroethane 50 1 (0.002%) ND - 82 1,2-Dichloroethane 2 28 (0.1%) ND - 31.3 1,1-Dichloroethylene 2 34 (0.1) ND – 54.1 cis-1,2-Dichloroethylene 70 2 (0.004%) ND - 362 trans-1,2-Dichloroethylene 100 0 ND - 15.6 1,2-Dichloropropane 5 23 (0.05%) ND - 240 Ethylbenzene 700 0 ND – 39.7 MTBE 70 38 (0.1%) ND - 1550 Methylene Chloride 3 44 (0.1%) ND – 48.1 Naphthalene 300 0 ND - 22.9 Styrene 100 1 (0.002%) ND - 149.4 1,1,2,2-Tetrachloroethane 1 8 (0.02%) ND - 25.1 Tetrachloroethylene 1 223 (0.4%) ND - 540 Toluene 1000 0 ND - 464 1,2,4-Trichlorobenzene 9 0 ND – 1.5 1,1,1-Trichloroethane 30 1 (0.002%) ND – 50.5 1,1,2-Trichloroethane 3 3 (0.006%) ND - 12.2 Trichloroethylene 1 247 (0.5%) ND - 550 Vinyl chloride 2 2 (0.004%) ND - 5.1 Xylenes, Total 1000 0 ND – 122.8
Secondary Parameters
NJDEP has established standards for various water quality parameters called secondary parameters. There are three secondary water quality constituents included in the PWTA program: pH, manganese, and iron. Secondary standards or recommended upper limits (RUL) were established for contaminants that may cause problems with taste and odor, cause discoloration of skin, or teeth, and contaminants that corrode, stain plumbing fixtures or clothes during washing.
The pH is a numerical expression indicating the degree of acidity or alkalinity of water. The pH is measured on a scale of 0 to 14. Water with a pH of zero is the most acidic, 14 is the most alkaline, and 7 is neutral. The secondary standard, or RUL, for pH was set for both aesthetic reasons and for control of corrosion. The pH for drinking water should be between an optimum range of 6.5 and 8.5. If the pH is too low (less than 6.5) water may have a bitter metallic taste, and there may be corrosion of pipes and fixtures. If the pH is too high (greater than 8.5) the water may have a slippery feel, taste like soda, and deposits can form on plumbing fixtures. In general, ground water in southern New Jersey is acidic (lower than pH 7.0), and ground water in northern New Jersey is basic (higher than pH 7.0).
Iron is a naturally occurring inorganic constituent of ground water. The secondary standard, or RUL, for iron is 0.3 mg/l. If the concentration of iron is above the standard, the water may have a rusty color, a metallic taste, cause reddish or orange staining and a sediment deposit in the holding tank and in the plumbing fixtures.
Manganese is a naturally occurring inorganic constituent of ground water. The RUL for manganese is 0.05 mg/l. If the concentration of manganese is above the RUL, the water may appear black to brown colored, black stains may occur on plumbing fixtures, and the water may have a bitter metallic taste.
Figure 9 provides a summary of the percent of wells with results that exceeded any of the secondary standards (pH, iron, manganese) between September 2002 and April 2007.
pH - Of the 51,028 wells sampled between September 2002 and April 2007, 22,699
(45%) exceeded the secondary standard (optimum range of 6.5 to 8.5) for pH. Out of the wells tested 22,373 wells (44%) of the wells had a pH below 6.5 and only 326 wells (0.6%) had a pH above 8.5. Typically the pH of ground water in New Jersey ranges from 4 to 9.
Manganese – Of the 51,028 wells sampled between September 2002 and April 2007,
9,890 or 19% of the wells exceeded the secondary standard for manganese. Manganese concentrations ranged from 0-2300 µg/l.
Figure 9: Percent of Wells with Results that Exceeded the Recommended
Upper Limit for Secondary Parameters
(Of 51,028 wells)
What are the data telling us about private wells?
This report is based on 55,749 samples that were submitted between September 2002 and April 2007 to the Private Well Testing Act Program collected from 51,028 individual wells throughout the State. A total of 6,369 wells (13%) exceeded one or more of the MCLs developed for primary drinking water contaminants (i.e., arsenic, mercury, nitrate, total coliform and fecal coliform, gross alpha particle activity, and volatile organic compounds). One well exceeded 6 MCLs; 3 exceeded 5 MCLs; 3 exceeded 4 MCLs; 48 exceeded 3 MCLs; 692 exceeded 2 MCLs; and the remaining 5,622 exceeded one MCL.
Figure 10 depicts the percentage of wells that passed the primary standards; lead results are discussed separately because of problems encountered with the test results for lead.
Percent of Wells Exceeding Secondary Standards 0 5 10 15 20 25 30 35 40 45 50 Iron Manganese pH P E R C E N T
gross alpha particle activity. Both of these contaminants are known to cause serious human health effects, including certain cancers, when consumed for an extended period of time above the MCL. Gross alpha particle activity and arsenic are required to be tested for in certain counties (see Appendix C). PWTA data collected for gross alpha particle activity have shown that 9.6% of sampled wells exceeded the MCL of 15 pCi/L. It should be noted that sampling for gross alpha particle activity is only required in counties where NJDEP has historically found elevated levels. A total of 12% of those wells tested exceeded the New Jersey state arsenic standard of 5 µg/l. Arsenic test results continue to illustrate that certain areas of Northern New Jersey are more likely to experience arsenic contamination. Specifically, certain geological formations in the Piedmont region contain naturally occurring geologic units that may leach arsenic into the groundwater as it passes through this formation.
Test results for PWTA parameters that are required in all New Jersey counties continue to show that nitrate and fecal coliform/E. coli MCLs are most frequently exceeded, 2.7% and 2.2%, respectively. Both of these contaminants are regulated as acute parameters because exceeding the standard might lead to immediate health concerns. The percentage of volatile organic compounds (VOCs) exceedances above the MCL was 1.4%. This percentage is consistent with what was observed in the initial PWTA report. The percentage of wells exceeding the mercury MCL was 0.9%. Mercury testing is only required in the certain counties located in the southern part of the state
Secondary parameters (pH, manganese and iron) throughout New Jersey continue to exceed their particular Recommended Upper Levels (RULs) in a significant number of wells. Sixty-four (64) percent (or 32,530) of the 51,028 wells tested exceeded an RUL for at least one secondary drinking parameter, with pH exceeding the RUL in the greatest percentage of wells (45%). A total of 2,932 wells exceeded the RULs for all three parameters, 9,813 exceeded two; and 19,524 exceeded one of the RULs.
A comparison can be made between contaminants in Northern New Jersey and Southern New Jersey by looking at the counties that sampled for arsenic and gross alpha in the north and comparing it to the counties that sampled for mercury and gross alpha in the south. Figures 11 and 12 illustrate the comparison.
Figure 10: Statewide Summary of PWTA Results For Primary Drinking Water Standards
September 2002 – April 2007
Figure 11: Southern New Jersey - Summary of Private Well Testing Act Results for Primary Drinking Water Standards
September 2002 – April 2007 Out of 25,256 wells
In the nine Southern New Jersey counties, 12% of the 25,256 wells exceeded one or more MCLs. Failures for gross alpha particle activity were most common followed by nitrates, VOCs, mercury and fecal coliform/E. coli.
Figure 12: Northern New Jersey - Summary of Private Well Testing Act Results For Primary Drinking Water Standards
September 2002 – April 2007 Out of 25,772 wells
In the 12 Northern New Jersey counties, 12% of the 25,772 wells exceeded one or more primary drinking water standards. The most common failure was for arsenic (12%); followed by gross alpha particle activity (in Mercer, Middlesex, and Hunterdon Counties only); fecal coliform/E.coli, nitrates and VOCs.
Lead Testing Results (Variability in Results)
Exposure to lead is a significant health concern, especially for young children and infants whose growing bodies tend to absorb more lead than the average adult, and because of the concern that it may impair a child’s mental development. Drinking water is one possible source of lead exposure. Infants whose diets consist mainly of liquid can get 40 - 60% of their lead exposure from water. Some drinking water pipes, taps, solder and other plumbing components contain lead. Lead-containing plumbing materials are still being sold. Some fixtures may still contain up to 8% lead, which is used as an
requirements may still show elevated lead due to the presence of lead and lead-containing plumbing materials and water use patterns. The NJDEP did not originally expect raw water samples to exhibit elevated levels of lead.
Shortly after PWTA sampling began, county and local health agencies noted that some of the reported lead results were unexpectedly high. Often the local health departments, through confirmatory sampling, could not substantiate the results. Well water testing conducted prior to the PWTA rarely detected the presence of lead in well water. Historically, when high levels of lead were found in drinking water it was attributable to the well structure or plumbing, not groundwater sources. Therefore, the NJDEP considers the lead results to be questionable, and did not include them in the summary charts. The raw lead test results indicate that 5,523 wells (11%) out of the 51,028 tested had lead levels above the old ground water standard of 10 µg/l, and 9,368 (18%) wells had lead levels above the new ground water standard of 5 µg/l. Furthermore, some of the samples contained unrealistically high concentrations of lead with the highest being 20,200 µg/l. This level is significantly above any level that would be expected to occur in ground water. Based on the NJDEP’s experience with groundwater investigations and monitoring of ambient groundwater, the homes with water samples showing elevated lead levels are not near areas where lead is likely to be a contaminant in ground water. It is very unlikely that the source of lead was the groundwater.
Research conducted in the 1990’s by scientists at NJDEP and Rutgers demonstrated that lead in well water samples collected from homes served by private wells in New Jersey is most likely coming from plumbing. Further, the research shows that the sampling method, sample volume and sampling location are vital in distinguishing between lead in the ground water versus lead coming from the plumbing. As a result of the observed high lead levels in the PWTA database, the NJDEP conducted a study with Rutgers University to more definitively determine the source of the lead.
The sampling procedure used in the study included flushing the house system for five or 10 minutes and collecting the water sample as close to the well head as possible. In most cases, this sampling procedure results in a water sample being collected at the tap at the water tank, not the kitchen sink. The resulting water sample is, in effect, an unflushed sample because the tap at the water tank may not have been opened in years. Although flushing technically occurred, the flushing took place at the kitchen tap, which is not where the water sample was collected.
Information from 10 homes, where extensive water samples were collected and analyzed for lead confirmed this scenario (see Figure 13). The first draw kitchen tap (FD-kitchen) water samples show high lead concentrations. After a five-minute flush, the lead levels decreased. After the kitchen tap was flushed, water samples were collected from the water tank tap, representing a first draw water tank (FD Water Tank)
Figure 13: Lead in Water Samples
sample and a five minute flushed water sample from the kitchen tap. The lead levels in the first draw water tank sample contained the highest levels of lead of all the samples collected. After flushing at the water tank tap for five minutes, lead levels decreased. The conclusion of the study is that the elevated lead levels observed in the PWTA water samples are due to the fact that sampling was conducted at water tank taps that were not flushed. Therefore, it was concluded that the high lead concentrations were a consequence of the plumbing, and not the ground water quality.
It should be reiterated that, regardless of its source, elevated lead levels are a serious health concern. Homeowners with elevated levels of lead, regardless of the source, should take immediate steps to remediate the situation, assuming treatment is not already in place. The PWTA only requires a raw or untreated sample for lead since this is an indication of the ground water quality. A homeowner may want to collect a first draw sample (no flushing) in order to determine if there may be any issues with lead in
0.00 5.00 10.00 15.00 20.00 25.00 30.00 35.00
First Draw Kitchen Flush Kitchen First Draw Water Tank Flush Water Tank
Sample Tap Lead ( u g /L)
Part 3: Private Well Testing Act Education and Outreach
Communication Efforts
From the inception of the PWTA Program, the NJDEP recognized the importance of public education and outreach. The NJDEP was aware of the fact that the program would not only impact buyers, sellers, landlords and renters, but also would affect other professionals involved in real estate transactions including, but not limited to, municipal officials, health agencies, realtors, and certified laboratories. The PWTA program consequently developed and utilized several measures to educate these constituents and provide the necessary support to make the implementation process as straightforward as possible, and to lessen any burden incurred.
Two education initiatives were the development of a toll free hotline and the development of the Private Well Testing Act website (PWTA website) at
www.nj.gov/dep/pwta. The PWTA Website, since its inception, has been a popular
public information resource. The PWTA website includes a list of frequently asked questions that address issues and concerns related to the requirements of the Private Well Testing Act and implementing regulations. Frequently asked questions are developed from commonly submitted questions to the PWTA program and routinely updated and posted. For the convenience of visitors to the PWTA website, an e-mail box is available and is frequently utilized to ask questions that could not be ascertained by viewing the website.
In addition, other PWTA educational and informational materials have been developed and distributed to the public and targeted audiences. Fact sheets on the PWTA Program were developed and are available on the PWTA website. Also, a list of certified laboratories is available. Two important publications assist the PWTA Program in communication efforts with New Jersey’s county and local health departments and certified laboratories that perform PWTA testing, and are distributed on a periodic basis.: “Health Officer Advisory Bulletin” was established and distributed to inform New Jersey county and local health officials of pertinent PWTA-related issues and “Laboratory Advisory Bulletin” was initiated to facilitate communication with New Jersey certified laboratories that offer PWTA-related laboratory services and to provide them with pertinent information regarding PWTA data management issues.
Educational and Outreach Needs
While the PWTA program has made some significant efforts to explain the program and educate our constituents during the past years, there are still areas that must be addressed. These include the development of additional fact sheets for the public for specific drinking water contaminants (i.e., lead, mercury, arsenic, etc.). Additionally, PWTA sponsored training events to update targeted audiences such as realtors, buyers
and other interested parties. PWTA issues, such as health-related education concerning drinking water contaminants, Geographic Information System (GIS), real estate law and the implementation and compliance with the PWTA and its regulations, must be conveyed through further organized educational and outreach events.
Part 4: Case Studies
Private Well Testing Act Case Study #1 - Evesham Township, Burlington County
In 2005, a home in Evesham Township, Burlington County had a private well which was tested under the PWTA program. The well was contaminated with tetrachloroethylene, a solvent widely used by the dry cleaning industry. The test result indicated that the well had 4 ppb of tetrachloroethylene. The Maximum Contaminant Level (MCL) is 1 ppb. When a well exceeds a health based MCL, the PWTA authorizes the county health authority to notify neighboring properties within 200 feet of the contaminated well. In this case, the Burlington County Health Department sampled 18 private wells in the vicinity. Of the 18 wells tested, 12 were found to have tetrachloroethylene concentrations that exceeded the MCL, with one well having an extremely high concentration of 840 ppb. The County Health Department then contacted the Site Remediation Program in the NJDEP to assist with follow-up testing and remedial activities.
The NJDEP tested an additional 40 private wells in the area. Of those 40 wells, 6 wells exceeded the MCL for tetrachloroethylene, with the highest concentration at 70 ppb. In addition, four of the 40 private wells exceeded the MCL for mercury. All of the wells that exceeded the MCL's for tetrachloroethylene and mercury were eligible in accordance with the NJDEP's Spill Compensation Fund (aka Spill Fund), and had all of the drinking water remedial treatment costs related to tetrachloroethylene and mercury contamination covered by the Spill Fund.
Private Well Testing Act Case Study #2 - Byram Township, Sussex County
In the summer of 2004, a well at a house being sold in Byram Township, Sussex County was found to be contaminated with trichloroethylene above the Maximum Contaminant Level (MCL) of 1 microgram per liter (or part per billion (ppb)). The concentration detected was 29 µg/l. The public notification provisions within the PWTA regulations suggest that the local health authority notify neighboring properties within at least 200 feet whenever a drinking water standard (e.g., MCL) is exceeded. Because of the location of the affected property, no homes were located within 200 ft of the affected property, so neither the local health authority nor the State performed any subsequent sampling.
Approximately nine months later, a home in the same neighborhood was sold and the well exceeded the MCL for trichloroethylene with a concentration of 39 µg/l. The local