RESEARCH NOTE
CACTUS: cancer image annotating,
calibrating, testing, understanding and sharing
in breast cancer histopathology
Alper Aksac
1, Tansel Ozyer
2, Douglas J. Demetrick
3and Reda Alhajj
1,4*Abstract
Objective: Develop CACTUS (cancer image annotating, calibrating, testing, understanding and sharing) as a novel
web application for image archiving, annotation, grading, distribution, networking and evaluation. This helps patholo-gists to avoid unintended mistakes leading to quality assurance, teaching and evaluation in anatomical pathology. Effectiveness of the tool has been demonstrated by assessing pathologists performance in the grading of breast carcinoma and by comparing inter/intra-observer assessment of grading criteria amongst pathologists reviewing digital breast cancer images. Reproducibility has been assessed by inter-observer (kappa statistics) and intra-observer (intraclass correlation coefficient) concordance rates.
Results: CACTUS has been evaluated using a surgical pathology application—the assessment of breast cancer grade.
We used CACTUS to present standardized images to four pathologists of differing experience. They were asked to evaluate all images to determine their assessment of Nottingham grade of a series of breast carcinoma cases. For each image, they were asked for their overall grade impression. CACTUS helps and guides pathologists to improve disease diagnosis with higher confidence and thereby reduces their workload and bias. CACTUS can be useful for both dis-seminating anatomical pathology images for teaching, as well as for evaluating agreement amongst pathologists or against a gold standard for evaluation or quality assurance.
Keywords: Medical image analysis, Breast cancer, Histopathology, Annotation, Grading
© The Author(s) 2019. This article is licensed under a Creative Commons Attribution 4.0 International License, which permits use, sharing, adaptation, distribution and reproduction in any medium or format, as long as you give appropriate credit to the original author(s) and the source, provide a link to the Creative Commons licence, and indicate if changes were made. The images or other third party material in this article are included in the article’s Creative Commons licence, unless indicated otherwise in a credit line to the material. If material is not included in the article’s Creative Commons licence and your intended use is not permitted by statutory regulation or exceeds the permitted use, you will need to obtain permission directly from the copyright holder. To view a copy of this licence, visit http://creat iveco mmons .org/licen ses/by/4.0/. The Creative Commons Public Domain Dedication waiver (http://creat iveco mmons .org/publi cdoma in/ zero/1.0/) applies to the data made available in this article, unless otherwise stated in a credit line to the data.
Introduction
Advanced image capturing and analysis in digital pathol-ogy has brought in more insight to pathologists and guided them in identifying and grading diseases. Stag-ing and gradStag-ing methods may differ for various types of cancer; the most commonly for breast cancer is Not-tingham grading system [1, 2]. It evaluates three criteria, namely: nuclear pleomorphism, tubular formation, and number of mitotic figures in the most active areas; each is assigned a score from 1 to 3. The sum of these scores determines the grade of the analyzed breast cancer case.
Histopathological tissue analysis based on correct detection and annotation of nuclei, tubules and mitosis, is done manually by expert pathologists. This process requires considerable effort, expertise and experience. These skills are gradually gained over years by experi-encing different cases in clinical duties and receiving feedback from both more experienced domain experts and the clinical courses of patients. Whereas visual inter-pretation leads to inter/intra-observer variability [3, 4], and some potential decreased reproducibility. These tools intend to increase the performance of patholo-gists regarding speed and accuracy [5]. Therefore, it is important to develop an automatic evaluation tool for quantitative and qualitative analysis to eliminating this disadvantage.
Open Access
*Correspondence: [email protected]
1 University of Calgary, Calgary, AB, Canada
Despite the existence of several applications, histo-pathological examination of tissues is still a challenging problem. This is true because fixation, embedding, sec-tioning and staining steps in tissue preparation produce large amounts of artifacts and differences [6]. Also, the variability in size, shape, location, texture of a nuclei turn automated detection into a more complicated process.
To contribute to this highly essential and demanding domain, this paper describes a novel tool called CAC-TUS (cancer image annotating, calibrating, testing, understanding and sharing), which is to the best of our knowledge the first comprehensive tool intended to help and guide pathologists in their effort to improve disease diagnosis and thereby reduce their workload and bias.
CACTUS has an interactive machine learning approach to keep its model accurate and robust. To increase the confidence in the outcome of CACTUS and to turn it into a more attractive tool, it has been distin-guished by integrating a social network construction and analysis component which guides a pathologist further based on the social network of his/her collaborators and co-authors. This leads to a recommendation system that highlights to a pathologist the discoveries by experts and influential collaborators and co-authors; this may lead to faster learning with higher confidence.
The social network between pathologists increases engagement and interaction by improving the compara-bility of the results obtained by people in different labs. This is another way to overcome subjectivity in decision-making. A breast cancer and its grade can be detected more accurately by combining machine learning and graph theory algorithms [7, 8] with image analysis.
Main text
The main text of this paper is organized as follows. “Brief overview of existing similar tools” section is an overview of the existing similar tools which had been completed for medical image processing. “The user interface and functionalities” section presents the functionality and the user interface of CACTUS. “Conclusions” section high-lights main remarks related to the conducted study.
Brief overview of existing similar tools
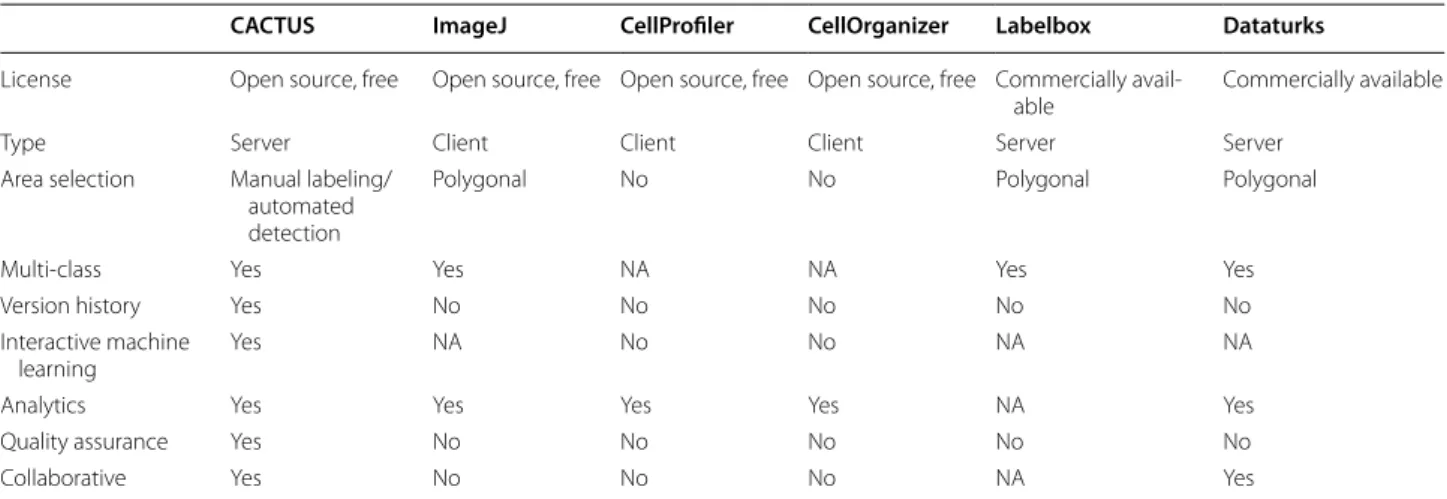
Several tools and libraries have been developed for medi-cal image analysis, both for commercial and research purposes. In this section, we briefly cover some of the popular tools described in the literature. A comparison of existing similar tools is given in Table 1.
The ilastik toolkit [9] is a simple tool for interactive image classification, segmentation and analysis. It is a free and open-source. Installers for Linux, macOS and Windows are available.
ImageJ [10] is an open-source image processing system designed for scientific multidimensional images. Install-ers for Linux, macOS and Windows are available. It is also a popular tool since it is highly extensible, with thou-sands of plugins and scripts for performing a wide variety of tasks, and a large user community.
CellProfiler [11] is free, open-source software designed to aid biologists without computer-vision training to quantitatively measure cell images automatically.
CellOrganizer [12] is a free and open-source tool. It builds generative models of the cellular organization by modeling the structure of a cell and a nucleus shape given high resolution 2D and 3D microscopy images.
Table 1 Comparison of existing similar tools
‘NA’ refers to either a system is not designed for the specific purpose, or well-known examples of this system for a specific purpose were not available when this article was written
CACTUS ImageJ CellProfiler CellOrganizer Labelbox Dataturks
License Open source, free Open source, free Open source, free Open source, free Commercially
avail-able Commercially available
Type Server Client Client Client Server Server
Area selection Manual labeling/ automated detection
Polygonal No No Polygonal Polygonal
Multi-class Yes Yes NA NA Yes Yes
Version history Yes No No No No No
Interactive machine
learning Yes NA No No NA NA
Analytics Yes Yes Yes Yes NA Yes
Quality assurance Yes No No No No No
Labelbox [13] and Dataturks [14] provide image anno-tation or segmenanno-tation tasks management, They are par-ticularly useful when crowd-sourcing the annotations.
The user interface and functionalities
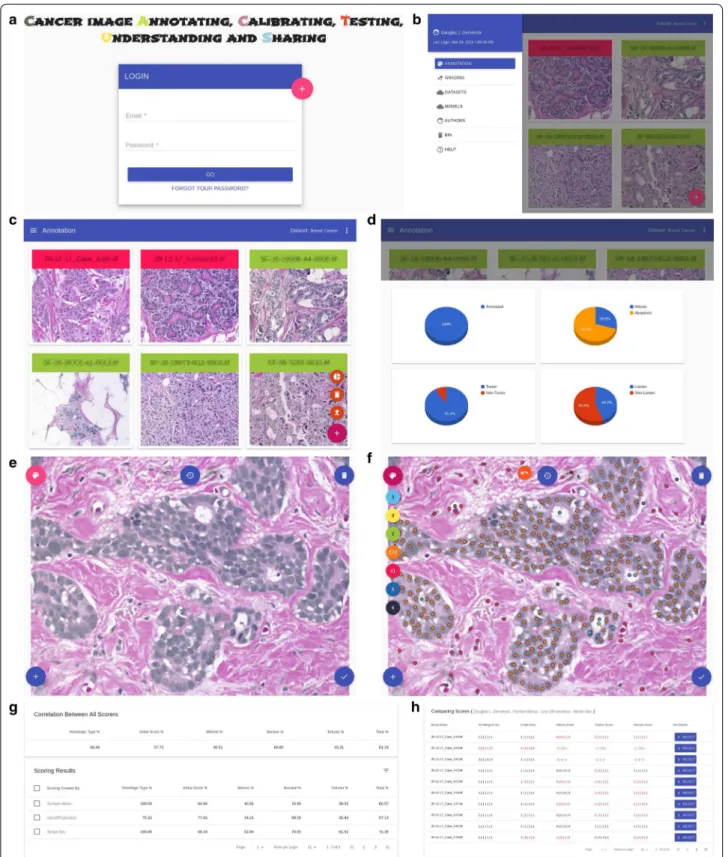
CACTUS provides a simple user-friendly interface that helps users in their effort to improve disease diagnosis, and thereby reduces their workload and the bias among them. The CACTUS server has been implemented in Python using the Flask framework by running on top of MongoDB, which operates depending on Python envi-ronment and can run on multi-OS (including, Windows, macOS and Linux). The CACTUS website has been developed as a single-page application powered by JavaS-cript library AngularJS. It utilizes a simple, easy to use graphical interface (see the Login Screen in Fig. 1a).
The user can navigate in the web application by clicking the menu icon available on the top left corner. As a result, a navigation dialogue is displayed on the screen shown in Fig. 1b.
Annotation
When users log in, the list of images with a red flag (not annotated yet) is automatically loaded, see Fig. 1c. Alter-natively, to reach this section, users can select the menu icon at the top left corner and choose annotation from the navigation menu (see Fig. 1b). After completing the assessment, the annotated images will be flagged green. Users may decide to stop and log off at any moment. Their progress and changes will be saved. They may come back later and resume from where they were left. There is a floating action button (FAB), a circular button at the bottom right corner, which triggers the primary action in the application’s UI such as upload, delete and details about annotations (see Fig. 1d).
In the annotation editor screen, users have several FABs positioned on the app’s UI. The annotation palette button is located at the top left corner. Users can choose their annotation types (such as mitosis, non-mitosis, apoptosis, tumor, non-tumor, lumen, non-lumen from top to bottom, respectively, as shown in Fig. 1e, f). More-over, these annotations can be done automatically using specifically trained models for nuclei, mitosis and tubu-lar predictions. The auto annotation button is located at the bottom left corner. The history button is positioned on the top at the center of the screen. Users can undo or redo their recent annotation actions. They can also load the previous version from other annotation sessions. Users can remove the annotations using the remove button located on the top right side of the screen. All changes can be saved by clicking the save button located at the bottom right side of the screen.
Grading
The grading screen has been designed very similar to the annotation screen. Users will see the selected list of images with a red flag (not scored yet). Once users complete their assessment, the images will be flagged green. Unless they are completed, the images will be blue. Also, users may decide to stop and log off at any moment. Their progress and changes will be saved, and their current case will be marked as unfinished with a blue flag. They can continue where they were left off.
We have evaluated the tool by presenting standard-ized images from the BreCaHAD dataset [5] to four surgical pathologists of varying practice interests in surgical pathology. They were first asked for their ini-tial impression of the cancer grade from a single image. Then, they were asked about their impression of the individual grading criteria. The experience of the four participating pathologists is more than 15 years except one. Moreover, 3 out of 4 pathologists are surgical pathologists.
CACTUS permits the evaluation of individual answers as compared to a single gold standard and the agreement amongst the pathologists for each criterion. This infor-mation allows the identification of pathologists who are consistently evaluating standardized images or histo-logical criteria differently compared to their cohort, thus allowing self-assessment, potential external intervention, and/or re-education of other participants in the quality assurance exercise.
Statistical analysis of the inter-observer agreement is shown in Fig. 1g, h. Figure 1g is the main screen for the statistical analysis where the top card shows the inter-observer agreement in Fleiss κ values (multiple observ-ers) between pathologists for given cases, and the bottom card includes a table to show the level of agreement between pairs of observers (one-to-one) based on Cohen κ.
Figure 1h is the detailed comparison screen in table format where each row represents the case and each cell includes scores from pathologists. The order of patholo-gists is given in the table title. If there is a difference between pathologists, the cell is highlighted with red color. The user can also see these differences in detail by clicking the Select button on the scoring screen.
Datasets and models
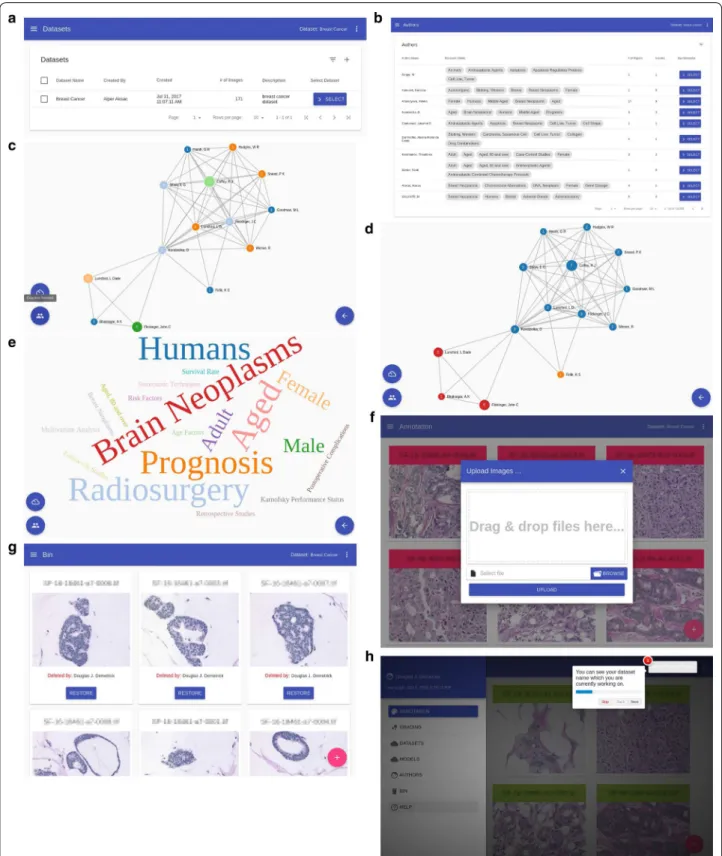
As shown in Fig. 2a, users can choose from the table any available dataset to annotate and/or grade by clicking the
Select button. Users can create a new database by
click-ing the plus sign (“+”) icon on the top right corner of the table. It is also possible to search/delete by clicking the
Fig. 1 a Login screen, b menu screen, c annotation screen, d annotation details screen, editor screens for annotation are shown in e before
annotation and f after annotation, grading screens for annotation are shown in g inter-observer agreement between users and h detailed comparison screen
Fig. 2 a Datasets screen, b authors screen, network and word cloud screens for authors are shown in c co-author network, d communities in
The models screen has been designed very similar to the datasets screen. In this screen, users can select models to be used in the annotation editor screen where if the quality of predictions is very poor, the model can be re-trained more efficiently by incorporat-ing human feedback to provide more accurate results. If provided, the feedback does not improve the overall outcome, users still can choose older models from this table. They can even delete unsuccessful models from the system.
Authors
As shown in Fig. 2b, the “Authors” function allows users to search for authors or colleagues who are conducting breast cancer research. Users can see their co-authors’ network or their active research fields by clicking the
Select button. The co-authorship network represents
col-laborations between authors who co-published papers. It is also possible to apply community detection techniques to examine the structure of the co-authorship network. The author’s active research fields are shown in the word cloud where font size reflects the importance of each tag (Fig. 2c–e).
Others
The upload screen allows users to upload case images to the already selected database by either drag and drop or by selecting them from a folder. The Bin/Recover screen allows users to recover images that were removed and not included in the annotation process. The help function shows and explains to users how to use the application step by step, see Fig. 2f–h.
Conclusions
We have designed and tested a tool that could be used for education, evaluation and quality assurance purposes in a wide spectrum of surgical pathology practices. The pro-posed tool will help and guide pathologists in their effort to improve disease diagnosis and thereby reduce their workload and the bias among them. A breast cancer and its grade can be detected more accurately by combining machine learning and graph theory algorithms with the help of image analysis.
Future work will focus on improving the annotation module with advanced features such as highlighting nuclei boundaries or other structures while selecting them in the annotation process. Moreover, adding and developing 3D histology-based methods to the proposed system will allow presenting improved visualizations and results in the histopathology image analysis.
Limitations
Although the development of the application is complete from the user’s perspective, the performance of the code can still be improved in future versions. CACTUS has initially been designed for users with minimal training. Later on, it will be developed in a more advanced user-friendly manner. Besides, CACTUS will be significantly improved by adding new features and further customi-zation of the visualicustomi-zations. The application currently supports only breast cancer analysis. The planned task is to extend the application usability to other diseases and types of cancer, starting with prostate cancer.
Abbreviations
CACTUS: cancer image annotating, calibrating, testing, understanding and sharing; BreCaHAD: breast cancer histopathological annotation and diagnosis; FAB: floating action button.
Acknowledgements
We gratefully acknowledge the support of NVIDIA Corporation with the dona-tion of the Titan X GPU used for this research.
Authors’ contributions
AA, TO and RA participated in designing CACTUS. DJD participated in tested CACTUS. AA developed CACTUS. All authors read and approved the final manuscript.
Funding Not applicable.
Data and material availability
CACTUS is released under the MIT license and is available at GitHub (https :// githu b.com/alper aksac /cactu s).
Ethics approval and consent to participate Not applicable.
Consent for publication Not applicable. Competing interests
The authors declare that they have no competing interests. Author details
1 University of Calgary, Calgary, AB, Canada. 2 TOBB University of Economics
and Technology, Ankara, Turkey. 3 Laboratory Medicine, University of Calgary
and Calgary Laboratory Services, Calgary, AB, Canada. 4 Istanbul Medipol
University, Istanbul, Turkey.
Received: 5 November 2019 Accepted: 17 December 2019
References
1. Elston CW, Ellis IO. Pathological prognostic factors in breast cancer. I. The value of histological grade in breast cancer: experience from a large study with long-term follow-up. Histopathology. 1991;19(5):403–10.
2. Bloom H, Richardson W. Histological grading and prognosis in breast cancer: a study of 1409 cases of which 359 have been followed for 15 years. Br J Cancer. 1957;11(3):359.
3. Robbins P, Pinder S, De Klerk N, Dawkins H, Harvey J, Sterrett G, Ellis I, Elston C. Histological grading of breast carcinomas: a study of interob-server agreement. Hum Pathol. 1995;26(8):873–9.
•fast, convenient online submission
•
thorough peer review by experienced researchers in your field
• rapid publication on acceptance
• support for research data, including large and complex data types
•
gold Open Access which fosters wider collaboration and increased citations maximum visibility for your research: over 100M website views per year
•
At BMC, research is always in progress. Learn more biomedcentral.com/submissions
Ready to submit your research? Choose BMC and benefit from:
4. Frierson HF, Wolber RA, Berean KW, Franquemont DW, Gaffey MJ, Boyd JC, Wilbur DC. Interobserver reproducibility of the Nottingham modification of the Bloom and Richardson histologic grading scheme for infiltrating ductal carcinoma. Am J Clin Pathol. 1995;103(2):195–8.
5. Aksac A, Demetrick DJ, Ozyer T, Alhajj R. Brecahad: a dataset for breast cancer histopathological annotation and diagnosis. BMC Res Notes. 2019;12(1):82.
6. Wynnchuk M. Minimizing artifacts in tissue processing: Part 2. Theory of tissue processing. J Histotechnol. 1993;16(1):71–3.
7. Aksac A, Özyer T, Alhajj R. CutESC: cutting edge spatial clustering tech-nique based on proximity graphs. Pattern Recogn. 2019;96:106948. 8. Aksac A, Özyer T, Alhajj R. Data on cut-edge for spatial clustering based
on proximity graphs. Data Brief. 2019;28:104899.
9. Sommer C. Straehle C. Koethe U. Hamprecht FA. Ilastik: interactive learn-ing and segmentation toolkit. In: 2011 IEEE international symposium on biomedical imaging: from nano to macro. New York: IEEE; 2011. p. 230–3.
10. Abràmoff MD, Magalhães PJ, Ram SJ. Image processing with imageJ. Biophotonics Int. 2004;11(7):36–42.
11. Carpenter AE, Jones TR, Lamprecht MR, Clarke C, Kang IH, Friman O, Guer-tin DA, Chang JH, Lindquist RA, Moffat J, et al. Cellprofiler: image analysis software for identifying and quantifying cell phenotypes. Genome Biol. 2006;7(10):100.
12. Murphy RF. Cellorganizer: image-derived models of subcellular organiza-tion and protein distribuorganiza-tion. In: Methods in cell biology, vol. 110. Amster-dam: Elsevier; 2012. p. 179–93.
13. Labelbox. https ://label box.com. 14. Dataturks. https ://datat urks.com.
Publisher’s Note
Springer Nature remains neutral with regard to jurisdictional claims in pub-lished maps and institutional affiliations.