391
Special Issue 2: Research Article
ISSN:2148-6905 online Journal homepage: http://www.ijate.net/index.php/ijsm
Determination of Some Heavy Metal Concentrations of Sage Tea with FAAS
Fevzi KILIÇEL*1, Hacer Sibel KARAPINAR 1, Ayşe UĞUZ 1
1Kamil Özdağ Sciences Faculty, Karamanoğlu Mehmetbey University, Department of Chemistry, Karaman/Turkey
Received:05 May 2017 – Revised: 18 October 2017 – Accepted:03 November 2017
Abstract: Herbal teas are blends based on the plant's roots, root hairs, branch shoots, aromatic parts of leaves,
flowers, shells, fruits, or seeds that are prepared by drying aromatic parts in the boiling water. Although the plant teas are known with many benefits in terms of health, they are an important threat for people’s life if they are exposed to some contamination due to the misuse or overuse or uncontrolled production. The living environment of the plants is polluted with many harmful substances which arise from the various sources. The factors such as the development of industry and increasing traffic, pesticides, industrial and household waste increase the heavy metal pollution. In this study, the sage teas were collected from the different localities (markets, market place, herbalist) within the province, Karaman (Turkey). The samples were taken in the sufficient quantities and analyzed by the appropriate drying, milling and dissolution processes. The samples were prepared as 2 parallels for each sample and were solved by the wet burning method. The concentrations of the examined elements were determined by Flame Atomic Absorption Spectrometry. According to the results, the amounts of Co, Ni, Cu, Zn, Cd, Mn, Mg, Fe and Ca were determined in all of the samples. Cr was not designated in the samples. Co and Cd exceeded the limits which are accepted in Europe and in Turkey. It should be noted that these foods can easily be contaminated due to the factors such as the physical and chemical structure of the soil, agricultural activities, storage and packaging conditions.
Keywords:Sage tea, Heavy metal, FAAS, Karaman, Turkey
1. INTRODUCTION
The use of medicinal plants as the healing, curative or nutritional supplements is as old and widespread as the human history. It is known that the plants have been used by many societies the around the world to preserve or restore health through out the history [1]. For the centuries, it has been tried to discover which parts of plants can be renewed, in the experiments with the toxic and healing properties. Hippocrates, who is considered as the father of modern medicine from ancient Greeks, used hundreds of plants which are popular today in daily practice [2].
The use of herbs as the herbal teas (linden, chamomile, green tea, fennel, cinnamon etc.) and nutrients (cinnamon, mint, thyme, ginger etc.) in our country is quite common because these plants are believed to treat some diseases. The plants, may contain the heavy metals which
*Corresponding Author E-mail: [email protected]
392
may result in interactions with soil, air or water. The contamination of untreated plant species with the heavy metals may differ in the certain factors. They may include the growing and processing processes, harvesting times, fertilizer and pesticide use, agricultural activities, geographical location, storage processes. Therefore, the collection, storage and packaging of plants should be made under the certain observations [3].
The heavy metals are mostly seen due to the environmental problems and they are described as the toxic and poisoning metal even on the relatively high-intensity and low concentrations. This group includes more than 60 metals such as lead, cadmium, chrome, iron, cobalt, copper, nickel, quicksilver and zinc [4]. In order to avoid the unwanted and unexpected side effects, it is very important that the dose of the plant is taken and properly used.
If a person consume a lot or very often, the plant will most likely develop the toxicity. So the amount of herbal plants consumption of should be investigated correctly [1]. In this study, some heavy metal concentrations have been determined by taking in sufficient quantities of the sage (salvia officinalis) plant which is offered for sale at the market, market places and herbalist in Karaman.
2. MATERIAL and METHODS 2.1. The Collection of Sample
A total of 30 samples were collected from the market places, market and herbalist. The samples were taken at 50 sherd grams. In the case of the markets, the samples which are ready to be packed are taken. The samples have been protected as they are put into transparent bags.
2.2. The Preparation of Sample
The samples were prepared as 2 parallels for each sample and were solved by the wet burning method. For this purpose, one gram of the powdered sample washed and dried in a suitable manner is precisely weighed as 16 ml HNO3 (65%, w/w) and 4 ml HClO4 (70-72%, w/w) are added to it and the solution is slowly heated in the drawer for nearly 5-6 hours. The heating process close to the end of the acids is cut off and the solutions are cooled. Then 5 ml H2O2 (30%, w/w) was added and the heating was continued until the clear liquid was obtained. The heating was discontinued when the clear liquid was formed, and the solutions were left to cool. The cooling solutions were filtered through the blue band filter paper and 15 ml of the obtained solutions were mixed with the distilled water to prepare the analysis. The concentrations of the examined elements were determined by Flame Atomic Absorption Spectrometry.
2.3. The Preparation of Standard Solution
The definite-concentration certificated standards have been used. 1000 ppm standards have been used as the main stock. From the point of main stock solution as the study standards; it has been prepared in HNO3 setting of 2 M 65% and as to be 100 mL. The standard concentrations used when generating the calibration graphs are given in Table 1.
393
Table 1. Standard mixing solution concentrations which have been prepared for calibration graphics
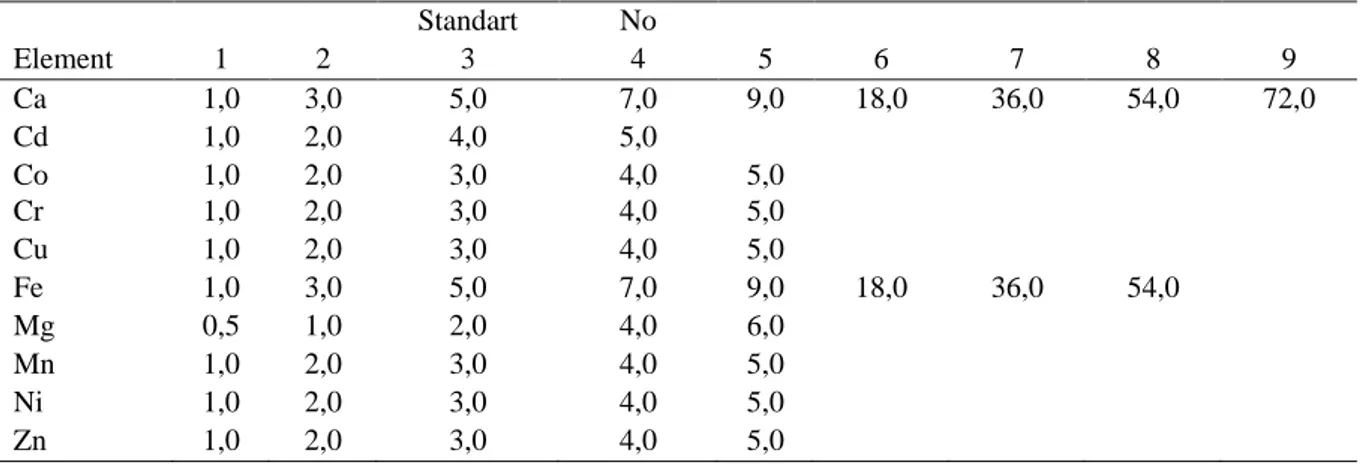
(ppm) Standart No Element 1 2 3 4 5 6 7 8 9 Ca 1,0 3,0 5,0 7,0 9,0 18,0 36,0 54,0 72,0 Cd 1,0 2,0 4,0 5,0 Co 1,0 2,0 3,0 4,0 5,0 Cr 1,0 2,0 3,0 4,0 5,0 Cu 1,0 2,0 3,0 4,0 5,0 Fe 1,0 3,0 5,0 7,0 9,0 18,0 36,0 54,0 Mg 0,5 1,0 2,0 4,0 6,0 Mn 1,0 2,0 3,0 4,0 5,0 Ni 1,0 2,0 3,0 4,0 5,0 Zn 1,0 2,0 3,0 4,0 5,0 3. RESULTS
The average concentrations of the samples are given in Table 2, 3, 4, 5, 6 and Figure 1, and 2. Copper is an essential element required for the proper functioning of many important enzyme systems. A copper level of 2 ppm in drinking-water should not cause any adverse effects and provides an adequate margin of safety[5]. Copper was detected in all analyzed sage tea samples and the average Cu concentration was in the range of 5,236–7,234 ppm. When assessed for the concentration of Cu in 30 samples; the highest Cu concentrations were found in the 2st sample taken from the herbalist: no. 3 (7,917ppm). The average Cu concentration of all samples was 6,467ppm.
According to the WHO, as regards health risks, inhaled nickel compounds are carcinogenic to humans and metallic nickel is possibly carcinogenic [6]. The average range of nickel concentrations in analyzed sage tea samples was 4,820–7,232 ppm. When assessed for the concentration of Ni in 30 sage tea samples; we obtained the highest content of nickel in sample taken from the market no: 6. The mean nickel concentration was 7,552 ppm.
Green vegetables and fresh cereals are the richest sources of cobalt (0,2–0,6 ppm dry mass) [7]. In the present study, looking at the Co concentration in the 30 sage tea samples; the highest concentration of Co was found in sample 2 (2,427 ppm) and taken from the markets. Cobalt was detected in all sage tea samples with an average concentration of 0,314 ppm.
The maximum limit for cadmium recommended by World Health Organisation correspond to 0,3 ppm [8]. Cadmium has a negative effect on enzymatic systems of cells with its ability to substitute for other metal ions (mainly Zn2 +, Cu2 + and Ca2 +) in metalloenzymes and has a strong affinity for biological structures containing sulfhydryl (− SH) groups, e.g. proteins, enzymes and nucleic acids [9, 10]. The average range of cadmium concentrations in analyzed sage tea samples was 0,194–0,482 ppm. The Cd concentration in 60% of the samples was above the permissible limits by WHO.
Mn are essential components of plant enzymes and are also important for plant growth, photosynthesis and respiration [11]. WHO has not established permissible limits for mineral elements because many of them are considered micronutrients. In a previous study, metal content of herbal teas for Mn has been reported to be 200 ppm [12]. Looking at the Mn concentration in the 30 sage tea samples, the lowest value of manganese was 20,78 ppm in the 2st sample taken from the market place no:1, whereas the highest level was 51,83 ppm in the sample taken from the market no:3.
394
Table 2. The average concentration of heavy metals in the 1st sample taken from the herbalist (ppm)
Sage Tea Zn Ni Cu Co Mn Cd Cr Fe Mg Ca 1 37,92 5,872 5,797 1,987 26,35 0,299 Not detected 323,5 2849 30254 2 39,74 5,513 5,931 2,002 26,82 0,403 “ 330,0 2924 30269 3 39,77 5,498 5,916 2,002 26,76 0,344 “ 331,7 2958 30090 4 40,90 5,642 3,622 1,901 27,00 0,329 “ 344,8 2840 29557 5 40,95 5,747 5,822 2,200 27,51 0,299 “ 348,1 2845 29617 6 41,53 5,208 5,986 2,065 27,55 0,344 “ 345,6 2852 29123 Average ±SD ±1,295 40,13 ±0,231 5,580 ±0,929 5,512 ±0,100 2,026 ±0,462 27,00 ±0,039 0,336 “ ±10,17 337,3 ±50,03 2878 ±460,2 29818 SD: Standard Deviation
Table 3. The average concentration of heavy metals in the 2st sample taken from the herbalist (ppm)
Sage Tea Zn Ni Cu Co Mn Cd Cr Fe Mg Ca 1 29,83 5,522 6,525 1,347 30,28 0,224 Not detected 180,8 1616 19276 2 34,11 5,852 7,468 2,035 29,93 0,299 “ 195,2 1687 19156 3 35,05 5,837 7,917 1,452 31,65 0,239 “ 207,3 1681 19156 4 27,34 4,812 7,046 1,679 26,47 0,300 “ 211,8 1697 18904 5 32,37 4,932 7,196 1,919 27,58 0,330 “ 221,0 1704 18754 6 33,24 5,082 7,166 1,799 30,76 0,240 “ 236,6 1697 18544 Average ±SD ±2,891 31,99 ±0,459 5,339 ±0,461 7,219 ±0,267 1,705 ±1,991 29,45 ±0,043 0,272 “ ±19,50 208,8 ,±32,49 1680 ±281,2 18965 SD: Standard Deviation
Table 4. The average concentration of heavy metals in the 1st sample taken from the market place (ppm)
Sage Tea Zn Ni Cu Co Mn Cd Cr Fe Mg Ca 1 23,29 4,831 4,367 1,122 31,09 0,165 Not detected 194,3 1205 12194 2 24,50 4,771 4,816 1,959 32,65 0,135 “ 211,0 1273 12028 3 24,08 4,696 4,860 1,361 33,05 0,209 “ 215,4 2655 12256 4 25,70 4,864 5,133 1,437 37,61 0,224 “ 193,1 1648 17375 5 29,77 4,849 6,211 1,302 37,14 0,195 “ 207,1 1646 17136 6 30,86 4,909 6,031 1,751 38,03 0,239 “ 214,6 1657 17136 Average ±SD ±3,176 26,36 ±0,076 4,820 ±0,730 5,236 ±0,309 1,489 ±3,005 34,93 ±0,039 0,194 “ ±9,931 205,9 ±518,4 1681 14687 ±2772 SD: Standard Deviation
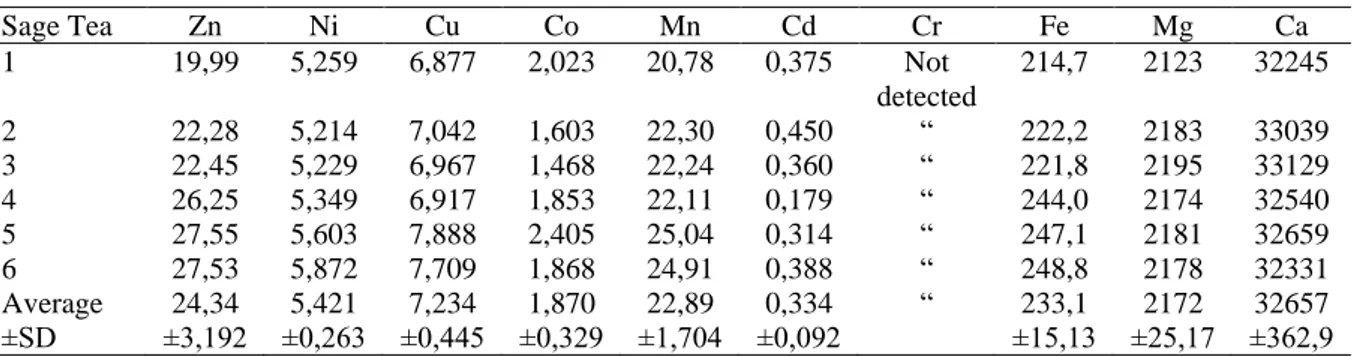
Table 5. The average concentration of heavy metals in the 2st sample taken from the market place (ppm)
Sage Tea Zn Ni Cu Co Mn Cd Cr Fe Mg Ca 1 19,99 5,259 6,877 2,023 20,78 0,375 Not detected 214,7 2123 32245 2 22,28 5,214 7,042 1,603 22,30 0,450 “ 222,2 2183 33039 3 22,45 5,229 6,967 1,468 22,24 0,360 “ 221,8 2195 33129 4 26,25 5,349 6,917 1,853 22,11 0,179 “ 244,0 2174 32540 5 27,55 5,603 7,888 2,405 25,04 0,314 “ 247,1 2181 32659 6 27,53 5,872 7,709 1,868 24,91 0,388 “ 248,8 2178 32331 Average ±SD 24,34 ±3,192 5,421 ±0,263 7,234 ±0,445 1,870 ±0,329 22,89 ±1,704 0,334 ±0,092 “ 233,1 ±15,13 2172 ±25,17 32657 ±362,9 SD: Standard Deviation
395
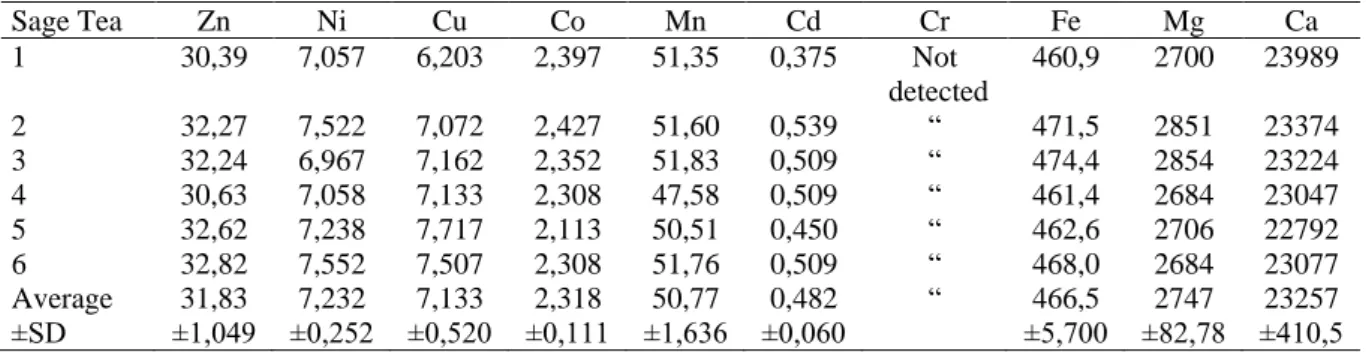
Table 6. Heavy metal averages of the sample taken from the market (ppm)
Sage Tea Zn Ni Cu Co Mn Cd Cr Fe Mg Ca 1 30,39 7,057 6,203 2,397 51,35 0,375 Not detected 460,9 2700 23989 2 32,27 7,522 7,072 2,427 51,60 0,539 “ 471,5 2851 23374 3 32,24 6,967 7,162 2,352 51,83 0,509 “ 474,4 2854 23224 4 30,63 7,058 7,133 2,308 47,58 0,509 “ 461,4 2684 23047 5 32,62 7,238 7,717 2,113 50,51 0,450 “ 462,6 2706 22792 6 32,82 7,552 7,507 2,308 51,76 0,509 “ 468,0 2684 23077 Average ±SD ±1,049 31,83 ±0,252 7,232 ±0,520 7,133 ±0,111 2,318 ±1,636 50,77 ±0,060 0,482 “ ±5,700 466,5 ±82,78 2747 ±410,5 23257 SD: Standard Deviation
Figure 1. Average heavy metal concentrations in sage tea samples
Figure 2. Average heavy metal concentrations in sage tea samples
The concentrations of essential metals such as Fe, Zn, Ni and Cr were generally found to be high, above the recommended daily allowances of 18 mg/day for Fe, and 15 mg/day for Zn as advised by the National Research Council [13]. Almost all the concoctions have relatively high levels of bioavailable metals such as Fe, Zn, Cr and Ca. Extremely high amounts of bioavailable Fe (474,4 ppm) were found in the 30 sage tea samples taken from the market no:3. The values determined were above the normal concentration but below the toxic concentration.
The average range of Ca concentration is 14687–32657 ppm. These values were found to be above the permissible normal concentration. Looking at the Mg concentration in the 30 sage
0,0 5000,0 10000,0 15000,0 20000,0 25000,0 30000,0 Fe Mg Ca Av erage co nc en trati on (p pm) Sage Tea 0 5 10 15 20 25 30 35 Zn Ni Cu Co Mn Cd Cr Av erage co nc en trati on (p pm) Sage Tea
396
tea samples, the lowest value of magnesium was 1205 ppm the 1st sample taken from the market place no:1, whereas the highest level was 2958 ppm in the 1st sample taken from the herbalist no:3.
Zinc is also a crucial element but drinking water containing Zn at levels above 3 ppm may not be acceptable to consumers [14]. In our study, Zn was detected in all samples in the average range of 24,34–40,13 ppm. Looking at the Zn concentration in the 30 samples; the highest Zn concentrations were found in the 1st sample taken from the herbalist no: 6 (41,53 ppm). Essential elements are known to have several beneficial properties, however, when taken in amounts above the recommended allowable range, they can be detrimental to health. Chromium element could not be detected in the samples.
4. DISCUSSION
The evaluation of the samples according to the studies done in the literature is given in Table 7. The results of the analyses were appointed to give the nutrient values per 1,000 g which were used as portion of dried weight. Table 7 shows the spacing and evaluation of the elements in all samples. When the results at the Table 7 are evaluated Co, Ni, Fe and Ca are found as over of the determined limits. Co, Ni, Fe element concentrations are more than the normal range but less than the toxic limits. Ca element concentration is above normal range. Cr element was not detected in the samples. Thirty sage tea samples, seized from street dealers in Ankara, Turkey, were determined by using FAAS after wet burning method. FAAS determination of trace elements in plants enables a rapid analysis with good precision and accuracy. Considering the low quantities of most elements in these samples, FAAS has a high detection power to analyze plant content. Moreover, analysis of multiple elements simultaneously is another important advantage of this method.
Table 7. Average element contents and evaluation in foodstuffs (ppm) [15, 16, 17, 18, 19, 20, 21]
Element Range Found Normal
Concentration Toxic Concentration Evaluation Co 1,489 – 2,318 0,05 -0,50 30 - 40 High Ni 4,820 – 7,232 0,10 -5,00 30,0 High Cr Not detected 0,10 -1,00 2,00 - Cu 5,236 – 7,234 3,00 – 15,0 20,0 Normal Zn 24,34 – 40,13 15,0 - 150 200 Normal Cd 0,194 – 0,482 1,00- 5,00 20,0 Normal Mn 22,89 – 50,77 15,0 - 100 400 Normal Fe 205,9 – 466,5 50,0 - 250 500 High Mg 1680 - 2878 250 - 3500 - Normal Ca 14687 - 32657 90 - 12000 - High
It is estimated that there are 300 thousand plants species which have seeds. WHO reported that 20 thousand of them are used in the medical purposes. Five hundred of them are cultivated and the rest of them is wild in the nature [22]. With the developing technology, people consume more processed food. As a result, the health problems have increased. Throughout the world, there is an increasing interest in the importance of dietary minerals in the prevention of several diseases. The minerals have the critical importance in the diet, even though they comprise only 4–6% of the human body. Most of the minerals are necessary in the amounts as being greater than 100 mg per day and they represent 1% or less of body weight. They include calcium, phosphorus, magnesium, sulfur, potassium, chloride and sodium. The trace minerals are essential in the smaller amounts, less than 100 mg per day, and comprise less than 0,01% of bodyweight. The necessary trace elements are zinc, iron, silicon, manganese, copper, fluoride, iodine and chromium. The major minerals serve as the structural components of tissues and
397
function in the cellular and basal metabolism and water and acid-base balance [23, 24, 25]. The chemical composition and mineral contents of 13 wild plants largely which were consumed in İçel (Mersin) the province were investigated [26]. Iron, zinc, manganese and copper contents were found as 396 ppm 35,4 ppm 92,1 ppm and 10,3 ppm, respectively.
5. CONCLUSION
In our study, Fe and Zn were higher than those of the previous studies, and Mn and Cu were lower. In another study, the mineral contents of 32 plants which were used as the condiments in Turkey were determined by ICP-AES. The heavy metal concentration range in the sage tea: Ca 672 ppm, Cd 0,51 ppm, Cr 1714 ppm, Cu 1,44 ppm, Fe 17,8 ppm [27]. In our study, Ca, Cu and Fe were higher than those of the previous studies, Cd were lower. Cr element was not designated in the publication. Calcium is the major component of bone and assists in the teeth’s development [28]. The Mg, Fe and P levels are adequate. The importance of these elements can not be over emphasized because many enzymes require them as the cofactors [29]. Other inorganic elements which may contribute to the biological processes, but which have not been determined as essential, are barium, bromine, cadmium, lead and lithium [23]. Cadmium and lead are the best known with their toxicological properties [30]. The daily mineral intake by consuming herbal teas for a 70 kg person and the reported amounts of minerals per day are 500 mg Ca, 300 mg Mg, 15 mg Fe, 5 mg Al, 2,8 mg Mn, 15 mg Zn, 2,5 mg Cu, 1,6 mg Sr, 1,1 mg Ba, 0,025 mg Ni, 0,05–0,2 mg Cr, 0,04 mg Co, 0,415 mg Pb and 0,057 mg Cd [31]. The wide variation in metallic concentrations in the analyzed herbs could be attributed to differences in the plant metal uptake and translocation capabilities. Metal uptake by plants depends on several factors including the plant species and their stage of grown, soil characteristics and geo-environmental conditions (e.g. pH, oxidation-reduction potential), climatic conditions, anthropogenic activities (polluted, industrial areas), etc. [32]. The prevention of heavy metal pollution should primarily identify contamination sources. These sources must be eliminated and the environmental exposure and traceability of hazard situations must be ensured.
Acknowledgement
This publication has been taken from the master thesis work done by Ayşe Uğuz.
Conflict of Interests
Authors declare that there is no conflict of interests.
6. REFERENCES
[1] Şarışen, Ö., & Çalışkan, D. (2005). Fitoterapi: Bitkilerle Tedaviye Dikkat (!). Sted, 14(8), 182-187.
[2] Kızılkeçili, Ö. (2007). Salvia crypthanta montbret & auchr ex bentham ve salvia pomifera l. türlerinin metanol, etanol ekstrelerinin ve uçucu yağlarının antibakterial, antifungal ve antitüberküloz aktivitelerinin tayini.
[3] Arpadjan, S., Celik, G., Taşkesen, S., & Güçer, Ş. (2008). Arsenic, cadmium and lead in medicinal herbs and their fractionation. Food and chemical toxicology, 46(8), 2871-2875. [4] Ozturk, B. Y., Akkoz, C., Asikkutlu, B., & Gümüş, N. E. (2014). Fuzzy Logic Evaluation
of Heavy Metal Pollution of Apa Dam Lake. Journal of Applied Biological Sciences, 8(3), 14-20.
[5] World Health Organization. (2004). International statistical classification of diseases and
related health problems (Vol. 1). World Health Organization.
[6] World Health Organization. (2004). The WHO recommended classification of pesticides by hazard and guidelines to classification: 2004.
398
[7] International Agency for Research on Cancer. (1991). Chlorinated drinking-water, chlorination by-products, some other halogenated compounds, cobalt and cobalt compounds. In Chlorinated drinking-water, chlorination by-products, some other
halogenated compounds, cobalt and cobalt compounds.
[8] World Health Organization. (1999). WHO monographs on selected medicinal plants (Vol. 2). World Health Organization.
[9] Jacobson, K. B., & Turner, J. E. (1980). The interaction of cadmium and certain other metal ions with proteins and nucleic acids. Toxicology, 16(1), 1-37.
[10] Stohs, S. J., & Bagghi, D. (2005). Oxidative Mechanisms in the Toxicity of Metal Ions.
Free Radical Biology and Medicine, 39(10), 1267-1268.
[11] Abou-Arab, A. A. K., Kawther, M. S., El Tantawy, M. E., Badeaa, R. I., & Khayria, N. (1999). Quantity estimation of some contaminants in commonly used medicinal plants in the Egyptian market. Food Chemistry, 67(4), 357-363.
[12] Markert, B. (1994). Plants as biomonitors-potential advantages and problems.
Environmental Geochemistry and Health (United Kingdom).
[13] Hina, B., Rizwani, G. H., & Naseem, S. (2011). Determination of toxic metals in some herbal drugs through atomic absorption spectroscopy. Pakistan journal of pharmaceutical
sciences, 24(3).
[14] Musa, U., Waziri, M., & Hati, S. S. (2013). Explanatory Interaction Profile of Cd, Pb and Zn on the Relative Abundance of Fe as Response Variable in Drinking Water Quality Assessment. International Research Journal of Pure and Applied Chemistry, 3(4), 404. [15] Kabata-Pendias, A., & Mukherjee, A. B. (2007). Trace elements from soil to human.
Springer Science & Business Media.
[16] Stanojkovic-Sebic, A., Pivic, R., Josic, D., Dinic, Z., & Stanojkovic, A. (2015). Heavy Metals Content in Selected Medicinal Plants Commonly Used as. Tarım Bilimleri Dergisi,
21(3), 317-325.
[17] Kastori, R., Petrović, N., & Arsenijević-Maksimović, I. (1997). Heavy metals and plants.
Heavy Metals in the Environment, Novi Sad, 195-257.
[18] Kloke, A., Sauerbeck, D. R., & Vetter, H. (1984). The contamination of plants and soils with heavy metals and the transport of metals in terrestrial food chains. In Changing metal
cycles and human health (pp. 113-141). Springer, Berlin, Heidelberg.
[19] Misra, S. G., & Mani, D. (1991). Soil pollution. Ashish Publishing House. [20] Schulze, E. D., Beck, E., & Müller-Hohenstein, K. (2005). Plant ecology.
[21] Set, E., & Erkmen, O. (2014). Occurrence of aflatoxins in ground red chili pepper and pistachio nut. International journal of food properties, 17(10), 2322-2331.
[23] Macrae, R., Robinson, R. K., & Sadler, M. J. (1993). Encyclopaedia of food science, food technology and nutrition.
[24] Nielsen, F. H. (1984). Ultratrace elements in nutrition. Annual review of nutrition, 4(1), 21-41.
[25] Fairweather-Tait, S. J. (1992). Bioavailability of trace elements. Food Chemistry, 43(3), 213-217.
[26] Ozcan, M., Bagci, Y. A., & Dural, H. (1998). Chemical composition and mineral contents of edible wild plants consumed in Içel (Mersin). SU Sci. J, 15, 72-77.
[27] Özcan, M. (2004). Mineral contents of some plants used as condiments in Turkey. Food
399
[28] Jabeen, S., Shah, M. T., Khan, S., & Hayat, M. Q. (2010). Determination of major and trace elements in ten important folk therapeutic plants of Haripur basin, Pakistan. Journal
of Medicinal Plants Research, 4(7), 559-566.
[29] Akpanabiatu, M. I., Bassey, N. B., Udosen, E. O., & Eyong, E. U. (1998). Evaluation of some minerals and toxicants in some Nigerian soup meals. Journal of Food Composition
and Analysis, 11(4), 292-297.
[30] Macrae, R., Robinson, R. K., & Sadler, M. J. (1993). Encyclopaedia of food science, food technology and nutrition.
[31] Başgel, S., & Erdemoğlu, S. B. (2006). Determination of mineral and trace elements in some medicinal herbs and their infusions consumed in Turkey. Science of the Total
Environment, 359(1), 82-89.
[32] Dghaim, R., Al Khatib, S., Rasool, H., & Ali Khan, M. (2015). Determination of heavy metals concentration in traditional herbs commonly consumed in the United Arab Emirates. Journal of environmental and public health, 2015.
![Table 7. Average element contents and evaluation in foodstuffs (ppm) [15, 16, 17, 18, 19, 20, 21]](https://thumb-eu.123doks.com/thumbv2/9libnet/4561467.83312/6.892.113.785.664.882/table-average-element-contents-evaluation-foodstuffs-ppm.webp)
