https://doi.org/10.1007/s12210-017-0664-5
The classification of some plants subjected to disturbance factors
(grazing and cutting) based on ecological strategies in Turkey
Dudu Duygu Kılıç1 · Hamdi Güray Kutbay2 · Burak Sürmen3 · Rena Hüseyinoğlu4Received: 8 June 2017 / Accepted: 22 December 2017 / Published online: 9 January 2018 © Accademia Nazionale dei Lincei 2018
Abstract
The effect of disturbance factors such as grazing and cutting were investigated in some plants in central Black Sea Region of Turkey using Grime’s CSR strategies and Ellenberg’s indicator values (EIVs). Grime’s CSR strategies were also determined by Pierce et al.’s (Funct Ecol 27:1002–1010, 2013) scheme because there were some inconsistencies between Grime’s and Pierce et al.’s schemes. Secondary strategies in the study area found to be dominant and the dominance of secondary strategies are consistent with “intermediate disturbance hypothesis”. All the EIVs were found to be significantly different in grazed vs non-ungrazed and cutted vs uncutted areas. PCA diagram showed that ungrazed and cutted areas are associated with EIVR, while grazed and uncutted plots are associated with EIVL, EIVM, EIVN and EIVT.
Keywords Autecological plant traits · Central Black Sea Region · CSR strategies · Intermediate disturbance hypothesis · Principal component analysis (PCA) · Secondary strategies
1 Introduction
Grime’s CSR (competitive (C), stress-tolerant (S), and rud-eral (R) theory has been used for a long time in autecologi-cal studies because the proportion of species which exhibit different strategies is likely to change within vegetation in response to changing land use (Hodgson 1991). Grazing and
cutting are the two main disturbance factors which derived from natural and antropogenical events may cause complex-ity and instabilcomplex-ity in species interactions (Fakhireh et al.
2012; Hüseyinova et al. 2013; Xu et al. 2016). Disturbance intensity and time are of particular importance because these factors creating diverse opportunities for establishment, growth and reproduction of a particular species (Pierce et al.
2007; Duru et al. 2010; Frenette-Dussault et al. 2012). Ellenberg indicator values (EIVs) are used as an empiri-cal tool to express the ecologiempiri-cal response of plants to the environmental factors. EIVs are also widely used for the determination of plant functional traits and the evaluation of disturbance factors (Dzwonko 2001; Zelený and Schaffers
2011; Sürmen et al. 2014; Marceno and Guarino 2015; Del Vecchio et al. 2015). The main criteria used in Ellenberg’s system are L (light), T (temperature), M (soil moisture), R (soil reaction), N (soil nitrogen concentration) and they are ordered from 1 to 9 (1–12 for moisture) scale (Pignatti et al.
2001; Testi et al. 2004; Crosti et al. 2010). This study is aimed to classify some plant species which are subjected to disturbance factors (grazing and cutting) in central Black Sea Region of Turkey using Grime’s CSR classification scheme to find a better explanation of Grime’s and Ellenberg’s strat-egies and the underlying mechanisms. Pierce et al. (2013) made some revisions on the original Grime’s system because Grime’s classification scheme has some deficiencies. For
* Burak Sürmen
buraksurmen@gmail.com Dudu Duygu Kılıç drduygukilic@gmail.com Hamdi Güray Kutbay hguray@omu.edu.tr Rena Hüseyinoğlu renah13@gmail.com
1 Department of Biology, Faculty of Science and Arts, Amasya University, Amasya, Turkey
2 Department of Biology, Faculty of Science and Arts, Ondokuz Mayıs University, 55139 Kurupelit, Samsun, Turkey
3 Department of Biology, Kamil Ozdag Science Faculty, Karamanoglu Mehmetbey University, 70200 Karaman, Turkey
4 Şebinkarahisar Vocational School, Giresun University, Giresun, Turkey
example, flowering period and flowering time may change over years and they may probably be changed depending on the phenological development of a particular species. Therefore, plants species in grazed vs ungrazed and cutted vs uncutted areas were also classified according to Pierce et al.’s (2013) scheme. Ellenberg’s indicator values (EIVs) describe the response of a species to edaphic and climatical parameters and ecological requirements of species across their distribution area (Coban 2016). Therefore, plant spe-cies were also classified using Ellenberg’s indicator values (EIVs) to discuss the effects of disturbance factors.
2 Materials and methods
The study area is located in Yeşilırmak basin (Amasya city) in the central region of Turkey (40°39′03.35″N and 35°56′45.23″E) (Fig. 1). The mean annual temperature and the mean annual precipitation are 13.9 °C and 397.5 mm, respectively. The maximum mean temperature is 31.7 °C (August), while the lowest mean temperature is − 0.6 °C (January). The study area is located in a semi-arid and transitional-type climatic belt and it is a transitional area between oceanic and continental climates. Mediterranean
climate can also be seen locally; therefore, the vegetation is a mix of Euxine, Irano-Turanian and Mediterranean spe-cies. The study area is dominated by chestnut-colored, a soil which is formed by calcification process. Goat, sheep and cow grazing is widespread in the study area. The number of goats, sheep and cows is 1870, 860 and 800, respectively. Irregular cutting is performed in the study area for lumber-ing (Turkish Republic of Ministry of Agriculture, Forestry and Rural Affairs 1991).
In the grazed areas, unpalatable and thorny species such as Acantholimon acerosum var. acerosum, Achillea setacea, Carduus pycnocephalus subsp. albidus, Globularia tricho-santha are dominant, while the ungrazed areas are character-ized by Avena eriantha, Capsella bursa-pastoris, Hordeum vulgare, Taraxacum officinale, and Urtica dioica. The cutted areas are characterized by Cerasus mahaleb (L.) Miller var. mahaleb (L.) Miller, Cistus creticus L., Colutea arborescens L., Cruciata taurica (Pallas ex Willd.) Ehrend, Jasminum fru-ticans L., Pistacia terebinthus L. subsp. palaestina (Boiss.) Engler, Polygala pruinosa Boiss. subsp. pruinosa Boiss., Vicia narbonensis L., while uncutted areas are dominated by Arbu-tus andrachne L., Globularia trichosantha Fisch., Quercus petraea (Mattuschka) Liebl., Quercus hartwissiana Steven, Amelanchier rotundifolia (Lam.) Dum.-Courset, Phillyrea
latifolia L., Juniperus oxycedrus L. subsp. oxycedrus, Euphor-bia szovitsii Fisch.&Mey., E. rigida Bieb., Marrubium vul-gare L., Veronica jacquinii Baumg., Coronilla scorpioides (L.) Koch, Helianthemum nummularium (L.) Miller subsp. nummularium (L.) Miller.
The grazed, ungrazed, cutted, and uncutted regions cover a 10 ha−1 area. Four permanent plots (20 m × 20 m) were
established at 5 m distance in cutted and uncutted areas. Three sampling plots (20 m × 20 m) were selected in grazed and ungrazed areas. In each plot, five sampling quadrates (50 cm × 50 cm) were randomly selected and the distance between quadrants was at least 0.5 m from the margin to pre-vent edge effects in grazed and ungrazed areas (Dzwonko and Loster 1998; Li et al. 2011).
Some of the soil traits [soil EIVM (moisture), EIVR (soil reaction) and EIVN (soil nitrogen concentration)] were calculated from the analysis of soil samples. The results of soil analysis were adapted to Ellenberg’s 1–9 (1–12 for moisture) scale. They were calculated between EIV plot averages and relevant environmental variables measured (Balković et al. 2012; Janišová et al. 2012). Ten soil samples were taken at a depth of 35 cm using a soil corer. The samples were then brought to the labora-tory in polyethylene bags. After which the soil samples were air dried and sieved through a 2 mm mesh prior to analysis. Soil pH values were measured using deionised water (1:1). Soil nitrogen was determined by the way of micro-Kjeldahl method. Moisture was determined by the gravimetric method (Bayrakli 1987; Kutbay and Ok 2003). EIVL (light) was determined using a Lutron Light Meter LX-1102 (Schuster and Diekmann 2005). EIVT (temper-ature) values were calculated using original Ellenberg’s scale (Pignatti et al. 2001).
The mean Grime’s CSR values were determined using an Excel program (Grime et al. 1998; Grime 2002; Hodgson et al.
1999; Hüseyinova et al. 2013). Pierce et al. (2013) made some revisions on original Grime’s classification due to some defi-ciencies in the determination of some criteria. For example, Grime’s system is usually used for herbaceous species and the flowering period and flowering start may change pheno-logically. Accordingly, the species in the present study were also classified according to Pierce et al.’s (2013) classification scheme.
A cover-abundance value for each species in each plot was determined. Mean Ellenberg indicator values for light (L),
nitrogen (N), soil pH (R), moisture (M), and temperature (T) were calculated for each quadrant using weighted average of each plot indicator values (Kasprowicz 2010; Spratt et al.
2011; Sürmen et al. 2014). EIVs were calculated using the weighted average formula:
where ‘rij’ is the response of species, ‘i’i. species in sample
plot ‘j’, and ‘xi’ is the indicator value of species ‘i’.
Afterwards, the data were subjected to a PCA analysis to determine the species distribution along EIVs in grazed vs ungrazed and cutted vs uncutted areas. One-way ANOVA test was applied to find if there were significant differences among EIVs in grazed vs ungrazed and cutted vs uncutted areas. The data were also subjected to post hoc (Tukey’s HSD) test for rank of the means (IBM Corporation 2012). Taxonomic nomenclature followed that of Guner et al. (2012).
3 Results
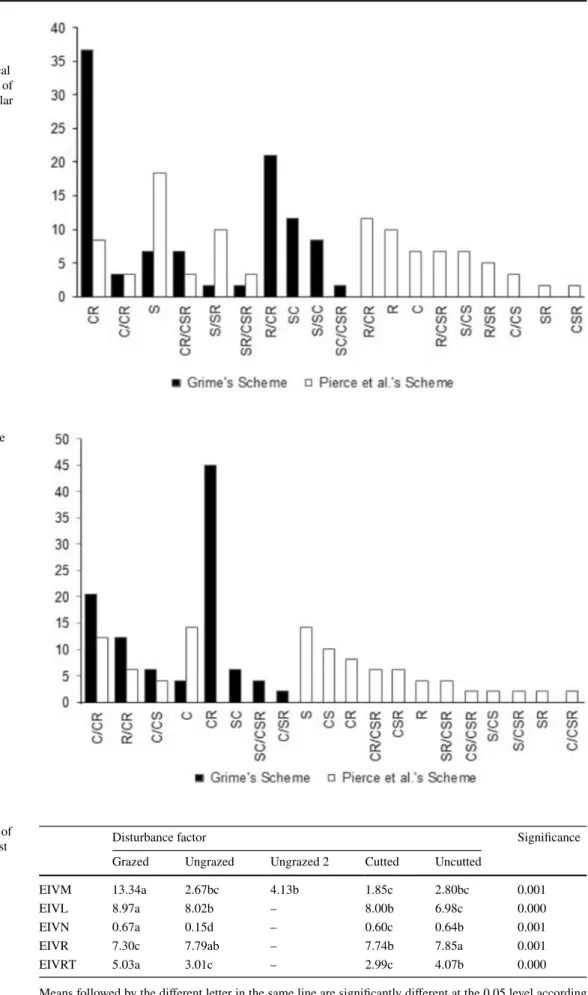
CR strategy was found to be the dominant in cutted and uncutted areas according to Grime’s scheme, while S strat-egy was found to be the dominant one in cutted and uncutted areas according to Pierce et al.’s (2013) scheme (Tables 1,
2; Figs. 2, 3). The same results also found in the grazed and ungrazed areas (Tables 3, 4; Figs. 4, 5). Most species exhibit different strategies according to Grime’s and Pierce et al.’s (2013) schemes. Only a few species exhibit similar strategy according to Grime et al. (1998) and Pierce et al. (2013) schemes. S-strategists were dominant according to Grime et al.’s (1998) scheme, while S/CSR-strategists were the dominant after cutting according to Pierce et al. (2013) scheme (Figs. 2, 3). Similarly, S-strategists become dominant according to Pierce et al.’s (2013) scheme, while CR strategists become dominant after grazing according to Grime et al.’s scheme (1998) (Figs. 4, 5).
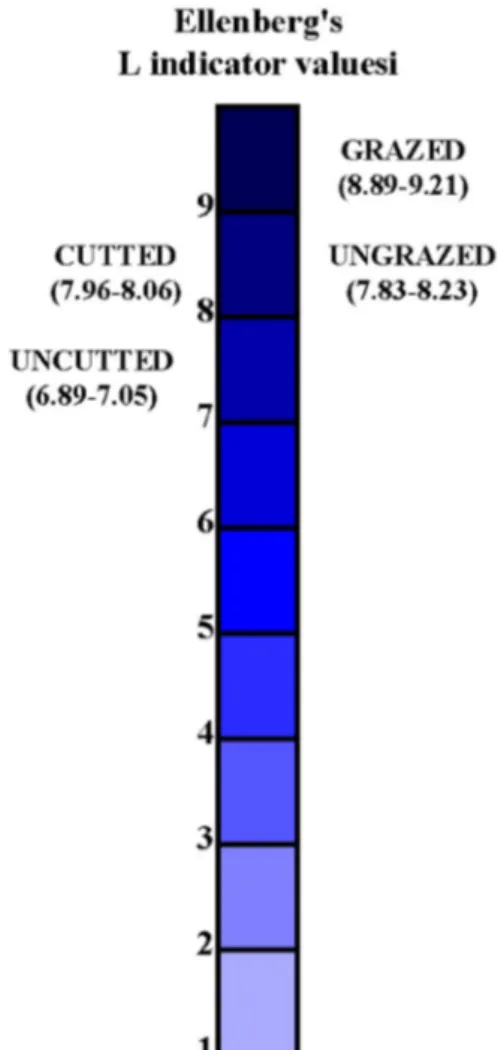
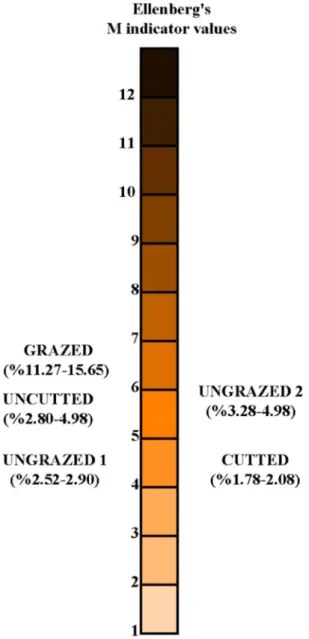
All of EIVs were significantly different among areas (grazed vs ungrazed and cutted vs uncutted) and the grazed areas had the highest EIVs. However, EIVR val-ues which were the highest in ungrazed and uncutted areas (Table 5). The highest EIVL values were found in grazed (1) Weighted average= n ∑ i=1 (rij× xi)∕ n ∑ i=1 rij
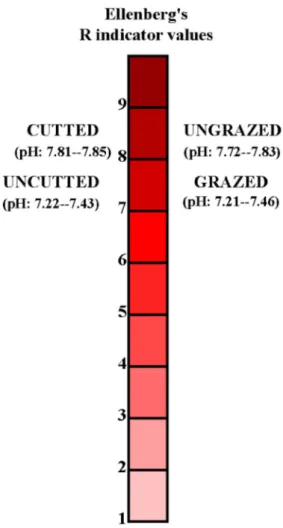
areas, while the lowest EIVL values were found in uncut-ted areas (Fig. 6). EIVM values ranged from 2.52 to 4.98 in ungrazed areas, while they ranged from 11.27 to 15.65 in grazed areas (Fig. 7). EIVM values ranged from 1.78 to 2.08 and 2.80 to 4.98 in cutted and uncutted areas, respec-tively (Fig. 7). EIVN values were from 0.66 to 0.72 in grazed areas, while 0.13 to 0.19 in ungrazed areas. EIVN
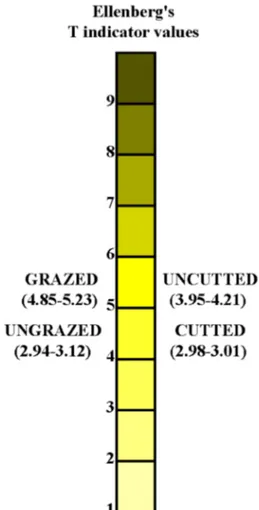
values ranged from 0.59 to 0.62 and 0.66 to 0.72 in cutted and uncutted areas, respectively (Fig. 8). The differences in EIVR values were very small, however, the highest and the lowest EIVR value was found in the grazed and cutted areas, respectively (Fig. 9). EIVT values ranged from 2.98 to 3.01 in cutted areas, and 3.95 to 4.21 in uncutted areas. EIVT values ranged from 2.94 to 3.12 and 4.85 to 5.23 in
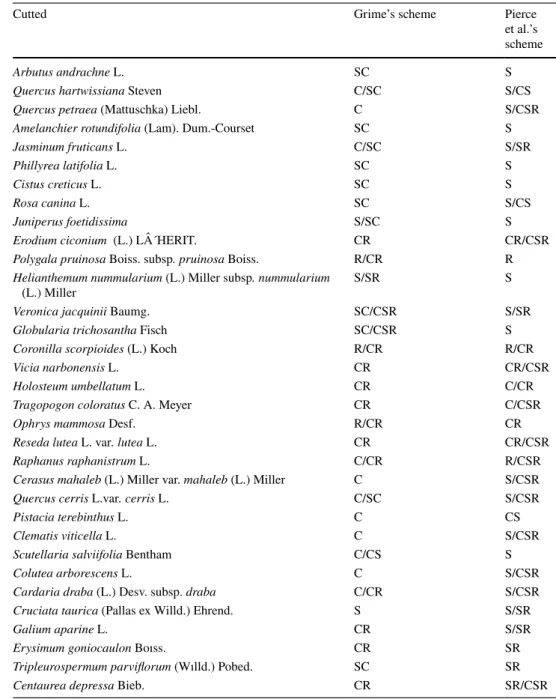
Table 1 The species in cut areas according to Grime et al.’s and Pierce et al.’s schemes
Cutted Grime’s scheme Pierce
et al.’s scheme
Arbutus andrachne L. SC S
Quercus hartwissiana Steven C/SC S/CS
Quercus petraea (Mattuschka) Liebl. C S/CSR
Amelanchier rotundifolia (Lam). Dum.-Courset SC S
Jasminum fruticans L. C/SC S/SR
Phillyrea latifolia L. SC S
Cistus creticus L. SC S
Rosa canina L. SC S/CS
Juniperus foetidissima S/SC S
Erodium ciconium (L.) L´HERIT. CR CR/CSR
Polygala pruinosa Boiss. subsp. pruinosa Boiss. R/CR R Helianthemum nummularium (L.) Miller subsp. nummularium
(L.) Miller S/SR S
Veronica jacquinii Baumg. SC/CSR S/SR
Globularia trichosantha Fisch SC/CSR S
Coronilla scorpioides (L.) Koch R/CR R/CR
Vicia narbonensis L. CR CR/CSR
Holosteum umbellatum L. CR C/CR
Tragopogon coloratus C. A. Meyer CR C/CSR
Ophrys mammosa Desf. R/CR CR
Reseda lutea L. var. lutea L. CR CR/CSR
Raphanus raphanistrum L. C/CR R/CSR
Cerasus mahaleb (L.) Miller var. mahaleb (L.) Miller C S/CSR
Quercus cerris L.var. cerris L. C/SC S/CSR
Pistacia terebinthus L. C CS
Clematis viticella L. C S/CSR
Scutellaria salviifolia Bentham C/CS S
Colutea arborescens L. C S/CSR
Cardaria draba (L.) Desv. subsp. draba C/CR S/CSR
Cruciata taurica (Pallas ex Willd.) Ehrend. S S/SR
Galium aparine L. CR S/SR
Erysimum goniocaulon Boıss. CR SR
Tripleurospermum parviflorum (Wılld.) Pobed. SC SR
ungrazed and grazed areas, respectively (Fig. 10). In grazed areas, EIVF, EIVL, EIVN, and EIVT values were found to be high, while in the cutted areas EIVR values were found to be high. The lowest EIVF and EIVT values were found in cutted areas, while the lowest EIVL and EIVR values
were found in uncutted areas. Ungrazed areas had the lowest EIVN values. Ellenberg’s L and R values were found to be high, while F and T values were at the mean range.
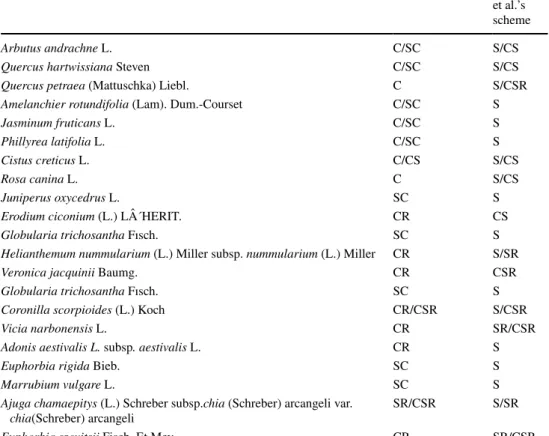
Table 2 The species in uncutted areas according to Grime et al.’s and Pierce et al.’s schemes
Non-cutted Grime’s scheme Pierce
et al.’s scheme
Arbutus andrachne L. C/SC S/CS
Quercus hartwissiana Steven C/SC S/CS
Quercus petraea (Mattuschka) Liebl. C S/CSR
Amelanchier rotundifolia (Lam). Dum.-Courset C/SC S
Jasminum fruticans L. C/SC S
Phillyrea latifolia L. C/SC S
Cistus creticus L. C/CS S/CS
Rosa canina L. C S/CS
Juniperus oxycedrus L. SC S
Erodium ciconium (L.) L´HERIT. CR CS
Globularia trichosantha Fısch. SC S
Helianthemum nummularium (L.) Miller subsp. nummularium (L.) Miller CR S/SR
Veronica jacquinii Baumg. CR CSR
Globularia trichosantha Fısch. SC S
Coronilla scorpioides (L.) Koch CR/CSR S/CSR
Vicia narbonensis L. CR SR/CSR
Adonis aestivalis L. subsp. aestivalis L. CR S
Euphorbia rigida Bieb. SC S
Marrubium vulgare L. SC S
Ajuga chamaepitys (L.) Schreber subsp.chia (Schreber) arcangeli var.
chia(Schreber) arcangeli SR/CSR S/SR
Euphorbia szovitsii Fisch. Et Mey. CR SR/CSR
Fig. 2 The classification of the species according to Grime et al.’s and Pierce et al.’s schemes in cutted areas (X-axis: ecological
strate-gies; Y-axis: the number of species belonging to a particular strategy) Fig. 3 The classification of the species according to Grime et al.’s and Pierce et al.’s scheme in uncutted areas (X-axis: ecological strate-gies; Y-axis: the number of species belonging to a particular strategy)
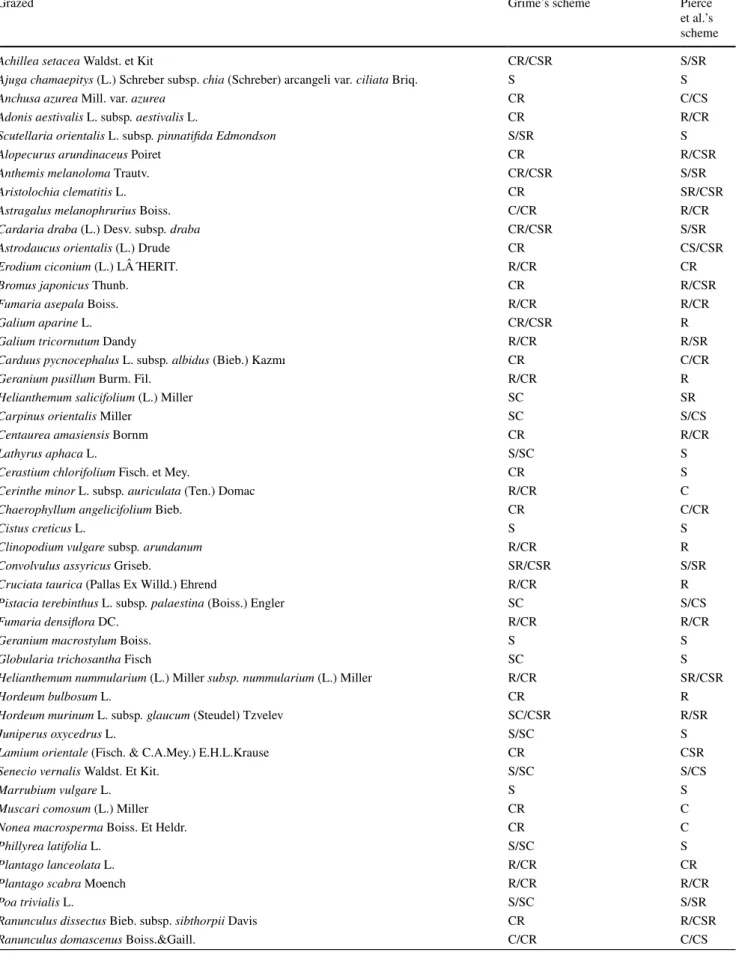
Table 3 The species in grazing areas according to Grime et al.’s and Pierce et al.’s schemes
Grazed Grime’s scheme Pierce
et al.’s scheme
Achillea setacea Waldst. et Kit CR/CSR S/SR
Ajuga chamaepitys (L.) Schreber subsp. chia (Schreber) arcangeli var. ciliata Briq. S S
Anchusa azurea Mill. var. azurea CR C/CS
Adonis aestivalis L. subsp. aestivalis L. CR R/CR
Scutellaria orientalis L. subsp. pinnatifida Edmondson S/SR S
Alopecurus arundinaceus Poiret CR R/CSR
Anthemis melanoloma Trautv. CR/CSR S/SR
Aristolochia clematitis L. CR SR/CSR
Astragalus melanophrurius Boiss. C/CR R/CR
Cardaria draba (L.) Desv. subsp. draba CR/CSR S/SR
Astrodaucus orientalis (L.) Drude CR CS/CSR
Erodium ciconium (L.) L´HERIT. R/CR CR
Bromus japonicus Thunb. CR R/CSR
Fumaria asepala Boiss. R/CR R/CR
Galium aparine L. CR/CSR R
Galium tricornutum Dandy R/CR R/SR
Carduus pycnocephalus L. subsp. albidus (Bieb.) Kazmı CR C/CR
Geranium pusillum Burm. Fil. R/CR R
Helianthemum salicifolium (L.) Miller SC SR
Carpinus orientalis Miller SC S/CS
Centaurea amasiensis Bornm CR R/CR
Lathyrus aphaca L. S/SC S
Cerastium chlorifolium Fisch. et Mey. CR S
Cerinthe minor L. subsp. auriculata (Ten.) Domac R/CR C
Chaerophyllum angelicifolium Bieb. CR C/CR
Cistus creticus L. S S
Clinopodium vulgare subsp. arundanum R/CR R
Convolvulus assyricus Griseb. SR/CSR S/SR
Cruciata taurica (Pallas Ex Willd.) Ehrend R/CR R
Pistacia terebinthus L. subsp. palaestina (Boiss.) Engler SC S/CS
Fumaria densiflora DC. R/CR R/CR
Geranium macrostylum Boiss. S S
Globularia trichosantha Fisch SC S
Helianthemum nummularium (L.) Miller subsp. nummularium (L.) Miller R/CR SR/CSR
Hordeum bulbosum L. CR R
Hordeum murinum L. subsp. glaucum (Steudel) Tzvelev SC/CSR R/SR
Juniperus oxycedrus L. S/SC S
Lamium orientale (Fisch. & C.A.Mey.) E.H.L.Krause CR CSR
Senecio vernalis Waldst. Et Kit. S/SC S/CS
Marrubium vulgare L. S S
Muscari comosum (L.) Miller CR C
Nonea macrosperma Boiss. Et Heldr. CR C
Phillyrea latifolia L. S/SC S
Plantago lanceolata L. R/CR CR
Plantago scabra Moench R/CR R/CR
Poa trivialis L. S/SC S/SR
Ranunculus dissectus Bieb. subsp. sibthorpii Davis CR R/CSR
Species and environment scores in canonical axis 1 and 2 were found to be significant. Eigenvalues were explained 80 and 91% of the cumulative variance, respectively. Ellen-berg’s M, R, and T values were found to be significant on axis 1, while Ellenberg’s L- and N-values were found to be significant on axis 2 (Table 6). According to PCA diagram, EIVR was situated on the positive site, while EIVL, EIVM, EIVN and EIVT were situated on the negative site of the PCA diagram. Ungrazed and cutted areas were associated with EIVR, while grazed and uncutted areas were associated with EIVL, EIVM, EIVN and EIVT (Fig. 11).
4 Discussion
There were some inconsistencies between Grime et al. (1998) and Pierce et al.’s (2013) schemes. For example, according to Pierce et al.’s (2013) scheme pure R-strategists were represented, while R-strategists were not represented after cutting and grazing according to Grime et al. (1998) scheme. Ruderal strategists are also called “colonists”. They are characterized by rapid germination, short life cycle, early flowering and for allocating many of their resources to reproduction and are very resistant to disturbance factors such as grazing. R-strategists usually colonize in bare areas due to the abundance of microsites (Pywell et al. 2003). It
has been reported that there is a close relationship between competition and disturbance tolerance (Xu et al. 2016). As a result of all of these factors, R-strategists represented with a high proportion in disturbed areas. Similarly, pure C-strat-egy was found in grazed and ungrazed areas according to Grime et al.’s (1998) scheme, while C-strategy was not found in both cutted and uncutted areas according to Pierce et al.’s (2013) scheme. Pure C-strategy was also represented before and after cutting according to Grime et al.’s (1998) scheme. Moog et al. (2005) reported that C-strategists were found in grazed areas and this is in accordance with the moderate grazing favored species with intermediate levels of competitiveness, stress tolerance and rurality. The cutting of trees does not suffice in maintaining homogeneous and species-rich grassland communities. As a result permanent grazing gaps are formed and grassland species are recolo-nized (Dzwonko and Loster 1998). Quercus petraea (Mat-tuschka) Liebl., Cerasus mahaleb (L.) Miller var. mahaleb (L.) Miller, and Colutea arborescens L. exhibit C-strategy in the study area. These species are canopy species and have a good ability to receive light as compared to subcanopy spe-cies. Niche complementarity increased with an increase in the competition for light (Chai et al. 2016).
It has been found that the number of S-strategists increased after grazing according to Pierce et al.’s (2013) scheme, while the number of S-strategists decreased in
Table 3 (continued)
Grazed Grime’s scheme Pierce
et al.’s scheme
Ranunculus repens L. R/CR CR
Roemeria hybrida (L.) Dc. subsp. hybrida CR CR/CSR
Silene alba (Miller) Krause subsp. eriocalycina (Boiss.) Walters CR CR
Stellaria holostea L. CR R
Thlaspi arvense L. SC S
Torilis leptophylla (L.) Reiche CR S/CS
Tragopogon coloratus C. A. Meyer CR R/SR
Trifolium hybridum L. var. anatolicum (Boiss.) Boiss. CR R/CSR
Valeriana pumila Willd. SC C
Veronica jacquinii Baumg. SC S/SR
Vicia sativa L. subsp. sativa L. CR CR
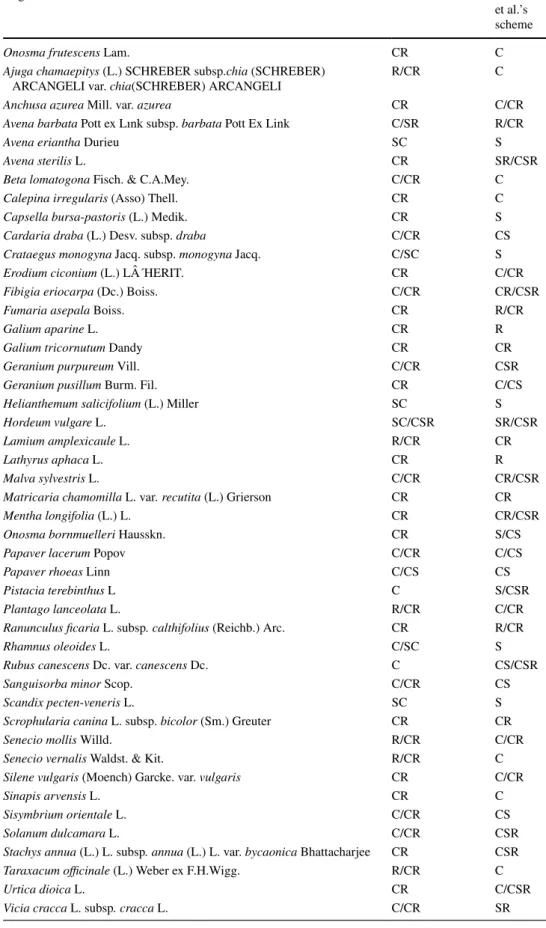
Table 4 The species in ungrazed areas according to Grime et al.’s and Pierce et al.’s schemes
Ungrazed Grime’s scheme Pierce
et al.’s scheme
Onosma frutescens Lam. CR C
Ajuga chamaepitys (L.) SCHREBER subsp.chia (SCHREBER)
ARCANGELI var. chia(SCHREBER) ARCANGELI R/CR C
Anchusa azurea Mill. var. azurea CR C/CR
Avena barbata Pott ex Lınk subsp. barbata Pott Ex Link C/SR R/CR
Avena eriantha Durieu SC S
Avena sterilis L. CR SR/CSR
Beta lomatogona Fisch. & C.A.Mey. C/CR C
Calepina irregularis (Asso) Thell. CR C
Capsella bursa-pastoris (L.) Medik. CR S
Cardaria draba (L.) Desv. subsp. draba C/CR CS
Crataegus monogyna Jacq. subsp. monogyna Jacq. C/SC S
Erodium ciconium (L.) L´HERIT. CR C/CR
Fibigia eriocarpa (Dc.) Boiss. C/CR CR/CSR
Fumaria asepala Boiss. CR R/CR
Galium aparine L. CR R
Galium tricornutum Dandy CR CR
Geranium purpureum Vill. C/CR CSR
Geranium pusillum Burm. Fil. CR C/CS
Helianthemum salicifolium (L.) Miller SC S
Hordeum vulgare L. SC/CSR SR/CSR
Lamium amplexicaule L. R/CR CR
Lathyrus aphaca L. CR R
Malva sylvestris L. C/CR CR/CSR
Matricaria chamomilla L. var. recutita (L.) Grierson CR CR
Mentha longifolia (L.) L. CR CR/CSR
Onosma bornmuelleri Hausskn. CR S/CS
Papaver lacerum Popov C/CR C/CS
Papaver rhoeas Linn C/CS CS
Pistacia terebinthus L C S/CSR
Plantago lanceolata L. R/CR C/CR
Ranunculus ficaria L. subsp. calthifolius (Reichb.) Arc. CR R/CR
Rhamnus oleoides L. C/SC S
Rubus canescens Dc. var. canescens Dc. C CS/CSR
Sanguisorba minor Scop. C/CR CS
Scandix pecten-veneris L. SC S
Scrophularia canina L. subsp. bicolor (Sm.) Greuter CR CR
Senecio mollis Willd. R/CR C/CR
Senecio vernalis Waldst. & Kit. R/CR C
Silene vulgaris (Moench) Garcke. var. vulgaris CR C/CR
Sinapis arvensis L. CR C
Sisymbrium orientale L. C/CR CS
Solanum dulcamara L. C/CR CSR
Stachys annua (L.) L. subsp. annua (L.) L. var. bycaonica Bhattacharjee CR CSR
Taraxacum officinale (L.) Weber ex F.H.Wigg. R/CR C
Urtica dioica L. CR C/CSR
Fig. 4 The classification of the species by Grime et al.’s and Pierce et al.’s scheme in grazed areas (X-axis: ecological strategies; Y-axis: the number of species belonging to a particular strategy)
Fig. 5 The classification of the species according to Grime et al.’s and Pierce et al.’s scheme in ungrazed areas (X-axis: ecological strategies; Y-axis: the number of spe-cies belonging to a particular strategy)
Table 5 Statistical evaluation of EIVs by One-way ANOVA test
Means followed by the different letter in the same line are significantly different at the 0.05 level according to Tukey’s HSD test
Disturbance factor Significance
Grazed Ungrazed Ungrazed 2 Cutted Uncutted
EIVM 13.34a 2.67bc 4.13b 1.85c 2.80bc 0.001
EIVL 8.97a 8.02b – 8.00b 6.98c 0.000
EIVN 0.67a 0.15d – 0.60c 0.64b 0.001
EIVR 7.30c 7.79ab – 7.74b 7.85a 0.001
cutted areas and shifted to secondary S-strategists. Stress-tolerant (S) strategists are resistant to nutrient deficiency and they are able to survive under dry conditions. They also adapted to harsh conditions with their long-lasting organs and reproduction occurs during the end of growing season (Hellström et al. 2003; Pywell et al. 2003). The increase of S-species through grazing may also be a competitive advantage under nutrient stress or the possession of defen-sive structures (Moog et al. 2005). Negreiros et al. (2014) indicated that unproductive environments favor the species with traits typical of stress-resistance syndrome. Distur-bance factors (i.e. cutting and grazing) caused an increase in landscape heterogeneity and habitat fragmentation (Vuko-vic et al. 2014). According to Pierce et al.’s (2013) scheme,
S-strategists were dominant in grazed and uncutted areas and these species also had high EIVN values. Franzaring et al. (2007) found that Ellenberg’s N-indicator values are well matched with S-strategists. Grime et al.’s (1998) stated that competitive ruderal (CR) strategists were found to be domi-nant in both grazed vs. ungrazed and cutted vs. uncutted areas. CR species includes annual and short-lived perennial species. These species completed their life-cycle rapidly and are more resistant to the effects of disturbance (Pierce et al.
2007; Škornik et al. 2010; Hüseyinova et al. 2013).
It has been found that CSR strategies were different when different schemes were used. Pierce et al. (2013) found that the strategies of individuals may be rather different and such differences may lead to the formation of ecotypes
under harsh disturbance factors such as grazing and cutted. They reported that Bromus species exhibit S/SC strategy, while Bromus species exhibit R/CR strategy according to Grime et al.’s (1998) scheme. In the present study, Bromus japonicus exhibit R/CSR strategy according to Pierce et al.’s scheme (2013), while this species exhibits CR strategy according to Grime et al.’s (1998) scheme. Such differences may be originated some criteria in Grime’s system were
omitted in Pierce et al.’s scheme (2013). Numerical traits were used in Pierce et al.’s (2013) scheme and changeable ones such as flowering period and flowering time were omit-ted. We emphasized that the using of Pierce et al.’s scheme in the classification of species subjected to disturbance fac-tors is more practical because numerical criteria were used. Our data showed that EIVM, EIVT, EIVL, and EIVN values were found to be high in grazed areas. Plassmann
et al. (2010) found that EIVM and EIVN were high in grazed areas and they also stated that EIVN values are more impor-tant in interpreting the general productivity of an ecosystem than mere soil nitrogen concentrations (Bartelheimer and Poschlod 2016). In ungrazed areas, Ellenberg’s N-indicator values were found to be low- and stress-tolerant (S) strate-gists were represented with a high proportion in ungrazed areas according to Pierce et al.’s (2013) scheme. Pontes et al. (2015) stated that stress-tolerant species were able to persist and cope with local nutrient shortages. It was found that grazed areas had the highest N values, while ungrazed areas had the lowest N values and ungrazed areas were occu-pied by annual herb species such as Calepina irregularis, Avena sterilis, and Centaurea depressa. Li et al. (2011) reported that grazing might have a potentially positive effect in increasing the soil N storage. Since a high-nitrogen
concentration was determined in grazed ecosystems (Tar-della et al. 2016).
EIVL values were found to be highest in grazed areas. L-indicator values were found to be highest in grazed areas, while they were lowest in uncutted areas. Plassmann et al. (2010) stated that grazing causes an increase of EIVL because a high competition for light occurs among the spe-cies in the grazed areas. Competition for light is of par-ticular importance during longer periods of insufficient light (Pykälä 2005; Tardella et al. 2016; Bartelheimer and Poschlod 2016).
Mediterranean shrubs such as Cistus creticus, Colutea arborescens, Jasminum fruticans, Pistacia terebinthus subsp. palaestina, had the lowest EIVM values. Mediter-ranean species typically had low EIVM values and they are usually subjected to high summer drought stress and they competed with each other for light (Tardella et al. 2016).
Uncutted and grazed areas are occupied by tree and shrub species such as Carpinus orientalis, Juniperus oxycedrus subsp. oxycedrus, Phillyrea latifolia, Arbutus andrachne, Quercus petraea, Juniperus foetidissima, Quercus cerris var. cerris and Quercus hartwissiana and they had high EIVN values, while grazed habitat species occupied by Acantholimon acerosum var. acerosum, Juniperus foetidis-sima, Quercus cerris var. cerris and Quercus hartwissiana which had the highest EIVM values. Temporal niche par-titioning was ensured by species with rhizomes and green leaf persistence. Unpalatability was related to low N and M values. It especially occurred in the ungrazed habitat with species such as Onosma frutescens, Papaver lacerum, Papaver rhoeas, Scrophularia canina subsp. bicolor, Senecio vernalis, Centaurea depressa, Geranium pusillum,
Urtica dioica since they had low N and cutted habitat with species such as Cistus creticus, Colutea arborescens, Jas-minum fruticans, Pistacia terebinthus subsp. palaestina, Helianthemum nummularium subsp. nummularium, Veron-ica jacquinii, and Lamium amplexVeron-icaule which had low M values. All of these species are fast growing and they have low palatability (Tardella et al. 2016).
Opposite results were found regarding EIVR values and disturbance factors. Some studies showed that undisturbed areas had high EIVR values, while other studies showed disturbed areas had high EIVR values. For example, Ellen-berg’s EIVR values were found to be high in ungrazed habitats (Spiegelberger et al. 2006). Ungrazed areas were found to be positively associated with EIVR values in the present study. However, Kohyani et al. (2008) found that
disturbed areas had high EIVR values. Similarly it has been found that cutted areas had the highest EIVR values in the present study.
The dominance of secondary strategies indicated that stress and disturbance are at intermediate levels in a par-ticular area according to “intermediate disturbance hypoth-esis” (Martín-García et al. 2016). Our results were agreed with “intermediate disturbance hypothesis” because sec-ondary strategies were found to be widespread in grazed vs ungrazed and cutted vs uncutted areas. Significant differ-ences were found between grazed vs ungrazed and cutted vs uncutted areas regarding EIVs. EIVs reflect the relation between each species and environmental factors, and man-agement practices and they integrate species behavior even over several years (Duru et al. 2013). Grime’s CSR system is also helpful for the optimization of management meth-ods in disturbed areas (Bakker et al. 2002; Hellström et al.
2003; Pykälä 2005) but Pierce et al.’s scheme is a bit more practical due to the using of numerical criteria. Therefore,
Fig. 10 Ellenberg’s temperature (EIVT) indicator values in the study area
Table 6 Eigenvaues for EIVs
Significant values were indi-cated by using bold character
EIVs Axis 1 Axis 2
L − 0.41 0.46
M − 0.47 0.15
N − 0.37 − 0.85
R 0.48 − 0.15
the results of the present study may be applied to disturbed areas for a sustainable management planning.
Acknowledgements This study is supported by Amasya University Project number (FMB-BAP-14-067). Thank you Amasya University Research Fund for their support.
References
Bakker JP, Elzinga JA, de Vries Y (2002) Effects of long-term cutting in a grassland system: perspectives for restoration of plant com-munities on nutrient-poor soils. Appl Veg Sci 5:107–120 Balković J, Kollár J, Šimonovic V (2012) Experience with using
Ellenberg’s R indicator values in Slovakia: oligotrophic and mesotrophic submontane broad-leaved forests. Biologia (Bratisl) 67:474–482
Bartelheimer M, Poschlod P (2016) Functional characterizations of Ellenberg indicator values—a review on ecophysiological determinants. Funct Ecol 30:506–516
Bayrakli F (1987) Plant and soil analysis. OMU Faculty of Agricul-ture Publishers, Samsun
Chai Y, Yue M, Wang M, Xu J, Liu X, Zhang R, Wan P (2016) Plant functional traits suggest a change in novel ecological strategies for dominant species in the stages of forest succession. Oeco-logia 80:771–783
Coban S (2016) Ecological indicator values of forest communities in Çitdere Region (Yenice-Karabük). J Fac For Istanb Univ 66:278–287
Crosti R, De Nicola C, Fanelli G, Testi A (2010) Ecological clas-sification of beech woodlands in the central Apennine through frequency distribution of Ellenberg indicators. Ann Bot (Roma) 0:1–8
Del Vecchio S, Prisco I, Acosta A, Stanisci A (2015) Trends in plant species composition and cover along Adriatic coastal dune habitats in the last 20 years. AoB PLANTS 7:1–10. http s://doi. org/10.1093 /aobp la/plv0 18
Duru M, Ansquer P, Jouany C, Theau JP, Cruz P (2010) Comparison of methods for assessing the impact of different disturbances and nutrient conditions upon functional characteristics of grass-land communities. Ann Bot 106:823–831
Duru M, Jouany C, Le Roux X, Navas ML, Cruz P (2013) From a conceptual framework to an operational approach for manag-ing grassland functional diversity to obtain targeted ecosystem services: case studies from French mountains. Renew Agric Food Syst 29:239–254
Dzwonko Z (2001) Assessment of light and soil conditions in ancient and recent woodlands by Ellenberg indicator values. J Appl Ecol 38(5):942–951
Dzwonko Z, Loster S (1998) Dynamics of species richness and com-position in a limestone grassland restored after tree cutted. J Veg Sci 9:387–394
Fakhireh A, Ajorlo M, Shahryari A (2012) The autecological char-acteristics of Desmostachya bipinnata in hyper-arid regions. Turk J Bot 36:690–696
Franzaring J, Fangmeier A, Hunt R (2007) On the consistencies between CSR plant strategies and Ellenberg ecological indica-tor values. J Appl Bot Food Qual 81:86–94
Frenette-Dussault C, Shipley B, Léger JF, Meziane D, Hingrat Y (2012) Functional structure of an arid steppe plant commu-nity reveals similarities with Grime’s C-S-R theory. J Veg Sci 23:208–222
Grime JP (2002) Plant strategies, vegetation processes, and ecosystem properties, 2nd edn. Wiley, Chichester, p 456
Grime JP, Hodgson JG, Hunt R (1998) Comparative plant ecology: a functional approach to common British species. Unwin Hyman, London, pp 371–393
Guner A, Aslan S, Ekim T, Vural M, Babac MT (2012) A checklist of the Flora of Turkey (vascular plants). Nezahat Gokyigit Botanical Garden Publishers, Turkey
Hellström K, Huhta A, Rautio P, Tuomi J, Oksanen J, Laine K (2003) Use of sheep grazing in the restoration of semi-natural meadows in northern Finland. Appl Veg Sci 6:45–52
Hodgson JG (1991) The use of ecological theory and autecological datasets in studies of endangered plant and animal species and communities. Pirineos 138:3–28
Hodgson JG, Wilson PJ, Hunt R, Grime JP, Thompson K (1999) Allo-cating C-S-R plant functional types: a soft approach to a hard problem. Oikos 85:282–294
Hüseyinova R, Kılınc M, Kutbay HG, Kılıc DD, Bilgin A (2013) The comparison of Grime’s strategies of plant taxa in Hacı Osman Forest and Bafra Fish Lakes in the central Black Sea region of Turkey. Turk J Bot 37:725–734
IBM Corporation (2012) IBM SPSS statistics for windows, version 21.0. IBM Corporation, Armonk
Janišová M, Hegedüšová K, Král P, Škodová I (2012) Ecology and distribution of Tephroseris longifolia subsp. moravica in relation to environmental variation at a micro-scale. Biologia (Bratisl) 67:97–109
Kasprowicz M (2010) Acidophilous oak forests of the Wielkopolska region (West Poland) against the background of Central Europe. Biodivers Res Conserv 20:1–212
Kohyani T, Bossuyt B, Bonte D, Hoffmann M (2008) Importance of grazing and soil acidity for plant community composition and trait characterisation in coastal dune grasslands. Appl Veg Sci 11:179–186
Kutbay HG, Ok T (2003) Foliar N and P resorption and nutrient levels along an elevational gradient in Juniperus oxycedrus L. subsp. macrocarpa (Sibth. & Sm.) Ball. Ann For Sci 60:449–454 Li W, Huang HZ, Zhang ZN, Wu GL (2011) Effects of grazing on the
soil properties and C and N storage in relation to biomass alloca-tion in an alpine meadow. Soil Sci Plant Nutr 11:27–39
Marceno C, Guarino R (2015) A test on Ellenberg indicator values in the Mediterranean evergreen woods (Quercetea ilicis). Rend Fis Acc Lincei 26:345–356
Martín-García J, Jactel H, Oria-de-Rueda JA, Diez JJ (2016) The effects of poplar plantations on vascular plant diversity in ripar-ian landscapes. Forests 7:50
Moog D, Kahmen S, Poschlod P (2005) Application of CSR and LHS strategies for the distinction of differently managed grasslands. Basic Appl Ecol 6:133–143
Negreiros D, Le Stradic S, Fernandes GW, Rennó HC (2014) CSR analysis of plant functional types in highly diverse tropical grasslands of harsh environments. Plant Ecol 215:379–388 Pierce S, Luzzaro A, Caccianiga M, Ceriani RM, Cerabolini B
(2007) Disturbance is the principal α-scale filter determining niche differentiation, coexistence and biodiversity in an alpine community. J Ecol 95:698–706
Pierce S, Brusa G, Vagge I, Cerabolini B (2013) Allocating CSR plant functional types: the use of leaf economics and size traits to classify woody and herbaceous vascular plants. Funct Ecol 27:1002–1010
Pignatti S, Bianco P, Fanelli G, Guarino R, Petersen J, Tescarollo P (2001) Reliability and effectiveness of Ellenberg indices in checking flora and vegetation changes induced by climatic vari-ation. In: Körner C, Walther GR, Burga CA, Edwards PJ (eds) Fingerprints of climate changes: adapted behavior and shifting species ranges. Kluwer Academic/Plenum Press, New York, pp 281–304
Plassmann K, Jones MLM, Edwards-Jones G (2010) Effects of long-term grazing management on sand dune vegetation of high con-servation interest. Appl Veg Sci 13:100–112
Pontes LDS, Maire V, Schellberg J, Louault F (2015) Grass strategies and grassland community responses to environmental drivers: a review. Agron Sustain Dev 35:1297–1318
Pykälä J (2005) Plant species responses to cattle grazing in mesic semi natural grasslands. Agric Ecosyst Environ 108:109–117 Pywell RF, Bullock JM, Roy DB, Warman L, Walker KJ, Rothery P
(2003) Plant traits as predictors of performance in ecological res-toration. J Appl Ecol 40:65–77
Schuster B, Diekmann M (2005) Species richness and environmental correlates in deciduous forests of Northwest Germany. For Ecol Manag 206:197–205
Škornik S, Hartman K, Kaligarič M (2010) Relation between CSR functional signatures of dry grasslands from two contrasting geo-logical substrates. Ann Ser Hist Nat 20:101–112
Spiegelberger T, Matthies D, Müller-Schärer Heinz, Schaffner U (2006) Scale-dependent effects of land use on plant species richness of mountain grassland in the European Alps. Ecography 29:541–548 Spratt SE, Cooper A, McCann T (2011) An ecological basis for the
management of grassland field margins. Asp Appl Biol 108:45–52 Sürmen B, Kutbay HG, Kılıc DD, Hüseyinova R, Kılınc M (2014)
Ellenberg’s indicator values for soil nitrogen concentration and pH in selected swamp forests in the Central Black Sea region of Turkey. Turk J Bot 38:883–895
Tardella FM, Piermarteri K, Malatesta L, Catorci A (2016) Environ-mental gradients and grassland trait variation: insight into the effects of climate change. Acta Oecol 76:47–60
Testi A, Crosti R, Dowgiallo G, Tescarollo P, De Nicola C, Guidotti S, Bianco PM, Serafini Sauli A (2004) Available soil water capacity as a discriminant factor in mixed oak forest of central Italy. Ann Bot 4:49–64
Turkish Republic of Ministry of Agriculture, Forestry and Rural Affairs (1991) Amasya province land resources report number 5. General Directorate of Rural Affairs Publishers, Ankara
Vuković N, Miletić M, Milović M, Jelaska DS (2014) Grime’s CSR strategies of the invasive plants in Croatia. Period Biol 116:323–329
Xu F, Li M, Zhou D, Liu X, Wang R, Guo W (2016) The response of wetland plant communities to disturbance: alleviation through symmetric disturbance and facilitation. Pol J Ecol 64:327–338 Zelený D, Schaffers AP (2011) Too good to be true: pitfalls of using
mean Ellenberg indicator values in vegetation analyses. J Veg Sci 23:419–431