Development of Asset Health Indices based on
Dynamic Condition Parameters in Smart Grids:
An Application to High Voltage Gas Insulated Switchgears
Serdar Celiki, Norbert Kaiser
Keywords: Condition monitoring and diagnostics, health index, asset management ABTRACT
Defining asset condition is a key aspect in effectively managing smart grid assets. With the development of recent advanced technologies on monitoring and diagnostics systems for electrical assets, several data can be collected from grids simultaneously regarding condition of individual assets. However, making decisions out of the collected condition data requires a certain methodology combined with system overview and product knowledge which can then be applied to all assets types and classes. This paper introduces a methodology in order to construct health indices for electrical assets based on dynamic condition parameters, being applied to high voltage gas insulated switchgears.
ÖZETÇE
Akıllı Şebeke Varlıklarının verimli yönetimi için bu varlıkların durumlarını belirlemek kilit rol üstlenir. Son zamanlarda, elektriksel verlıkların izleme ve tanı sistemlerindeki ileri teknoloji gelişmeleri ile her bir varlıkin anlık durumu hakkında bir çok veri toplanabilmektedir. Fakat, bu toplanan durum verilerinden yararlanarak karar verilmesi gerektiğinde, tüm varlık sınıf ve tiplerine uygulanabilen, sistem ve ürün bilgisi ile harmanlıanmış güvenilir bir metodolojiye ihtiyaç duyulur. Bu makale, yüksek gerilim gaz izole sistemler için uygulanan, dinamik durum parametrelerine dayanıp elektriksel varlık için sağlık göstergerleri oluşturmaya yarayan bir metodolojyi sunmaktadır. I. Introduction
Electrical utilities often use risk management tools based on pure probabilistic analysis and basic financial asset valuation (e.g. depreciated book-values). Traditional risk management practices in electrical utilities have several weaknesses.
Firstly, the risk modeling is usually based on high level asset data decreasing the accuracy of the results. Secondly, actual condition of individual assets is not considered. Thus, the risk analysis is not capable to provide time based risk mitigation and optimization
measures such as shortened or extended maintenance intervals, retrofit, refurbishment and replacement based on individual assets. Thirdly, there is no or very limited risk classification which reduces the transparency of the results. Lastly, the risk forecast is usually is in the form a trend analysis which also reduces the future risk accuracy usually leading to various over-forecasting issues.
The proposed methodology uses dynamic asset condition parameters in order to calculate an Asset Health Index (AHI) for each and every asset within the electrical grid. In order to manage different input data, a hierarchical system has been applied. The model, which is described in this methodology, is configured in the asset group level. An asset type is where type specific data like nominal values are stored and maintained. The asset level is where asset data like identifiers and also asset-specific condition values are managed.
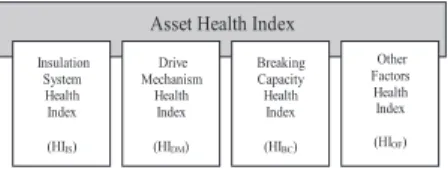
The asset health index (AHI) is calculated monthly by looking into four sub-health indices which belong to the major components of the switchgear and a fourth health index composed of others factors. These are insulation system health index (HIIS), drive
mechanism health index (HIDM), breaking capacity
health index HIBC and other factors health index
(HIOF).
Four sets of smart parameters have been used in order to construct each of the four health indices.
Figure 1. Dimensions of Health Index
II. Construction of Asset Health Indices Four dimensions have been constructed for High Voltage Gas Insulated Switchgears (HV GIS). Total number of events for has been assigned to chosen condition parameters in order to derive weight factors
Asset Health Index
Insulation System Health Index (HIIS) Drive Mechanism Health Index (HIDM) Breaking Capacity Health Index (HIBC) Other Factors Health Index (HIOF)
[1]. Thus, the severity which is given by the number of failure causes per asset components is weighted adequately. Any other approach then always considering the full event count, may distort the grading scheme as the number of affected condition parameters varies significantly at the different condition parameters.
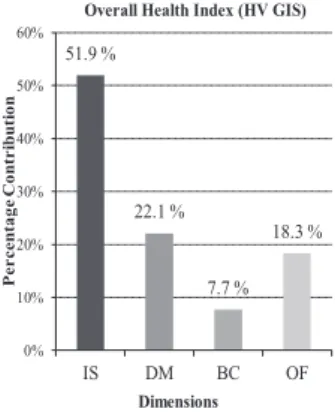
Four dimensions so called the sub-health indices (sub-HIs) have been identified in order to define an overall Health Index (HI) for high voltage switchgears. Each of the dimensions contributes to overall HI as follows [1]:
HEALTH INDEX DIMENSIONS Weight (w) HIIS Insulation System 51.9 %
HIDM Drive Mechanism 22.1 %
HIBC Breaking Capacity 7.7 %
HIOF Other Factors 18.3 % Total 100.0%
Table 1. HV GIS Health Index Dimensions
Graph 1. HV GIS Health Index Dimensions Insulation system is the group of components which are responsible for isolating the high voltage from ground level and it includes:
Insulation System 51.9 % Components at high voltage 18.3 % Metallically earthed components 0.9 %
Gas insulation 12.5 %
Solid insulation within GIS 15.4 %
SF6 gas sealing 3.8 %
SF6 gas density supervision 1.0 % Table 2. Insulation System Components
Insulation system dimension contributes to overall health index calculation by 51.9 % (wIS).
Drive Mechanism 22.1 %
Operating mechanism-compressor, motors, pumps and pipe-work
fittings 6.7 %
Operating mechanism-energy storage, mechanical transmission,
actuator and damper 15.4 % Table 3. Drive Mechanism Components
Drive mechanism dimension contributes to overall health index calculation by 22.1 % (wDM).
Breaking capacity is the result of inter-operation of the making - breaking units and it includes:
Breaking Capacity 7.7 %
Making and breaking units (e.g. CB chamber, switch or interrupter
assemblies) 4.8 %
Other main contact assemblies
(e.g. drive rods) 2.9 % Table 4. Breaking Capacity Components
Breaking capacity dimension contributes to overall health index calculation by 7.7 % (wBC).
Other factors influencing the health index of an HV GIS are age, inspection compliance, maintenance compliance, inspection results and maintenance results. Coming from [1], remaining asset components which do not (yet) have an own condition parameter have logically to be assigned to here.
Other factors dimension contributes to overall health index calculation by 18.3 % (wOF).
Inter-relations among the dimensions have been defined as follows (R is a relation, NR is no relation and N/A is not applicable.) [2]:
51.9 % 22.1 % 7.7 % 18.3 % 0% 10% 20% 30% 40% 50% 60% IS DM BC OF P ercen tage C on tri bu tion Dimensions Overall Health Index (HV GIS)
Development of Asset Health Indices based on
Dynamic Condition Parameters in Smart Grids:
An Application to High Voltage Gas Insulated Switchgears
Serdar Celiki, Norbert Kaiser
Keywords: Condition monitoring and diagnostics, health index, asset management ABTRACT
Defining asset condition is a key aspect in effectively managing smart grid assets. With the development of recent advanced technologies on monitoring and diagnostics systems for electrical assets, several data can be collected from grids simultaneously regarding condition of individual assets. However, making decisions out of the collected condition data requires a certain methodology combined with system overview and product knowledge which can then be applied to all assets types and classes. This paper introduces a methodology in order to construct health indices for electrical assets based on dynamic condition parameters, being applied to high voltage gas insulated switchgears.
ÖZETÇE
Akıllı Şebeke Varlıklarının verimli yönetimi için bu varlıkların durumlarını belirlemek kilit rol üstlenir. Son zamanlarda, elektriksel verlıkların izleme ve tanı sistemlerindeki ileri teknoloji gelişmeleri ile her bir varlıkin anlık durumu hakkında bir çok veri toplanabilmektedir. Fakat, bu toplanan durum verilerinden yararlanarak karar verilmesi gerektiğinde, tüm varlık sınıf ve tiplerine uygulanabilen, sistem ve ürün bilgisi ile harmanlıanmış güvenilir bir metodolojiye ihtiyaç duyulur. Bu makale, yüksek gerilim gaz izole sistemler için uygulanan, dinamik durum parametrelerine dayanıp elektriksel varlık için sağlık göstergerleri oluşturmaya yarayan bir metodolojyi sunmaktadır. I. Introduction
Electrical utilities often use risk management tools based on pure probabilistic analysis and basic financial asset valuation (e.g. depreciated book-values). Traditional risk management practices in electrical utilities have several weaknesses.
Firstly, the risk modeling is usually based on high level asset data decreasing the accuracy of the results. Secondly, actual condition of individual assets is not considered. Thus, the risk analysis is not capable to provide time based risk mitigation and optimization
measures such as shortened or extended maintenance intervals, retrofit, refurbishment and replacement based on individual assets. Thirdly, there is no or very limited risk classification which reduces the transparency of the results. Lastly, the risk forecast is usually is in the form a trend analysis which also reduces the future risk accuracy usually leading to various over-forecasting issues.
The proposed methodology uses dynamic asset condition parameters in order to calculate an Asset Health Index (AHI) for each and every asset within the electrical grid. In order to manage different input data, a hierarchical system has been applied. The model, which is described in this methodology, is configured in the asset group level. An asset type is where type specific data like nominal values are stored and maintained. The asset level is where asset data like identifiers and also asset-specific condition values are managed.
The asset health index (AHI) is calculated monthly by looking into four sub-health indices which belong to the major components of the switchgear and a fourth health index composed of others factors. These are insulation system health index (HIIS), drive
mechanism health index (HIDM), breaking capacity
health index HIBC and other factors health index
(HIOF).
Four sets of smart parameters have been used in order to construct each of the four health indices.
Figure 1. Dimensions of Health Index
II. Construction of Asset Health Indices Four dimensions have been constructed for High Voltage Gas Insulated Switchgears (HV GIS). Total number of events for has been assigned to chosen condition parameters in order to derive weight factors
Asset Health Index
Insulation System Health Index (HIIS) Drive Mechanism Health Index (HIDM) Breaking Capacity Health Index (HIBC) Other Factors Health Index (HIOF)
[1]. Thus, the severity which is given by the number of failure causes per asset components is weighted adequately. Any other approach then always considering the full event count, may distort the grading scheme as the number of affected condition parameters varies significantly at the different condition parameters.
Four dimensions so called the sub-health indices (sub-HIs) have been identified in order to define an overall Health Index (HI) for high voltage switchgears. Each of the dimensions contributes to overall HI as follows [1]:
HEALTH INDEX DIMENSIONS Weight (w) HIIS Insulation System 51.9 %
HIDM Drive Mechanism 22.1 %
HIBC Breaking Capacity 7.7 %
HIOF Other Factors 18.3 % Total 100.0%
Table 1. HV GIS Health Index Dimensions
Graph 1. HV GIS Health Index Dimensions Insulation system is the group of components which are responsible for isolating the high voltage from ground level and it includes:
Insulation System 51.9 % Components at high voltage 18.3 % Metallically earthed components 0.9 %
Gas insulation 12.5 %
Solid insulation within GIS 15.4 %
SF6 gas sealing 3.8 %
SF6 gas density supervision 1.0 % Table 2. Insulation System Components
Insulation system dimension contributes to overall health index calculation by 51.9 % (wIS).
Drive Mechanism 22.1 %
Operating mechanism-compressor, motors, pumps and pipe-work
fittings 6.7 %
Operating mechanism-energy storage, mechanical transmission,
actuator and damper 15.4 % Table 3. Drive Mechanism Components
Drive mechanism dimension contributes to overall health index calculation by 22.1 % (wDM).
Breaking capacity is the result of inter-operation of the making - breaking units and it includes:
Breaking Capacity 7.7 %
Making and breaking units (e.g. CB chamber, switch or interrupter
assemblies) 4.8 %
Other main contact assemblies
(e.g. drive rods) 2.9 % Table 4. Breaking Capacity Components
Breaking capacity dimension contributes to overall health index calculation by 7.7 % (wBC).
Other factors influencing the health index of an HV GIS are age, inspection compliance, maintenance compliance, inspection results and maintenance results. Coming from [1], remaining asset components which do not (yet) have an own condition parameter have logically to be assigned to here.
Other factors dimension contributes to overall health index calculation by 18.3 % (wOF).
Inter-relations among the dimensions have been defined as follows (R is a relation, NR is no relation and N/A is not applicable.) [2]:
51.9 % 22.1 % 7.7 % 18.3 % 0% 10% 20% 30% 40% 50% 60% IS DM BC OF P ercen tage C on tri bu tion Dimensions Overall Health Index (HV GIS)
Figure 2. Relations between Dimensions
Figure 3. Influence of Insulation System on Others RIS→BC = Low
Figure 4. Influence of Drive Mechanism on Others RDM→BC = High
Figure 5. Influence of Breaking Capacity on Others RBC→IS = Medium
RBC→DM = Low
Figure 6. Influence of Other Factors on Others ROF→IS = High ROF→DM = Medium ROF→BC = Low D Relation Level R IS RIS→BC Low 0.08 DM RDM→BC High 0.42 BC RBC→IS Medium 0.24 RBC→DM Low 0.04 OF ROF→IS Medium 0.34 ROF→DM Medium 0.26 ROF→BC Low 0.06
Table 5. Relations between IS, DM, BC and OF
RLow RMedium RHigh
0 < R ≤ 0.15 0.15 < R ≤ 0.35 0.35 < R ≤ 0.50
Table 6. Classification of Correlation Co-efficients The factor R is added to the weighting value w (in balanced cases) or w* (in imbalanced cases); when the respective dimension is significantly at a higher value (i.e. poorer health) then at least two of others. RIS→BC = 0.08 means: HIIS HIDM HIBC HIOF 8.10 5.20 5.30 5.10 w*IS → 1.3 ∙ wIS = 1.3 ∙ 51.9% = 67.5% w*DM → 0.9 ∙ wDM = 0.9 ∙ 22.1% = 19.7% w*BC → (0.9 + R) ∙ wBC = (0.9 + 0.08) ∙ 7.5% = 21.5 % w*OT → 0.9 ∙ wOT = 0.9 ∙ 18.3% = 16.2 % HI*HV= w*IS∙HIIS+ w*DM∙HIDM+ w*BC∙HIBC+ w*OF∙HIOF
HI*HV GIS = 5.47 + 1.02 + 1.14 + 0.83 = 8.46
Table 7. A Typical Imbalanced Case III. Selection of Input Parameters
Input/condition parameters need nominal values to enable a meaningful grading systems as well as a sound ageing pattern parameterization. In most times the data given by the Original Equipment Manufacturer (OEM) are used. But at least in one case the experience of the Condition Monitoring Manufacturer (CMM) has to be used as a start-up value until asset-type specific experience can be implemented into the parameterization.
The following set of parameters will be taken into consideration [3]:
INSULATION SYSTEM
IS-GP Gas Purity OEM
IS-DP Gas Dew Point OEM
IS-PD Partial Discharge CMM DRIVE MECHANISM
DM-OT Open Time OEM
DM-CT Close Time OEM
DM-OC Open Coil Current OEM DM-CC Close Coil Current OEM DM-MR Spring/Comp. Mot. Runtime OEM DM-MC Spring/Comp. Mot. Current OEM DM-NO Number of Operations OEM DM-NF No of Fail to Close/Trip OEM BREAKING CAPACITY
BC-NB Number of Break Faults OEM
BC-LC Load Current OEM
BC-IT i2t OEM
OTHER FACTORS
OF-AG Age ---
OF-IC Inspection Compliance --- OF-MC Maintenance Compliance --- OF-IR Inspection Results --- OF-MR Maintenance Results ---
Table 8. Condition Parameters IV. Condition Data
Condition parameters need input from different data sources. Some parameters (e.g. partial discharge alarms) get inputs from more than one sensor. The resulting value shall be the yield of all sensor data. Three different sources of data have been considered: MS: Manual static (one-time) data
(e.g. manufacturer)
MD: Manual dynamic (regular) data
(e.g. gas purity)
OCMS: Continuous on-line condition monitoring
system data (e.g. PD alarms)
Data regular retrieval interval for high voltage parameters will be as follows [4]:
INSULATION SYSTEM
Annually Gas Purity MD Annually Gas Dew Point MD Hourly Partial Discharge OCMS DRIVE MECHANISM
Hourly Open Time OCMS
Hourly Close Time OCMS
Hourly Open Coil Current OCMS Hourly Close Coil Current OCMS Hourly Spring/Comp. Mot. Runtime OCMS Hourly Spring/Comp. Mot. Current OCMS Hourly Number of Operations MD / OCMS
Annually No of Fail to Close/Trip MD BREAKING CAPACITY
Hourly Number of Break Faults* MD / OCMS
Hourly Load Current OCMS
Hourly i2t OCMS
OTHER FACTORS
--- Age A
Annually Inspection Compliance MD Annually Maintenance Compliance MD Annually Inspection Results MD Annually Maintenance Results MD
Table 9. Retrieval Frequencies
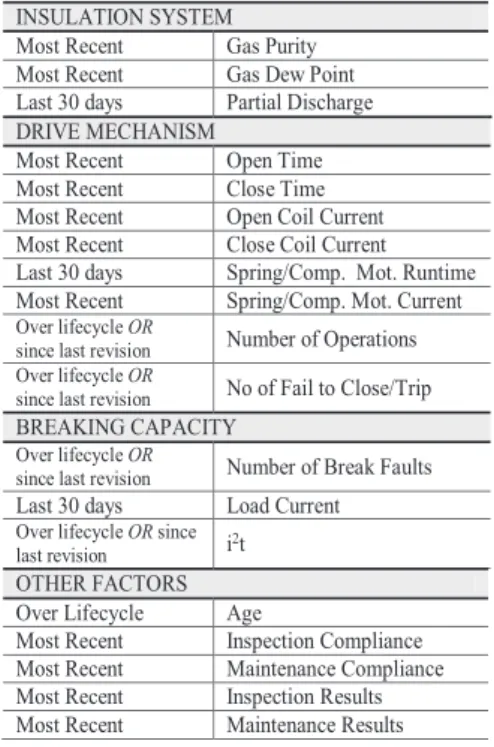
Data measuring/look-back period for health index calculation for high voltage parameters will be as follows [4]:
INSULATION SYSTEM Most Recent Gas Purity Most Recent Gas Dew Point Last 30 days Partial Discharge DRIVE MECHANISM
Most Recent Open Time Most Recent Close Time Most Recent Open Coil Current Most Recent Close Coil Current Last 30 days Spring/Comp. Mot. Runtime Most Recent Spring/Comp. Mot. Current
Over lifecycle OR
since last revision Number of Operations Over lifecycle OR
since last revision No of Fail to Close/Trip
BREAKING CAPACITY
Over lifecycle OR
since last revision Number of Break Faults
Last 30 days Load Current
Over lifecycle OR since last revision i2t
OTHER FACTORS Over Lifecycle Age
Most Recent Inspection Compliance Most Recent Maintenance Compliance Most Recent Inspection Results Most Recent Maintenance Results
Table 10. Look-back Periods for Health Index Calculation V. Health Index Calculation
The overall health index (HIHV) consists of four
dimensions so called the sub-health indices (sub-HIs) [5]:
These are:
1. HIIS: Insulation System sub-Health Index
2. HIDM: Drive Mechanism sub-Health Index
3. HIBC: Breaking Capacity sub-Health Index
4. HIOF: Other Factors sub-Health Index
HIHV= wIS∙HIIS+ wDM∙HIDM+ wBC∙HIBC+ wOF∙HIOF
Subject to: wIS+wDM+wBC+ wOF = 100 % 0 ≤ HIIS ≤ 10 0 ≤ HIDM ≤ 10 0 ≤ HIBC ≤ 10 0 ≤ HIOF ≤ 10 Thus, 0 ≤ HIHV ≤ 10
Nineteen parameters for HV GIS are used to calculate the respective sub-HIs and the resulting overall health index of assets. The most recent value of each parameter (stored via time-stamps within the system) is used for the calculation [6]. Ordinary maintenances triggered by ‘poor condition’ alarms, will improve the monitored/updated values and thus lower the respective health index over time.
However, if the elapsed time is more than half of the retrieval period (e.g. for annual data retrieval, older than six months); corresponding ageing function is used to calculate the current value of the parameter (data with hourly retrieval period are exempt from this rule).
Relative weights of sub-HIs are used to define two cases:
1. Balanced case, when/if all of the boundary value conditions are satisfied.
2. Imbalanced case, when/if one or more of the boundary value conditions are not satisfied. The algorithm ensures that by looking into the value of each sub-HI and checking relative ratio (r) of each dimension defined as follows:
/ IS IS DM DM
HI
r
HI
/BC IS IS BCHI
r
HI
/OT
IS
IS
OT
HI
r
HI
DM/BC DM BCHI
r
HI
DM/OT DM OTHI
r
HI
BC/OT BC OTHI
r
HI
The boundary values of relative weights have been defined as follows: /
0.8
r
IS DM
1.25
/BC0.8
r
IS
1.25
/OT0.8
r
IS
1.25
DM/BC0.8
r
1.25
DM/OT0.8
r
1.25
BC/OT
0.8
r
1.25
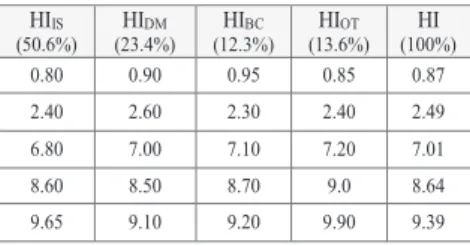
V.1 Balanced CaseWhen all boundary conditions are satisfied, the regular percentage contributions are applied.
Example cases are demonstrated below: HIHV=wIS∙HIIS+ wDM∙HIDM+ wBC∙HIBC+ wOF∙HIOF
HIIS (50.6%) (23.4%) HIDM (12.3%) HIBC (13.6%) HIOT (100%)HI 0.80 0.90 0.95 0.85 0.87 2.40 2.60 2.30 2.40 2.49 6.80 7.00 7.10 7.20 7.01 8.60 8.50 8.70 9.0 8.64 9.65 9.10 9.20 9.90 9.39
Table 11. Balanced Case Sample Outputs V.2 Imbalanced Case
A special algorithm has been applied to the overall health index calculation so that if one or more of the sub-health indices are relatively at a very higher or very lower level then the other health indices, the algorithm detects the exceptions and provides a system warning about the unbalanced dimensions. When/if one or more of the boundary value conditions are not satisfied, the system will provide a warning and the logic will iterate further as the following: if rIS/DM is not in range, all others are in range then:
if rIS/DM > 1.25 then; w*IS → 1.30 ∙ wIS w*DM → 0.90 ∙ wDM w*BC → 0.90 ∙ wBC w*OF → 0.90∙wOF if rIS/DM < 0.8 then; w*DM → 1.30∙ wDM w*IS → 0.90 ∙ wIS w*BC → 0.90 ∙ wBC w*OF → 0.90∙wOF
where w* is the weight and HI* is the forced-overall HI resulting from imbalance amongst the parameters.
For system warning,
rIS/DM > 1.25 then “Please check IS”
if
rIS/DM < 0.8 then “Please check DM”
And, so on so forth.
An imbalance-alarm be denoted with an (*), both for the respective dimensions and overall health index. For example, when HIIS significantly larger than HIDM,
HIBC and HIOT: HIIS HIDM HIBC HIOF 8.10 5.20 5.30 5.10 w*IS → 1.3 ∙ wIS = 1.3 ∙ 51.9% = 67.5% w*DM → 0.9 ∙ wDM = 0.9 ∙ 22.1% = 19.9% w*BC → 0.9 ∙ wBC = 0.9 ∙ 7.7% = 6.9 % w*OT → 0.9 ∙ wOT = 0.9 ∙ 18.3% = 16.5 % HI*HV= w*IS∙HIIS+ w*DM∙HIDM+ w*BC∙HIBC+ w*OF∙HIOF
HI*HV GIS = 7.71 Table 12. Imbalanced Case with HIS very large
Table 9. Retrieval Frequencies
Data measuring/look-back period for health index calculation for high voltage parameters will be as follows [4]:
INSULATION SYSTEM Most Recent Gas Purity Most Recent Gas Dew Point Last 30 days Partial Discharge DRIVE MECHANISM
Most Recent Open Time Most Recent Close Time Most Recent Open Coil Current Most Recent Close Coil Current Last 30 days Spring/Comp. Mot. Runtime Most Recent Spring/Comp. Mot. Current
Over lifecycle OR
since last revision Number of Operations Over lifecycle OR
since last revision No of Fail to Close/Trip
BREAKING CAPACITY
Over lifecycle OR
since last revision Number of Break Faults
Last 30 days Load Current
Over lifecycle OR since last revision i2t
OTHER FACTORS Over Lifecycle Age
Most Recent Inspection Compliance Most Recent Maintenance Compliance Most Recent Inspection Results Most Recent Maintenance Results
Table 10. Look-back Periods for Health Index Calculation V. Health Index Calculation
The overall health index (HIHV) consists of four
dimensions so called the sub-health indices (sub-HIs) [5]:
These are:
1. HIIS: Insulation System sub-Health Index
2. HIDM: Drive Mechanism sub-Health Index
3. HIBC: Breaking Capacity sub-Health Index
4. HIOF: Other Factors sub-Health Index
HIHV= wIS∙HIIS+ wDM∙HIDM+ wBC∙HIBC+ wOF∙HIOF
Subject to: wIS+wDM+wBC+ wOF = 100 % 0 ≤ HIIS ≤ 10 0 ≤ HIDM ≤ 10 0 ≤ HIBC ≤ 10 0 ≤ HIOF ≤ 10 Thus, 0 ≤ HIHV ≤ 10
Nineteen parameters for HV GIS are used to calculate the respective sub-HIs and the resulting overall health index of assets. The most recent value of each parameter (stored via time-stamps within the system) is used for the calculation [6]. Ordinary maintenances triggered by ‘poor condition’ alarms, will improve the monitored/updated values and thus lower the respective health index over time.
However, if the elapsed time is more than half of the retrieval period (e.g. for annual data retrieval, older than six months); corresponding ageing function is used to calculate the current value of the parameter (data with hourly retrieval period are exempt from this rule).
Relative weights of sub-HIs are used to define two cases:
1. Balanced case, when/if all of the boundary value conditions are satisfied.
2. Imbalanced case, when/if one or more of the boundary value conditions are not satisfied. The algorithm ensures that by looking into the value of each sub-HI and checking relative ratio (r) of each dimension defined as follows:
/ IS IS DM DM
HI
r
HI
/BC IS IS BCHI
r
HI
/OT
IS
IS
OT
HI
r
HI
DM/BC DM BCHI
r
HI
DM/OT DM OTHI
r
HI
BC/OT BC OTHI
r
HI
The boundary values of relative weights have been defined as follows: /
0.8
r
IS DM
1.25
/BC0.8
r
IS
1.25
/OT0.8
r
IS
1.25
DM/BC0.8
r
1.25
DM/OT0.8
r
1.25
BC/OT
0.8
r
1.25
V.1 Balanced CaseWhen all boundary conditions are satisfied, the regular percentage contributions are applied.
Example cases are demonstrated below: HIHV=wIS∙HIIS+ wDM∙HIDM+ wBC∙HIBC+ wOF∙HIOF
HIIS (50.6%) (23.4%) HIDM (12.3%) HIBC (13.6%) HIOT (100%)HI 0.80 0.90 0.95 0.85 0.87 2.40 2.60 2.30 2.40 2.49 6.80 7.00 7.10 7.20 7.01 8.60 8.50 8.70 9.0 8.64 9.65 9.10 9.20 9.90 9.39
Table 11. Balanced Case Sample Outputs V.2 Imbalanced Case
A special algorithm has been applied to the overall health index calculation so that if one or more of the sub-health indices are relatively at a very higher or very lower level then the other health indices, the algorithm detects the exceptions and provides a system warning about the unbalanced dimensions. When/if one or more of the boundary value conditions are not satisfied, the system will provide a warning and the logic will iterate further as the following: if rIS/DM is not in range, all others are in range then:
if rIS/DM > 1.25 then; w*IS → 1.30 ∙ wIS w*DM → 0.90 ∙ wDM w*BC → 0.90 ∙ wBC w*OF → 0.90∙wOF if rIS/DM < 0.8 then; w*DM → 1.30∙ wDM w*IS → 0.90 ∙ wIS w*BC → 0.90 ∙ wBC w*OF → 0.90∙wOF
where w* is the weight and HI* is the forced-overall HI resulting from imbalance amongst the parameters.
For system warning,
rIS/DM > 1.25 then “Please check IS”
if
rIS/DM < 0.8 then “Please check DM”
And, so on so forth.
An imbalance-alarm be denoted with an (*), both for the respective dimensions and overall health index. For example, when HIIS significantly larger than HIDM,
HIBC and HIOT: HIIS HIDM HIBC HIOF 8.10 5.20 5.30 5.10 w*IS → 1.3 ∙ wIS = 1.3 ∙ 51.9% = 67.5% w*DM → 0.9 ∙ wDM = 0.9 ∙ 22.1% = 19.9% w*BC → 0.9 ∙ wBC = 0.9 ∙ 7.7% = 6.9 % w*OT → 0.9 ∙ wOT = 0.9 ∙ 18.3% = 16.5 % HI*HV= w*IS∙HIIS+ w*DM∙HIDM+ w*BC∙HIBC+ w*OF∙HIOF
HI*HV GIS = 7.71 Table 12. Imbalanced Case with HIS very large
Graph 2. A typical Imbalanced Case Similarly, the results when any of HIDM, HIBC and
HIOF is significantly larger than the other have been
tabulated as follows:
HIIS HIDM HIBC HIOF HI*HV
1.10 8.15* 1.05 1.15 2.88* 3.0 3.2 7.6* 3.4 4.37* 1.1 1.3 1.15 5.2* 2.03*
Table 13. Imbalanced Case Sample Outputs For example, in HV 132 kV when both HIIS and HIDM
are significantly larger than HIBC and HIOT:
HIIS HIDM HIBC HIOT 8.1 9.4 2.7 3.1 w*IS → 1.15 ∙ wIS = 1.15 ∙ 50.6% = 58.2% w*DM → 1.15 ∙ wDM = 1.15 ∙ 23.4% = 26.9 % w*BC → 0.85 ∙ wBC = 0.85 ∙ 12.3% = 10.5 % w*OT → 0.85 ∙ wOT = 0.85 ∙ 13.6% = 11.6 % HI*HV= w*IS∙HIIS+ w*DM∙HIDM+ w*BC∙HIBC+ w*OF∙HIOF
HI*HV GIS = 7.86
Table 14. Imbalance Case with HIS and HIDM very large
Similarly, the results when any two of sub-HIs are significantly larger than the other two have been tabulated as follows: HIIS HIDM HIBC HIOT HI*HV 3.1 9.4* 9.7* 3.3 6.14* 3.1 2.4 7.7* 7.3* 4.87* 9.1* 4.4 1.7 8.3* 7.01* 7.1* 1.4 7.7* 1.3 5.73* 3.1 9.4* 2.7 9.3* 5.56*
Table 15. Imbalanced Case Sample Outputs For example, when all of HIIS, HIDM and HIBC are
significantly larger than HIOT:
HIIS HIDM HIBC HIOT 9.1 9.4 9.7 3.3 w*IS → 1.1 ∙ wIS = 1.1 ∙ 50.6% = 55.7% w*DM → 1.1 ∙ wDM = 1.1 ∙ 23.4% = 25.6% w*BC → 1.1 ∙ wBC = 1.1 ∙ 12.3% = 13.5 % w*OT → 0.7 ∙ wOT = 0.7 ∙ 13.6% = 9.5 % HI*HV = w*IS∙HIIS+ w*DM∙HIDM+ w*BC∙HIBC+ w*OF∙HIOF
HI*HV GIS = 9.10
Table 16. Imbalance Case with HIS, HIDM and HIBC very large
Similarly, the results when any three of HIIS,
HIDM, HIBC and HIOT is significantly larger than the
fourth one have been tabulated as follows: HIIS HIDM HIBC HIOF HI*HV
3.8 9.4 9.7 8.9 7.15
8.1 4.4 8.7 8.3 7.94
9.5 9.4 1.7 9.3 8.36
Table 17. Imbalanced Case Sample Outputs Future health indices will be calculated based on the forecasted future values of parameters, through aging functions.
VI. Conclusion
The developed methodology may serve as a powerful tool in asset management with the following features: Firstly, constructed health indices can be used to calculate current and future failures’ probability pertaining to individual assets by making use of the aging patterns of the parameters.
Moreover, calculated probabilities can consequently be multiplied by consequence of failures (again, calculated for each individual asset) in order to calculate the risk associated with individual asset. In addition, all aggregated system risk can be calculated as the sum of individual asset risk.
Finally, based on the calculated risk projections, asset management related recommendations such as next maintenance due dates, intervention actions (e.g. refurbishment and retrofit) and replacement strategies can be derived. 8,1 5,2 5,3 5,1 0 2 4 6 8 10 IS DM BC OF References
1. Cheung, Heil, Kobayashi, Kopejtkova, Molony, O’Connell, Skyberg, Taillebois, Welch, CIGRÉ TB 150, Report On The Second International Survey on High Voltage Gas Insulated Substations (GIS) Service Experience, Issue 1, pg. 10-17-88, [2000]
2. FGH e.V. AiF/IGF-Vorhaben 16391N, Entwicklung Typspezifischer Prognose Modelle zur Beschreibung der Zuverlässigkeit von Betriebsmitteln im Rahmen des Asset Management in Elektrischen Verteilungsnetzen, Issue 1, pg. 44, [2013]
3. IEC 62271-100, High-voltage switchgear and controlgear – part 100: Alternating-current circuit breakers, Issue 2.0, pg. 188, [2008]
4. IEEE, Recommended Practice for the Design of Reliable Industrial and Commercial Power Systems, Issue 97, pg. 40, [1997]
5. Janssen, Degen, Heising, Bruvik, Colombo, Lanz, Fletcher, Sanchis , CIGRÉ TB 083, Final Report of The Second International Enquiry On High Voltage Circuit-Breaker Failures And Defects In Service, Issue 1, pg. 31, [2000]
6. Siemens AG, PDM Installation, Operation and Maintenance Schedule For The i-ConPDM – UHF Partial Discharge Monitoring & i-ConCBM – Circuit Breaker Monitoring Ssystem, Issue 5, pg. 53, [2013]
iCorresponding Author
Serdar Celik
Siemens AG, Humboldstr. 59 90459 Nuremberg, Germany +491722674131 [email protected]