IC
ON
A
RP
ICONARP International Journal of Architecture & Planning Received 15 May 2017; Accepted 12 June 2017 Volume 5, Issue 1, pp: 10-41/Published 30 June 2017
DOI: 10.15320/ICONARP.2017.15–E-ISSN: 2147-9380
Abstract
Urban pattern is the result of a dynamic transformation process, which can follow two different trajectories: planned interventions generally produces clear geometrical patterns in large areas, however, unplanned transformation process needs more time and has relatively smaller and partial effects on the urban pattern but creates more complex urban patterns. Highly complex spatial structure of urban pattern governed by local and global forces should be analyzed via advanced methods that corresponds the complexity of the pattern. Analyses of the dynamic structure of the multidimensional urban system shows the necessity of using advanced methods and several parameters together.
The aim of this paper is developing a new method to analyze and represent highly complex urban pattern via evaluating geometrical, topological, and mathematical parameters to evaluate essential characteristics of cities.
Physical space is analyzed by ‘geometrical parameters’, ‘topological parameters’, ‘parameters related to use and perception’ and ‘parameters related to complexity’. Calculation results gives two main information about urban structure: Firstly, values gives information about spatial characteristics and diversity of urban pattern. Secondly, the spatial
Urban DNA:
Morphogenetic Analysis
of Urban Pattern
H.Serdar Kaya*
& Fulin Bölen**
Keywords: Fractal geometry, lacunarity,
space syntax, urban pattern
* Dr. Istanbul Technical University, Faculty of
Architecture, Department of Urban and Regional Planning, Istanbul, Turkey. E-mail: [email protected]
**Prof. Dr. Istanbul Technical University, Faculty of Architecture, Department of Urban and Regional Planning, Istanbul, Turkey. E-mail: [email protected]
0/ IC O N ARP. 20 17 .15 – E -I SSN : 21 47 -9380
distribution map of changing urban pattern reflects the unique structure of settlements, which resembles DNA of living creatures.
In this paper, Istanbul was selected as case study area because of the rich historical background and dynamic urban growth process resulting various types of settlements including historical settlements, old villages, unplanned development, squatter areas and gated communities with different densities.
As the proposed model shows essential morphological characteristics of urban pattern as a morphological DNA, outputs of this model has a potential to be used in different areas such as comparative analysis of geometrically different cities, analyzing irregularities in urban pattern, controlling growth and density by controlling parameter values, creating urban sub-systems by combining components in different scales.
INTRODUCTION
Urban pattern is a dynamic structure and evolves in time according to the changing needs and choices of society. The urban pattern, which consists of buildings, building blocks and roads adapts to the changing conditions.
In the transformation process, spatial differences among cities and universal principles of settlements result in a very complex spatial patterns that cannot be analyzed via only geometrical differences. Therefore, mathematical and topological analysis methods needed to reveal unique characteristics or urban system. There are several models and approaches exist to analyze such complex settlement structures (Bar-Yam, 2003; Batty, 2008; Bolliger et al., 2005)
In this research, characteristics and differences in urban pattern is analyzed by using advanced mathematical methods to understand the structure of the urban pattern. Spatial parameters classified into four categories: Basic features of physical structure is ‘Geometrical features’ of the pattern such as dimensions of spatial elements. Second category comprises ‘topological characteristics’ of physical space. Third category is focused on measures related to the visibility and perception of space. The last category is ‘complexity’ of urban pattern that includes mathematical relationship and hierarchical structure of spatial systems.
BACKGROUND
Urban pattern is evaluated as characteristics of built environment which specifically addressing street network, building blocks and form of open spaces. Although local characteristics of settlements differentiate the geometrical features of urban pattern, some universal principles exist in all patterns. These features have been analyzed through classifying spatial elements into three groups: Buildings, building blocks and roads as three component of urban
olu m e 5, Is su e 1 / Pu bli shed : Jun e 20 17
pattern helps to understand the dynamic structure of the urban pattern. In this research, spatial features are classified into four categories: Geometrical features, usage-perceptional features, spatial relationships and features of transformation of the urban pattern.
Geometrical parameters:
Geometrical features measured by basic dimensions of buildings, city blocks and streets and ratios such as area and the ratio of area/perimeter. A hierarchical system should follow a scaling relationship, thus the existence of the rank-size rule or power law in the distribution of the changing sizes reflects the hierarchical order of the spatial organization.
There are several researches and design approaches that use repeating geometrical units and angular systems (Steadman, 1983; Teller, 2003). The geometrical system of repeating shapes and rules of geometrical interactions defined as ‘Shape grammars’ in 1970s (Stiny, 1980; Stiny & Gips, 1971) and this approach used in computing technologies to create various schemes to contribute architectural design (Çağdaş, 1996; Steadman, 1983). Topological parameters:
Topological maps consist of points and connections thus, gives information about relationships and connections rather than distances and size of objects. In the topological system, points represent components of system and axial lines represents interaction among components (Boccaletti et al., 2006) such as building blocks and plots and streets (Kruger, 1989; Krüger, 1979, 1980)
Space syntax model is widely known topological analysis method to explore spatial characteristics of urban settlements via simplifying built form as axial map and convex spaces (Hillier & Hanson, 1984). This model is built on the movement of pedestrian in urban space and focuses on ‘natural movement’ which means the movement directly related to the morphology of urban structure rather than land use and other factors. As this method focuses on pedestrian movement in an urban space, it is related to the user preference and perception of open space.
Axial maps analyzed by several parameters such as ‘integration’, ‘connectivity’, control value’ of each line and ‘intelligibility’ values of areas (Hillier, 1996; Hillier & Hanson, 1984). Lately topological network which consists of linear axis and nodes re-evaluated and angular analysis added (Figueiredo & Amorim, 2005) into the model. Space syntax analysis extended from the analysis or
0/ IC O N ARP. 20 17 .15 – E -I SSN : 21 47 -9380
pedestrian in urban open space (Batty & Rana, 2004; Hillier et al., 1976) to the relationships of topological structure of cities and land use (Kubat, 1997), crime in an urban space, land values, livability (Topcu & Kubat, 2012). Calculation of the most widespread measure of space syntax is ‘integration’ that “indicates the degree to which a node is integrated or segregated from a system as a whole (global integration), or from a partial system consisting of nodes a few steps away (local integration)” (Volchenkov & Blanchard, 2008). It is calculated by Real Relative Asymmetry (RRA). Integration measure starts with ‘depth’ of all points in the system. Total depth is calculated with following formula (1) (Kruger, 1989):
(1) Here, dij, depth between i and j points,
N, number of axial line in the system, Di, i total depth value of a point.
On the other hand, depth value should be standardized to be able to compare urban areas that have different sizes and number of axial lines. Thus, standardized value of depth is called as real relative asymmetry ‘RRA’ (2) (Hillier & Hanson, 1984; Volchenkov & Blanchard, 2008):
RRA= 2(MD-1) / DN (N-2) or RRA= RA/ DN (2)
Here, MD is the mean depth,
N, is the number of axial lines in the whole system
DN value in this formula is calculated as follows (3) (Volchenkov
& Blanchard, 2008);
(3) The distribution of spatial integration values also gives information about hierarchical structure of urban network. According to researches, if values ordered from the largest to smallest, log-log graph of rank-size distribution represents a linear relationship as it found in Manhattan, Rothenberg, Bielefeld, Venice, and Amsterdam (Volchenkov & Blanchard, 2008).
olu m e 5, Is su e 1 / Pu bli shed : Jun e 20 17
Parameters related to use and perception:
Interaction of urban space and user might be analyzed via ‘geometrical features of space’, ‘features of spatial relationship’ or ‘behavior and perception of users and user needs’. The main interest of this research is physical characteristics and mathematical measurement methods of urban pattern. Thus, instead of having comprehensive discussion of user perception and preferences, physical parameters, which related to the human behavior explained here.
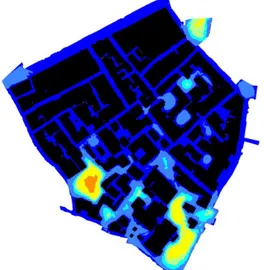
Geometrical features such as size and dimensions of streets and squares have significant effect on use and user preferences (Ashihara, 1983; Bacon, 1975; Franz & Wiener, 2008). However, researches show that the topological features also have impact on human behavior and preferences (Hillier, 1999; Kim & Penn, 2004). Therefore, in this research space syntax and 3D spatial enclosure models have been used to analyze spatial structure. Variation in the buildings which enclosing open spaces and geometrical variation of geometries have positive effect on the perception of users (Stamps, 2003; Zacharias, 1999). Characteristic structure of urban pattern and rules of production of space defined as a ‘pattern language’ by Alexander (Alexander et al., 1977). Behavior of pedestrian in space is analyzed by the principle of least effort (Zipf, 1972) and modelled by space syntax (Hillier et al., 1976) or some other simulation tools (Helbing, 1998). Various simulation tools have been developed to evaluate visibility of an area, which effecting he perception and use, based on the concepts of ‘convex space’, the ‘viewshed’, and ‘isovists’ (Turner et al., 2001). Depthmap is a software application that measures visibility against other syntactic parameters (Turner, 2001) in two dimensions. Buildings in the environment defines the boundary of visible space on a planar surface (Figure 1).
Figure 1. A visibility map of a sample urban pattern in Taksim, Istanbul
0/ IC O N ARP. 20 17 .15 – E -I SSN : 21 47 -9380
Although the space syntax method primarily works on 2D environments, some studies attempt to introduce a third dimension into this method such as the use of axial lines in 3D space to create 3D axial maps (Schroder et al., 2007). In this method, it is assumed that there is no height variation in the ground level, and the slopes of the axial lines are calculated. 3D spatial enclosure model
In this research a new model is developed to represent spatial enclosure in the third dimension to calculate the angle between the points on the road centerline at ground level and the roof top level of the buildings on the both sides of the roads. The angle values have been classified according to the different H/D (Building Heights/Distance between buildings) ratios of open space, which have various perceptional effects.
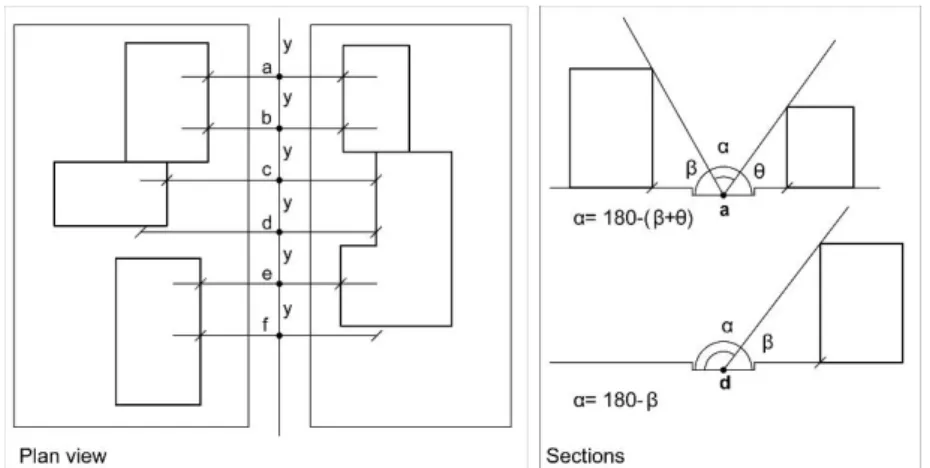
This model consists of three stages: Firstly, buildings, which have an attribute of number of floors or building heights and road centerlines, needs to be created. After this process, the model creates points over the road centerlines according to the distance value (y) between points defined by user. Then, draws a perpendicular hidden line to find closest buildings for each points and calculates the angles between points and the roof levels of two closest buildings (Figure 2). The H/D values in the urban squares, open spaces, green areas, and main arterials are lower than 1/5. Streets and small openings within the dense urban structure have values of between 3/7 and 1.
In the third stage, these angle values are interpolated by using ordinary kriging method to convert point values to areal information by predicting values between points. This method can be used as an effective tool during the planning process to decide the maximum allowed height of buildings and to create breathing points in the dense urban environment.
Figure 2. Measurement method of spatial enclosure in 3D (Kaya, 2010)
olu m e 5, Is su e 1 / Pu bli shed : Jun e 20 17
Parameters related to the complexity of urban pattern Urban system is a complex open system, which contains several sub systems and components. The existence of rules is very crucial for the unity of the system. The features of complexity focus on some mathematical principles leading the pattern to work as a system. Chaos theory, rank-size rule, shape grammars (Stiny & Gips, 1971) and pattern language (Alexander et al., 1977) are well-known example searching rules of interaction of spatial components in architecture and urban design. The other area of research is complexity studies that helps to measure relationship between physical environment and richness of urban activities and life like the relationship rules of ‘coupling’, ‘diversity’, ‘boundaries’, ‘forces’, ‘organization’, ‘hierarchy’, ‘interdependence’, and ‘decomposition’ (Salingaros, 2000). It is shown that users generally groups similar sized elements and counts the number of objects and compares with the similar examples in the nature, therefore, designs which are desirable for the users have scaling of objects which fits the power law and this relationship represented via following formula (4) (Salingaros & West, 1999):
(4) Here;
p: number of elements in characteristic scale, x: characteristic scale size,
μ: power coefficient which generally have values between 1 and 2, C: overall size of the structure or total number of elements. The fractal geometry is also based on similar scaling rule called as ‘the self-similarity’. Although there are several methods to use the fractal geometry, ‘box counting’ method have been used in this thesis. In this method, the urban pattern overlapped with various sized grids and the ratios of the number of intersecting grids with changing grid size have been examined.
Fractal geometry
Euclidean dimension cannot correspond complex objects in the real world, therefore a new approach developed to measure level of complexity via analyzing the change of measurement result of length, area or volume with the change of measurement unit or scaling factor rather than simple Euclidean dimensions (Peitgen et al., 2004). The feature measured by fractal geometry is
0/ IC O N ARP. 20 17 .15 – E -I SSN : 21 47 -9380
explained by the difference between “form” and “structure”: Form represents the physical patterns such as land use, population distribution, and service network; on the other hand, structure means spatial organization of human activities and mutual interrelationships. Fractal geometry method measures form and physical structure both (Salingaros, 2003; Wurster, 1969). Fractal objects in real life differs from the artificial simulations. Urban pattern has changing morphological structures in different scales and different sub-regions, which corresponds a variation in fractal dimensions. Thus, fractal analysis shows that the urban pattern is also a kind of multifractal structure. The evolution process of the urban pattern results in higher level of complexity and this also increases the fractal dimension values (Kaya, 2003, 2010). “Fractal dimensions attempt to quantify a subjective feeling which we have about how densely the fractal occupies the metric space in which it lies, and provide an objective means for comparing fractals” (Xu, 2005).
Fractal dimension can be calculated via different methods such as ‘self-similarity dimension’, ‘topological dimension’, or ‘Hausdorff dimension’, ‘box counting dimension’ etc. (Frankhauser, 1998a, 1998b; Peitgen et al., 2004). ‘Box counting dimension’ is a specific case of Mandelbrot’s fractal dimension and most preferred method among these methods (Peitgen et al., 2004). The scaling relationship in calculating box counting dimension is defined as the relationship among number of boxes, box size and fractal dimension. As the box size changes, number of boxes that overlaps with the object will change as follows (5):
(5)
Here K represents the ‘number of boxes’, ε is ‘grid size (or scale)’, A is a ‘constant coefficient’ and Df is the fractal dimension.
This scaling relationship is similar to some other mathematical relationships of hierarchical systems such as rank-size relationship, and power law. Several researches found a distinct relationship among them and urban structure. Evaluating rank-size hierarchy of settlements as a multifractal feature or analyzing structure of analyzing urban systems via scaling relationship have great contributions to understand dynamic structures of self-generated settlements (Y. Chen & Zhou, 2003; Yanguang Chen & Zhou, 2004, 2008; Haag, 1994). Chen and Zhou (2003) uses two power functions to calculate fractal dimension (6) and (7):
(6)
olu m e 5, Is su e 1 / Pu bli shed : Jun e 20 17 (7) Here;
Sm: scale of fractal unit in mth step,
S1: is the length of the initiator which is always confined in a unit
interval [0,1]
rs: is the interstep scale ratio (rs=Sm/Sm+1)
fm: is the number of fractal units in the mth step,
f1: is the number of initiators (in general f1=1)
rf: is the interstep number ratio, (rm=fm+1/fm). (Y. Chen & Zhou,
2003).
From two equations, function for the fractal dimension is expressed by the following formula (8) and then (9);
(8) (Y. Chen & Zhou, 2003) (9) In this research, box-counting method is preferred to calculate fractal dimension. In the box counting method, more than one mesh with different grid sizes are overlapped with urban pattern. The logarithmic ratio between differences in changing grid sizes and number of grid cells overlapped with objects gives the fractal dimension (10) (B. B. Mandelbrot, 1977, 1982; Peitgen et al., 2004).
(10) Here, DB , is box counting dimension,
K; number of boxes (cells) and, S; side length of boxes.
Urban pattern is a heterogeneous structure and has different level of detail in different scales, therefore it has more than one fractal dimension. Changing structure of urban pattern in scale generates different fractal dimensions for different box sizes. Likewise, urban structure is not homogeneous in space, thus location of grid is also effect the measurement result. To solve this problem, a software called as ‘FracLac’ used to calculate fractal dimension for several grid sizes and grid locations. Fractal dimension, which has highest frequency among hundreds of calculation, is accepted as fractal dimension of selected pattern.
0/ IC O N ARP. 20 17 .15 – E -I SSN : 21 47 -9380 Lacunarity
Fractal dimension shows the complexity of urban pattern but different spatial organizations can have same fractal dimensions. Adding a new parameter, which analyzes morphology of open spaces of, built structure to fractal dimension, helps to compare different spatial configurations with same fractal dimension. Lacunarity is a parameter that developed by Mandelbrot to analyze patterns added to the fractal dimension (Cheng, 1999; B. B. Mandelbrot, 1982) which focuses on the spatial and size distribution of open spaces. If variation of open space sizes are higher, then, lacunarity value increases (Filho & Sobreira, 2005). Lacunarity use binary values an urban pattern as built/non-built (1/0). Defined size box slides over the pattern and the change in the number of filled pixels defined. The ratio of changing filled pixels to total number of boxes gives a statistical value (11) (Wu & Sui, 2001):
“Q(S,r)=n(S,r) / N(r) (11) Where,
S: number of occupied pixels (1’s) r: side length of a square box
n (S,r): number of boxes of size r with mass S N(r): total number of boxes of size r
As the box slides over the pattern, the differentiation of distribution of open spaces measured several times. If the situation in the first box location becomes E(S), and second situation in a new box location becomes E(S2), two moments of
distribution is calculated as follows (12, 13);
and (12) (13) Lacunarity Λ(r) is the change between two situations (14,15); Λ(r)=E(S2)/E2(S) (14)
since;
E(S2)=var(S)+E2(S) (15)
Lacunarity can be calculated as one plus the ratio of the variance and the mean square of the box mass (16):
Λ(r)= [ var(S)/E2(S)]+1, [ 1, ∞) (16)
olu m e 5, Is su e 1 / Pu bli shed : Jun e 20 17
where E(S) is the mean and var(S) is the variance of the number of occupied pixels per box” (Wu & Sui, 2001). As this parameter shows the heterogeneity of open spaces, this method is used to analyze the distribution of open spaces of fractal objects (Benoit B. Mandelbrot et al., 2001). Similar situation is seen in historical cores of Turkish cities that have unique and different physical patterns but very close fractal dimensions (Kaya & Bölen, 2006). Methodology and analysis
Complex systems can be classified into two groups as ‘organized’ and ‘disorganized’ complexity. Urban system is a organized complex system like human, brain, economies, Cities, and ecosystems (Wilson, 2002). There is very powerful interrelationship among components of organized complex systems. Because of this reason, analyzing components separately does not give total picture of complex system. Thus, a contemporary methodologies and tools needed to analyze urban complexity.
In this research, a new approach proposed to analyze and represent spatial characteristics of urban pattern. A set of mathematical measurements used together to measure urban pattern. The set of parameters that consists of ‘geometrical parameters’, ‘topological parameters’, ‘use and perceptional parameters’ and ‘complexity parameters’ together gives a picture that represents intrinsic characteristics of physical pattern, which is called as ‘urban DNA’. Analyses under each parameter group is limited in this research but these parameters can be increased to extend this methodology to examine physical and socio-economical features of urban system.
Geometrical parameters consist of ‘distribution of plot sizes’, ‘Floor area ratio (FAR)’, ‘Building coverage ratio (BCR)’, ‘ratio of city block edge length to the area’. Topological parameters include ‘spatial integration’ of space syntax. Although space syntax is also related to the use and perception of users, a new tool, ‘3D spatial enclosure model’ is developed here to analyze three-dimensional enclosure of urban space. Complexity of urban pattern measured by ‘box counting dimension’ of fractal geometry and ‘lacunarity’ analysis.
Analyzing the morphology of Istanbul
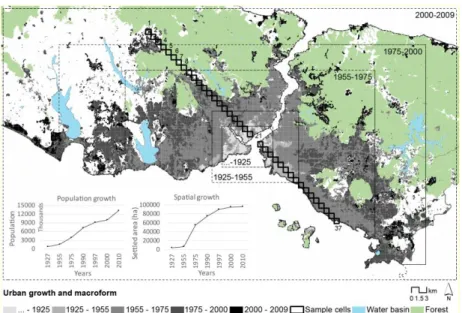
Istanbul is a metropolitan city, which located on two continents and experiencing urbanization problems triggered by huge immigration from other cities and rural areas. Especially after 1950s, built up area of the city rapidly increased with the huge migration wave (Figure 3). Two motorways and bridges change
0/ IC O N ARP. 20 17 .15 – E -I SSN : 21 47 -9380
development direction from east west to north. The morphological structure of Istanbul is influenced by Roman, Byzantine, Ottoman and Turkish cultures. Added to the cultural variety through the history, the city has very rich natural environment. The Bosporus divides the city into two sides; both Anatolian and European sides have hilly topography and forest areas on the northern side of the city. Forests and water basins were located outside of the settlement area but after rapid growth of the city new settlement areas with a new urban pattern developed around water basin areas and in the forests.
In this research built up area of the city overlapped 1kmx1km size grid mesh and cells located on a linear axis have been selected to examine urban pattern characteristics along this linear direction. As the city has different growth process and pattern types on east-west and north-south directions, a diagonal axis selected to capture different urban patterns that also includes main development types of different periods (Figure 3). Selected diagonal axis have some advantages: cells intersect with more various types of settlement patterns. Therefore, the total number of cells analyzed is reduced while keeping the spatial variation as much as possible. Because of these, diagonal axis preferred to select sample cells.
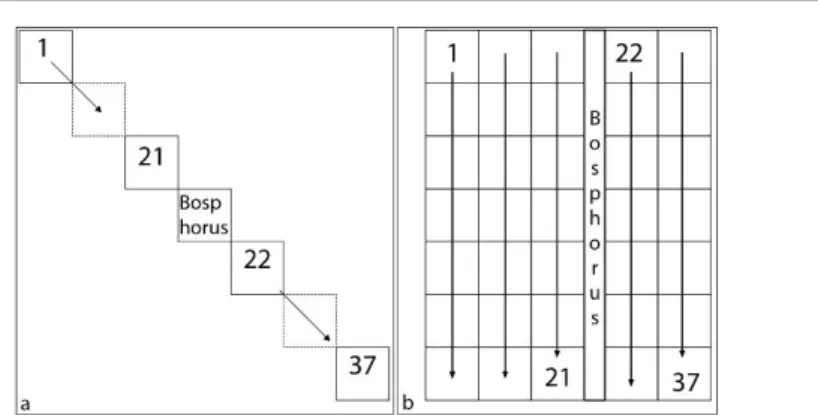
The content of the cells cannot be seen in their original locations on diagonal axis in the city (Figure 3). Instead of increasing image dimensions, which is not possible to fit the A4 sized page, the locations of cells from 1 to 37 are reorganized to represent cells easily (Figure 4). Although it is difficult to read actual locations, the relative locations of each cell can be evaluated easily and Figure 4 might help to understand and evaluate outputs of this research.
Figure 3. Spatial growth of Istanbul and location of selected
olu m e 5, Is su e 1 / Pu bli shed : Jun e 20 17
This method enables to reveal variation of local patterns and changes of values of the selected areas that are located on a linear axis and helps to explore the spatial characteristics of urban structure, which makes a city unique. Cells in the two sides of the city are not located symmetrically. North-west end of the diagonal axis is overlapped with the edge of the city but southeast end cannot continue to the periphery of city. Selected cells in the Anatolian side intersected with settlement pattern that developed before 2000 and they are very close to the seashore. This should be considered in the evaluation of cells.
Geometrical parameters:
These parameters mainly show the physical density of urban pattern and basic shape characteristics of city blocks. The first geometrical parameter is ‘plot size’. Distribution of plot size sows the evolution of pattern. Historical areas should have smaller plot sizes than periphery of the city.
Distribution of plot sizes
Repetitive division of plots through the development process and increasing land values in the central areas results in smaller plots than periphery of the city. The cells 21 and 22 are located in the central core of Istanbul and have smallest plot sizes (Figure 5). However, leapfrog development of the city within the forest areas reduces the plot sizes in the northwestern periphery of the city. Large plots in the central cells are used as public open spaces, universities, etc.
The European side have smaller plots than Anatolian side in the central area. This difference is not limited only to the plot sizes. Box-plot graphs help to understand differences in detail: Cells from 1 to 12 have larger minimum and mean values, which represents the characteristics of periphery and forest areas. The cells from 13 to 37 are located in the central zone and cells 20 and 21which are located in the historical core have the lowest mean values (Figure 6).
Figure 4. Location of cells on the map (a) and in the figures (b) (Kaya, 2010)
0/ IC O N ARP. 20 17 .15 – E -I SSN : 21 47 -9380
Figure 5. Plot size distribution of cells (Kaya, 2010)
Figure 6. Box-plot distribution of plot sizes for each cell on the selected axis (Kaya, 2010)
olu m e 5, Is su e 1 / Pu bli shed : Jun e 20 17
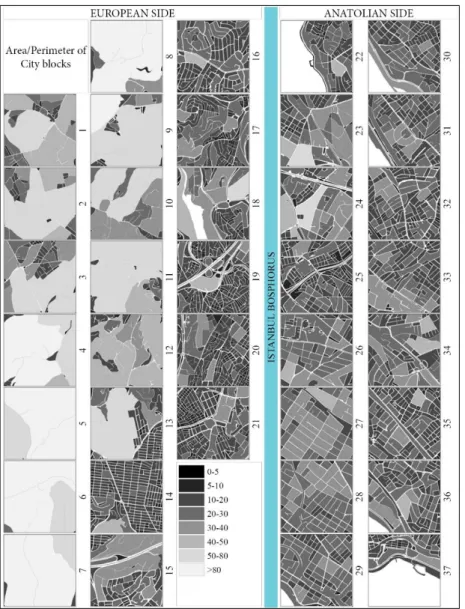
The ratio of city block area/perimeter (a/p)
Amorphous geometries increase perimeter and reduce the ratio. Square city blocks increase the area while keeps perimeter relatively short, thus the ratio will increase. In the hilly topography of Istanbul, there are several dead end streets and stairs on streets that increase the ratio.
The cells 4 to 8 in the Figure 7 correspond to the forest areas and villages, therefore they are very large areas divided by very limited village and forest roads. Settled area of the city started after these cells which reduces the ‘a/p’ ratio. Although city block sizes reduce, rectangular geometry of the city blocks prevent to have a/p lower than 10 (Figure 7).
Each cell has different a/p distribution. Especially cells 1 to 13 have very large city blocks because of natural areas. On the other hand, in the low density housing areas and villages, very small city blocks exist and the range of a/p ratio increases. This difference is
Figure 7. Distribution of city block area/perimeter ratios (Kaya, 2010)
0/ IC O N ARP. 20 17 .15 – E -I SSN : 21 47 -9380
shown as longer boxes in these cells in the box-plot graph (Figure 8).
Range of values is larger in the cells 4 to 8 than the cells 11 to 37, which are located in the central area (Figure 8). Most of the cells has the ratio in between 5 and 30. The 14th cell h has lowest range
and a regular grid pattern with the ‘a/p’ ratio around 10 can be seen in this cell. Cells from 13 to 37 are the central area of the city and comparing with the Anatolian side, the cells in European side have lower a/p range because of the small city blocks in the dense urban pattern.
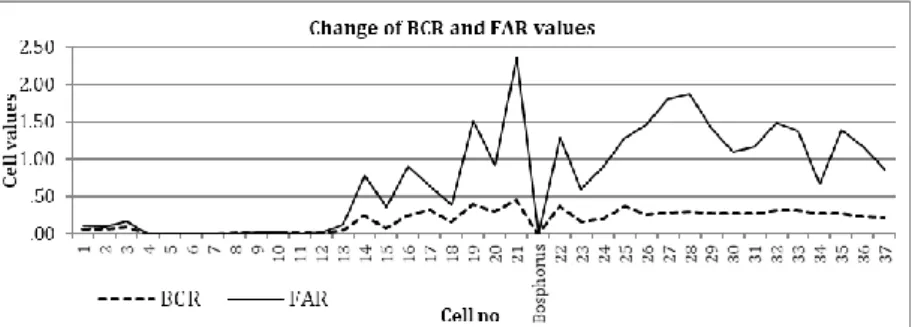
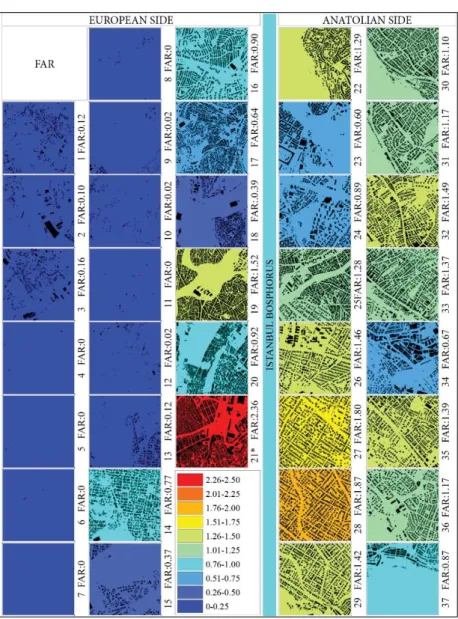
Building construction ratio (BCR) and Floor area ratio (FAR) Physical density is analyzed via ‘building coverage ratio’ and ‘floor area ratio’ via total coverage and construction areas in each cell. Surprisingly there is no regular decrease in the BCR values from the central zone to the periphery. Although gross BCR values generally higher in the central area and reaches to the 0.45s in some cells, BCR values are lower than adjacent two cells like cells 15 and 18 (Figure 9, Figure 11).
Floor area analysis gives similar outputs (Figure 10, Figure 11). Forests and water basins in the European side breaks the continuity of values and BCR and FAR values in the cells 1 to 12 are close to 0 (Figure 10). BCR values in Anatolian side are less fluctuated which means that urban pattern of cells has more similarity and continuity then European side. The homogeneous spatial pattern supports this similarity (Figure 9, Figure 11).
Figure 8. Box-plot distribution of a/p of city blocks for each cell (Kaya, 2010)
olu m e 5, Is su e 1 / Pu bli shed : Jun e 20 17
As it can be seen in the Figure 10, in the historical core, BCR and FAR values higher in the European side than Anatolian side. Change in adjacent cells in the European side is also higher than Anatolian side.
Although geometrical features give information about physical pattern, 3D environment and structural organization should be analyzed together to understand intrinsic characteristics or urban pattern.
Figure 9. Building construction ratio analysis (Kaya, 2010)
Figure 10. The change of physical density in the selected cells (Kaya, 2010)
0/ IC O N ARP. 20 17 .15 – E -I SSN : 21 47 -9380 Topological parameters
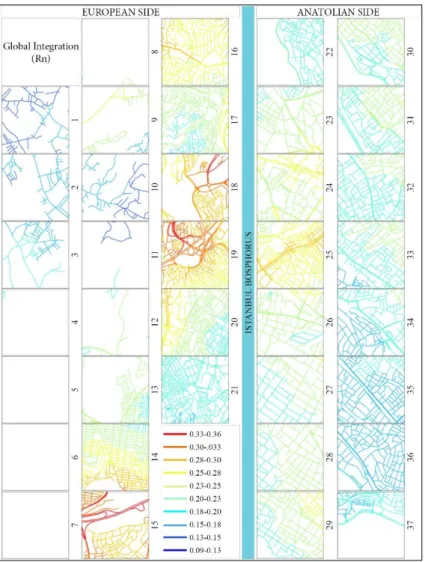
In this research, two integration values ‘global integration (Rn)’ and ‘local integration (R5)’ are calculated via topological step depth method instead of metric depth. Main arterials with high connectivity increases spatial integration values. As there are limited connection from villages and low density settlements in the periphery to main network, integration values in the periphery is very low (Figure 12). If an area is close to the motorways E5 and TEM, integration values increase.
Global integration
Maximum global integration values in Istanbul is calculated as 0,36. Settlements close to the seashore are generally old settlements and integration values in these areas are relatively lower than other regions which can be seen in the cells numbered from 22 to 37 (Figure 12,Figure 13).
Figure 11. Floor area ratio analysis (Kaya, 2010)
olu m e 5, Is su e 1 / Pu bli shed : Jun e 20 17
Highest values concentrated along the highways as in the cells 15, 18, and 19.
Figure 12. Global integration map (Kaya, 2010)
Figure 13. Spatial distribution of global integration (rn) values (Kaya, 2010)
0/ IC O N ARP. 20 17 .15 – E -I SSN : 21 47 -9380 Local integration
The global integration measures the topological accessibility in the whole city. On the other hand, close environment is very important for pedestrians, therefore, accessibility in the local level is calculated for Istanbul. Mean road segment length in Istanbul is 110m and mean walking distance is accepted as nearly 500m, therefore, in this research, the radius of the local integration is defined as ‘R5’ (Figure 14).
Parameters related to use and perception:
The new model is developed here to analyze levels of enclosure in 3D. Although the visibility analysis of space-syntax examines user’s perception of open spaces via classifying level of visibility for each point, it does not include differences in 3D space. Instead of analyzing built space, this analysis measures enclosure of open volume. Various enclosure levels have different effects on perception (Ashihara, 1983; Giritlioğlu, 1991).
Figure 14. Spatial distribution of local integration (r5) values (Kaya, 2010)
olu m e 5, Is su e 1 / Pu bli shed : Jun e 20 17
3D spatial enclosure model
The construction law does not allow building facades that are narrow than 6 meters, therefore in this research distance between measurement points is defined as 5 m to be able to measure the effect of all buildings on 3D enclosure. The model reveals the irregular enclosure distribution of the Istanbul. The irregularity can be seen the linear axis and internal structure of cells both. Open spaces do not increase regularly from center to periphery because of the leapfrog development (Figure 15). This parameter might help to create hierarchical open space or green system.
The European and Anatolian sides also have great differences: Multistory historical buildings with narrow roads increases the enclosure levels in European side. On the other hand, Anatolian side have detached houses with relatively wider roads resulting a balanced distribution with lower enclosure values (Figure 15). This model can be used to control building heights to reduce enclosure level within the dense urban structure without the need of expropriation a whole building.
Figure 15. 3D spatial enclosure analysis (Kaya, 2010)
0/ IC O N ARP. 20 17 .15 – E -I SSN : 21 47 -9380
Parameters related to complexity of urban pattern
Advanced methodology is needed to measure complex structure of urban pattern. As the urban pattern consists of built space and non-built space; two parameters have been used in this research to examine them. Fractal geometry measures the complexity of built space and Lacunarity measures the variety of distribution of open spaces.
Fractal dimension (Fd)
Fractal dimension of cells don’t represent regular change from the center to the periphery of the city. The hilly topography, forest and water basin areas, and leapfrog development are some factors affecting this irregular structure. Highest Fd. is seen in the historical core. In the 21st cell it is higher than 1.8. It reaches to
1.77 in the Anatolian side (Figure 16).
These high Fd values denote the rich cultural background and highly complex spatial pattern. It reduces to the 1.4s in the newly
Figure 16. Fractal dimension values in Istanbul case (Kaya, 2010)
olu m e 5, Is su e 1 / Pu bli shed : Jun e 20 17
developed periphery. Changing values show the multifractal nature of the city. Fractal dimension gives information related to the complexity rather than geometry. Thus, different patterns can have similar fractal dimensions as in cells 20 and 32 in the Figure 16. Lacunarity helps us to reveal differences between these cells. Lacunarity
Variation in the number and size of open spaces changes the lacunarity values for each cell.
Natural elements like Marmara Sea, Black Sea, The Bosporus, and The Golden Horn define the dominates to the form of the city. Moreover, forests and water basins, and hilly topography give shape to the city via limiting the built space and density. Because of the non-built areas in the periphery, lacunarity values are high in the first two columns of the Figure 17. Although the cells that located on the forest areas, like 4th to 7th cells, have largest open
spaces, lacunarity values in these cells can be lower than some
Figure 17. Lacunarity values in Istanbul case (Kaya, 2010)
32
0/ IC O N ARP. 20 17 .15 – E -I SSN : 21 47 -9380
other cells like 8th to 13th cells (Figure 17) because of the low
heterogeneity of open spaces with variable sizes.
Evaluation of lacunarity with fractal dimension gives the more meaningful results as it can be seen in Figure 18. In this graph, two major group of cells can be recognized: The cells from 1 to 13 are periphery of Istanbul and other cells are central area of the city. Density and built up area increases after 13th cell this increases
fractal dimension and decreases the lacunarity values (Figure 18).
Urban DNA: Morphogenetic structure of İstanbul
The four main parameter categories analyses different characteristics of urban pattern and generally, each parameter itself does not correspond rich urban pattern structure. Therefore, the approach in this research proposes to use and represent all measures together to summarize various aspects of the urban pattern. All cells along the selected axis were projected to a line and a matrix created by all analyses (Figure 19).
While global integration values increase towards the central core, local integration values of cells that are located 7 km far from the center are higher than central cells. Distance measurement of cluster analysis examined here to evaluate outputs. Correlation analysis is widely used technique to measure similarities, but proximity matrix of cluster analysis is also efficient technique to analyze similarity of variables (Kalaycı, 2005) (Table 1). Lower
0 0.5 1 1.5 2 1 2 3 4 5 6 7 8 9 10 11 12 13 14 15 16 17 18 19 20 21 B o sp h o ru s 22 23 24 25 26 27 28 29 30 31 32 33 34 35 36 37 va lue s Cell no
Fractal dimension and lacunarity
Fractal dimension Figure 18. Variation of fractal
dimension and lacunarity
values (Kaya, 2010)
Figure 19. The change of values in each analysis for all selected cells (Kaya, 2010)
olu m e 5, Is su e 1 / Pu bli shed : Jun e 20 17
distance between fractal dimension and local integration means that the fractal dimension is related to the local network as well (Table 1, Figure 21). Global integration values are dominated by main arterials, on the other hand in local scale, local road network becomes more important. Thus, local integration values represent local pattern better than global integration values. The distance between BCR and lacunarity shows the interrelation of the amount of open spaces and lacunarity. On the other hand, as explained before, lacunarity is more than the amount of open spaces, which measures the heterogeneity of distribution, and therefore these analyses should be evaluated as complementary parameters for each other. The lowest value in the table 1 is the proximity of BCR and global integration, it is interesting but this might be arises from the opportunity to create shorter linear axial map in low-density areas and ability of creating more alternative connections.
Table 1. Proximity matrix for all parameters (Kaya, 2010)
Parameters Euclidean distances
Parameters Fractal dim. Lacunarity Global int. Local int. BCR FAR Fractal dimension 0,0 6,6 8,2 2,2 8,2 5,5 Lacunarity 6,6 0,0 2,8 5,7 3,2 5,2 Global integration (Rn) 8,2 2,8 0,0 7,1 0,7 4,8 Local integration (R5) 2,2 5,7 7,1 0,0 7,2 4,9 BCR 8,2 3,2 0,7 7,2 0,0 4,4 FAR 5,5 5,2 4,8 4,9 4,4 0,0
The cells representing the different periods of development have different measurement results and if the number of classes reduced, the differences between cells can be seen easily (Figure 19, Figure 20). Although there is no crisp boundaries, Fractal dimension, BCR, and FAR values are higher in the historical core and lower in the periphery (Figure 21). Especially cells representing development after 1975 have relatively lower values.
Figure 20. Reclassified values of cells into three groups (Kaya, 2010)
0/ IC O N ARP. 20 17 .15 – E -I SSN : 21 47 -9380
As the city grows, city block and plot sizes decreased and road network became the more complicated. Building densities increases in the historical areas. This process result in higher values in the historical urban pattern (Figure 21). Because of the rapid development, open spaces in the central area decreased and thus, the lacunarity values in the historical center generally lower than newly developed areas. Several cultures on urban pattern result in the increase fractal dimension values in the historical core gets the highest values, which reflects the high complexity of urban pattern.
All values in the Figure 21 falls between the cells representing growth period 1975 and 1990, because, city spread dramatically after 1950s. Especially after the construction of two bridges over the Bosporus in 1973 and 1988, new motorways increases this spread (Kubat et al., 2007). On the other hand, the forest areas and water basins located in the periphery of the city, thus non-built areas and low density modern settlements reduces the values. Spatial distribution of values is parallel with development periods. The city developed in both sides of the Bosporus; therefore, values calculated from 15th to 30th cells are higher than other cells ( Figure 22).
These cells represent the historical core of the city in the European and the Anatolian sides. The highest values located in
Figure 21. Changing parameter value in different development periods (Kaya, 2010)
Figure 22. Calculation results for each cell for all parameters
olu m e 5, Is su e 1 / Pu bli shed : Jun e 20 17
the European side of Istanbul (Figure 22). Although there is an obvious change in after the 13th cell, values in the east and west sides also fluctuates. This shows the heterogeneous structure and irregularity of urban pattern in the cells that located on a linear section from center to the periphery. The values are 0 in between the cells 21 and 22, because this area is Bosporus.
CONCLUSION
Urban pattern is a highly complex system that needs an advanced approach to explore various faces of urban pattern. This approach focuses on using different methods together starting from basic geometrical features to complexity of built structure to draw a detailed picture of urban pattern. Analyzing ‘geometrical’, ‘topological’, ‘use and perception related’ and ‘complexity parameters’ together as a complementary parameters set helps to comprehend the complex urban pattern.
The proposed model in this research addresses the importance of quantitative methods that enables to understand spatial characteristics of complex urban pattern. According to the findings of the study, some potential contributions and potential improvements of this model can be summarized as follows:
This model includes several parameters together to draw an extensive map of urban pattern starting from building scale to urban whole, therefore it can be evaluated as an interface that combining various scales of urban pattern. The effect of spatial development process can be seen in the resulting map. This output contributes to the evaluation and control of urban growth problems.
Use of geometrical, topological, use and perceptional and complexity parameters in this model also can help to evaluate interaction among them. For example, fractal dimension, lacunarity, and 3D spatial openness parameters measures spatial distribution of buildings and open spaces, thus these parameters have relation with BCR and building density as well. These relationships can help to control development. Parameters related to the complexity are relatively
independent from the geometry and size. They measure the intrinsic characteristics of urban pattern, therefore, the model can help to compare cities that have different macroform and size. Creating a DNA of urban pattern might contribute to variate planning decisions and regulations in each city based on the local characteristics of them.
The urban DNA maps also represents the change of values from center to the periphery, the spatial distribution of values can help to recognize problematic areas.
0/ IC O N ARP. 20 17 .15 – E -I SSN : 21 47 -9380
This model can be used to analyze existing urban pattern and might help to create new urban pattern alternatives that are compatible with existing pattern while does not have to be geometrically identical. This is very crucial for urban design studies in the continuity and adaptation of historical urban patterns. Thus, this methodology and outputs of this research has a potential to be used by municipalities, urban planners and urban designers, landscape architects in defining the vernacular characteristics and evaluating the new design proposals. This can be evaluated as a new perspective to the parametric urban design.
In this research few parameters used together to analyze urban pattern via selecting limited number of 1kmx1km cells located on a linear axis in Istanbul. However, this research can be extended via selecting more patterns in different areas that have different typologies such as squatter areas, gated communities, seashore neighborhoods, etc. to build a more comprehensive model of urban DNA.
The main characteristics of urban pattern in Istanbul is the irregular character of the city that does not regularly increase or decrease from center to periphery. The level of complexity increases in relation with the age of urban pattern. The increasing fractal dimensions in the world cities converge to the value of 1.7, Values over 1.7 calculated in case studies reflects that the urban pattern of İstanbul is turning into a highly complex and original structure in the course of time.
Theoretical definition of parameters and analyzing the morphogenetic characteristics of urban pattern was the main focus of this research. On the other hand, each parameter can be improved via adding new capabilities such as analyzing fractal geometry in three dimensional space, or the effect of topography in spatial integration. In the future outputs of this method should be associated with urban systems and uses of space such as hierarchical distribution of green systems or transportation, or evaluation of outputs to define potential uses of smallest open spaces in urban pattern.
Acknowledgements
This study is based on the PhD thesis titled “A Quantitative Method Proposal for The Analysis of the Dynamic Structure of Urban Pattern” that was supported by the Turkish Scientific and Technological Research Council of Turkey (TUBITAK) under the 2214 Fellowship Program
olu m e 5, Is su e 1 / Pu bli shed : Jun e 20 17 REFERENCES
Alexander, C., Ishikawa, S., & Silverstein, M. (1977). A pattern language: towns, buildings, construction. New York: Oxford University Press.
Ashihara, Y. (1983). The Aesthetic Townscape. Cambridge, MA: MIT Press.
Bacon, E. N. (1975). Design of cities: Thames and Hudson London. Bar-Yam, Y. (2003). Dynamics of Complex Systems: Westview
Press.
Batty, M. (2008). Generating Cities from the Bottom-Up: Using Complexity Theory for Effective Design. Cluster. Retrieved from http://www.cluster.eu/v2/editions/batty/
Batty, M., & Rana, S. (2004). The automatic definition and generation of axial lines and axial maps. Environment and Planning B: Planning and Design, 31, 615-640.
Boccaletti, S., Latora, V., Moreno, Y., Chavez, M., & Hwang, D. U. (2006). Complex networks: Structure and dynamics. Physics Reports, 424(4-5), 175-308.
Bolliger, J., Lischke, H., & Green, D. G. (2005). Simulating the spatial and temporal dynamics of landscapes using generic and complex models. Ecological Complexity, 2(2), 107-116. Çağdaş, G. (1996). A shape grammar: the language of traditional
Turkish houses. Environment and Planning B: Planning and Design, 23, 443-464.
Chen, Y., & Zhou, Y. (2003). The rank-size rule and fractal hierarchies of cities: mathematical models and empirical analyses. Environment and Planning B: Planning and Design, 30, 799-818.
Chen, Y., & Zhou, Y. (2004). Multi-fractal measures of city-size distributions based on the three-parameter Zipf model. Chaos, Solitons & Fractals, 22(4), 793-805.
Chen, Y., & Zhou, Y. (2008). Scaling laws and indications of self-organized criticality in urban systems. Chaos, Solitons & Fractals, 35(1), 85-98.
Cheng, Q. (1999). Multifractality and spatial statistics. Computers & Geosciences, 25(9), 949-961.
Figueiredo, L., & Amorim, L. (2005). Continuity lines in the axial system. Paper presented at the Proceedings 5th International Symposium on Space Syntax, Delft University of Technology, Delft.
Filho, M. B., & Sobreira, F. (2005). Assessing Texture Pattern in Slums Across Scales. Casa Working Paper Series, No. 87. Centre for Advanced Planning Analysis, University College
London. London. Retrieved from
http://www.casa.ucl.ac.uk/working_papers/paper87.pdf Frankhauser, P. (1998a). The Fractal Approach. A New Tool for
the Spatial Analysis of Urban Agglomerations. Population: An English Selection, 10(1), 205-240.
Frankhauser, P. (1998b). Fractal geometry of urban patterns and their morphogenesis. Discrete Dynamics in Nature and Society, 2(2), 127-145.
Franz, G., & Wiener, J. M. (2008). From space syntax to space semantics: a behaviorally and perceptually oriented
0/ IC O N ARP. 20 17 .15 – E -I SSN : 21 47 -9380
methodology for the efficient description of the geometry and topology of environments. Environment and Planning B: Planning and Design, 35, 574-592.
Giritlioğlu, C. (1991). Şehirsel Mekan Öğeleri ve Tasarımı. Istanbul, Turkey: İ. T. Ü Mimarlık Fakültesi Yayınları.
Haag, G. (1994). The Rank-Size Distribution Of Settlements As A Dynamic Multifractal Phenomenon. Chaos Solitons & Fractals, 4(4), 519-534.
Helbing, D. (1998). Models for Pedestrian Behavior. Arxiv preprint cond-mat/9805089.
Hillier, B. (1996). Space is the Machine: A Configurational Theory of Architecture. Cambridge: Cambridge University Press. Hillier, B. (1999). The hidden geometry of deformed grids: or, why
space syntax works, when it looks as though it shouldn't. Environment and Planning B: Planning and Design, 26, 169-191.
Hillier, B., & Hanson, J. (1984). The social logic of space: Cambridge University Press, Cambridge, UK.
Hillier, B., Leaman, A., Stansall, P., & Bedford, M. (1976). Space syntax. Environment and Planning B: Planning and Design, 3, 147-185.
Kalaycı, Ş. (Ed.) (2005). SPSS uygulamalı çok değişkenli istatistik teknikleri. Ankara: Asil Yayın Dağıtım Ltd.Şti.
Kaya, H. S. (2003). Evaluating Richness Of Urban Space By Using Chaos Theory And Fractal Geometry. (Masters thesis), Istanbul Technical University, İstanbul.
Kaya, H. S. (2010). A quantitative method proposal for the analysis of the dynamic structure of urban pattern. (PhD Thesis), Istanbul.
Kaya, H. S., & Bölen, F. (2006). Kentsel Mekan Organizasyonundaki Farklılıkların Fraktal Analiz Yöntemi ile Değerlendirilmesi. Journal of İstanbul Kültür University, 4(4), 153-172.
Kim, Y. O., & Penn, A. (2004). Linking the Spatial Syntax of Cognitive Maps to the Spatial Syntax of the Environment.
Environment and Behavior, 36(4), 483-504.
doi:10.1177/0013916503261384
Kruger, M. J. T. (1989). On node and axial grid maps: distance measures and related topics. Paper presented at the European Conference on the Representation and Management of Urban Change, Cambridge, UK.
Krüger, M. J. T. (1979). An approach to buiIt-form connectivity at an urban scale: variations of connectivity and adjacency measures amongst zones and other related topics. Environment and Planning B, 6, 305-320.
Krüger, M. J. T. (1980). An approach to built-form connectivity at an urban scale: relationships between built-form connectivity, adjacency measures, and urban spatial structure. Environment and Planning B, 7, 163-194. Kubat, A. S. (1997). The morphological characteristics of
Anatolian fortified towns. Environment and Planning B: Planning and Design, 24, 95-123.
Kubat, A. S., Kaya, H. S., Sari, F., Guler, G., & Ozer, O. (2007, 12-15 June). The Effects Of Proposed Bridges On Urban Macroform
olu m e 5, Is su e 1 / Pu bli shed : Jun e 20 17
Of Istanbul: a syntactic evaluation. Paper presented at the 6th International Space Syntax Symposium, Istanbul Technical University, Istanbul, Turkey.
Mandelbrot, B. B. (1977). Fractals: Form, Chance, and Dimension. San Francisco, ABD: WH Freeman.
Mandelbrot, B. B. (1982). The Fractal Geometry of Nature. NY, ABD: WH Freeman.
Mandelbrot, B. B., Frame, M., & Robert, A. M. (2001). Fractals Encyclopedia of Physical Science and Technology (pp. 185-207). New York: Academic Press.
Peitgen, H. O., Jürgens, H., & Saupe, D. (2004). Chaos and Fractals: New Frontiers of Science: Springer Verlag Press.
Salingaros, N. A. (2000). Complexity and Urban Coherence. Journal of Urban Design, 5(3), 291-316.
Salingaros, N. A. (2003). Connecting the fractal city. Keynote speech, 5th Biennial of town planners in Europe, Barcelona. Salingaros, N. A., & West, B. J. (1999). A universal rule for the
distribution of sizes. Environment, 26, 909-923.
Schroder, C., Mackaness, W., & Reitsma, F. (2007, 11-13th April 2007). Quantifying Urban Visibility Using 3D Space Syntax. Paper presented at the Geographic Information Science research conference (GISRUK), Maynooth, Ireland.
Stamps, A. E. I. (2003). Advances in visual diversity and entropy. Environment and Planning B: Planning and Design, 30, 449-463.
Steadman, P. (1983). Architectural Morphology: An Introduction to the Geometry of Building Plans. London: Pion Ltd.
Stiny, G. (1980). Introduction to shape and shape grammars. Environment and Planning B, 7, 343-351.
Stiny, G., & Gips, J. (1971). Shape Grammars and The Generative Specification Of Painting and Sculpture. Paper presented at the Information Processing: Proceedings of IFIP Congress, Netherlands.
Teller, J. (2003). A spherical metric for the field-oriented analysis of complex urban open spaces. Environment and Planning B: Planning and Design, 30, 339-356.
Topcu, M., & Kubat, A. S. (2012). Old and new city: morphological analysis of Antakya. Paper presented at the 8th International Space Syntax Symposium.
Turner, A. (2001). Depthmap: A program to perform visibility graph analysis. Paper presented at the Proceedings of the 3rd Space Syntax Symposium.
Turner, A., Doxa, M., O Sullivan, D., & Penn, A. (2001). From isovists to visibility graphs: a methodology for the analysis of architectural space. Environment and Planning B, 28(1), 103-122.
Volchenkov, D., & Blanchard, P. (2008). Scaling and universality in city space syntax: Between Zipf and Matthew. Physica A: Statistical Mechanics and its Applications, 387(10), 2353-2364.
Wilson, A. G. (2002). Complex spatial systems: Challenges for modellers. Mathematical and Computer Modelling, 36(3), 379-387.
0/ IC O N ARP. 20 17 .15 – E -I SSN : 21 47 -9380
Wu, X. B., & Sui, D. Z. (2001). An initial exploration of a lacunarity-based segregation measure. Environment and Planning B: Planning and Design, 28, 433-446.
Wurster, C. B. (1969) Cities and Space: The Future Use of Urban Land: The Book is based on 1962 RFF (Resources For The Future) Forum on The Future Use of Urban Space. Baltimore and London: Johns Hopkins Press.
Xu, Y. (2005). Explanation of scaling phenomenon based on fractal fragmentation. Mechanics Research Communications, 32(2), 209-220.
Zacharias, J. (1999). Preferences for view corridors through the urban environment. Landscape and Urban Planning, 43(4), 217-225.
Zipf, G. K. (1972). Human Behavior and the Principle of Least Effort. New York: Hafner Publishing Company.
Resume
H. Serdar Kaya is currently working as a Lecturer at Istanbul Technical University, Faculty of Architecture, Urban and Regional Planning Department. His researches mainly focus on mathematical models and complexity theories in urban planning, urban design and architecture. He had studied on mathematical methods for analyzing and simulating urban space as an affiliate academic for one year in 2008 in the “Centre for Advanced Spatial Analysis (CASA)” research center at University College London, UK.
Fulin Bölen is a professor emeritus in the Department of Urban and Regional Planning at the Istanbul Technical University. Her principal research topics include residential densities, land use and urban form, land use intensity and urban quality of life, physical quality of residential environment and land values.