INTEGRATION OF OPENGL GRAPHIC LIBRARIES WITH SPATIAL DATABASE AS AN ANALYSIS AND VISUALIZATION TOOL
Süleyman EKENa*, Saffet TÜRKOĞLUa, Ahmet SAYARa
aKocaeli University, Computer Engineering Department, 41380, Kocaeli, Turkey [email protected], [email protected],
Abstract
Geographic and non-geographic attributes of spatial datasets enable them to be integrated and analyzed in many GIS applications through visualization and analysis tools. The coordinate values of spatial datasets are defined by SRS (Spatial Referencing System) and projection together, and converted to the screen (view) coordinates through coordinate transformations. In this study, we approach this issue in reverse order. We create digitized object in view coordinates by interactive tools developed in open source OpenGL graphics libraries and convert them in real world spatial data. Spatial datasets are stored as vector objects such as points, lines and polygons in spatial databases in a predefined SRS and projection system. The effectiveness of the system will be tested through the application of the spatial queries on the stored objects. Analyses include but are not limited to calculating the area and circumference of polygons and determining of the distances between two points (e.g. houses) or polygons (regions).
Keywords: Spatial databases, Visualization, Satellite image processing, GIS image analysis
ANALİZ VE GÖRÜNTÜLEME ARACI OLARAK OPENGL GRAFİK KÜTÜPHANELERİ VE MEKÂNSAL VERİTABANIN BÜTÜNLEŞTİRİLMESİ
Özet
Mekansal veri setlerinin koordinat değerleri Mekansal Referanslama Sistemi (MRS) ve projeksiyon ile birlikte tanımlanır ve koordinat transformasyonları aracılığıyla ekran (görüntü) koordinatlarına dönüştürülür. Bu çalışmada, bu konuya tersten yaklaşıyoruz. Açık kaynak kod OpenGL grafik kütüphanesinde geliştirilen interaktif araçlar yardımıyla ekran koordinatlarında sayılaştırılmış nesne oluşturup bu nesneleri gerçek dünya mekânsal verilerine dönüştürüyoruz. Mekansal veri setleri; daha önceden tanımlı bir MRS ve projeksiyon sistemindeki mekansal veritabanlarında noktalar, çizgiler ve poligonlar gibi vektör nesneleri olarak saklanırlar. Sistemin etkinliği depolanan nesneler üzerinde mekânsal sorgulama uygulamaları aracılığıyla test edilmiştir. Analizler poligonların alan ve çevrelerinin bulunması ve iki nokta (evler gibi) veya poligon (bölge) arasındaki uzaklığın bulunması olup bunlarla sınırlı değildir.
Anahtar Kelimeler: Mekânsal veritabanları, Görselleştirme, Uydu görüntü işleme, GIS görüntü analizi
1. Introduction
A Geographic Information System (GIS) integrates hardware, software, and data for capturing, managing, analyzing, and displaying all forms of geographically referenced information [1]. GIS have many applications in various fields. Major areas of GIS applications can be grouped into five categories: (1) Facilities management, (2) environment and natural resources management, (3) street network, (4) planning and engineering, and (5) land information systems.
GIS are primarily associated with spatial data. Spatial data are key components of GIS applications. Most of time, spatial data are stored in spatial databases with their geographic and non-geographic attributes. Spatial data can be in the form of graphics, images, tables, texts, figures, and many others. Spatial datasets have three common characteristics. The first one is spatial orientation defined with spatial coordinates of geographic entities [2]. Topolojic relations between the geographic intities such as distance, adjacency and conjoint are derived from this characteristics. The second characteristic is that spatial data contains specific attributes like quantity, classification and name besides spatial location. The third one is that spatial data include features varying over time.
PostgreSQL and its GIS extension called PostGIS have many features to store, query and analyse spatial data. PostgreSQL evolved from the research project at the University of California, Berkeley. Currently, PostgreSQL is one of the most powerful and feature richest open-source object-relational database system. Compared to other commercial database management systems, it has distinctive properties: it contains technical characteristic of object-oriented programming. It allows users to identify not only traditional types like character, numeric, and time data types, but also specific types such as point, line, polygon, and geometry data types. It supports SQL. It works effectively, even if database size exceeds 100 Gb. PostGIS adds support for geographic objects to the PostgreSQL object-relational database. In effect, PostGIS spatially enables the PostgreSQL server, allowing it to be used as a backend spatial database for GIS. Records are stored into database by means of PostGIS, extension of PostgreSQL. PostGIS uses SQL to query on both spatial and attribute data [3].
OpenGL (Open Graphics Library) is a standard specification defining an industry-leading, cross-language, cross-platform application programming interface for writing applications that produce 2D and 3D computer graphics, and only major API with support for virtually all operating systems [4]. Many languages such as FORTRAN, Java, Tcl/Tk, and Python have OpenGL bindings to take advantage of OpenGL visualization power.
The work presented in this paper is aimed at developing a system enabling users to create spatial queries over a real-world satellite images interactively. Computing area and circumference of a selected polygon can be given as examples of spatial queries. Jogl, Java’s OpenGL graphic library, is used for user interface design. PostGIS, extension of PostgreSQL, is used for storing data into spatial database. Case study is implemented on actual satellite image of The Cyprus of Island.
The remaining of the article is organized as follows: Section 2 presents some related works regarding integration of OpenGL library with spatial databases and spatial analysis. In Section 3, architecture is proposed enabling interactive spatial queries and manipulations over the real-world satellite images. Section 4 gives some experimental results. Section 5 draws a conclusion and suggesting some future enhancements.
2. Related Works
GIS are mostly used in spatial analysis and statistics applications. Spatial information is expected to answer complex questions regarding space. This can be achieved in two ways. One is based on vector-based representations of spatial data, and other one is based on raster representations of spatial data. Spatial analysis in GIS involves three types of operations: (1) attribute query also known as non-spatial query, (2) spatial query and (3) generation of new data sets from the original database [5].
Vector-based analysis uses features from different layers to form a new map and give new information and features that were not present in the individual maps. In raster analysis, geographic units are regularly spaced, and the location of each unit is referenced by row and column positions [6].
Extensive efforts have been afforded to deal with spatial analysis. Ghouse and Duckham [7] investigate a new, integrated technique for storing and retrieving spatially varying data quality information in a relational spatial database. Rather than storing global data quality statements, the system enables data quality information to be referenced to a spatial framework, individual spatial objects, or even parts of spatial objects. Their performance evaluation was conducted using Oracle Spatial database and case study of cadastral data for parts of Victoria, Australia.
Huang and et al. [8] proposed a novel image representation method to capture the information about spatial relationships between objects in a picture. Zhang and Li [9] presented the features of spatial data, the shortcomings of relational database, how to create spatial database by PostGIS, and the management methods of spatial data in PostGIS.
Eken and Sayar [10] proposed a technique converting raster satellite island images into vector data as polygons by using edge-detection algorithm. This enables storing satellite images as vector objects into spatial database systems and utilizing the advanced built-in spatial functions and queries developed by the spatial database community. The effectiveness of the technique is demonstrated by applying on a system detecting spatiotemporal changes in a real-world island satellite image.
OpenGL and GIS are used together in many applications. Steinhage and et al. [11] proposed an automated approach on 3D building reconstruction which employs a
model-based data fusion from aerial images, airborne laser scanning and GIS. Jie et al. [12] build a highly efficient large-scale high-density complex 3D graphics engine based on OpenGL. With the two dimensional electronic map data, it realizes the three-dimensional display and roam of buildings in Wuhan City, which may be helpful to the design and realization of the 3D GIS.
OpenGL technology has begun to be integrated into existing spatial databases. These are listed like ArcGIS application of ESRI Company, components and libraries used by Microsoft, Oracle and IBM companies. These applications are all commercial. The study presented in this paper is aimed at developing an open source extensible system enabling users to create spatial queries interactively over the real world satellite images.
3. Material and Method
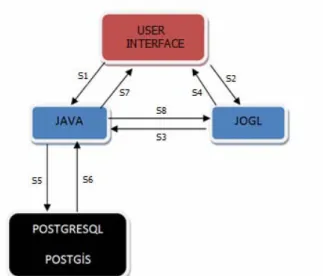
The proposed architecture consists of four layers (see Figure.1). The layers are listed as (1) open source data warehouses layer from where base map is received, (2) database layer, (3) middle layer, and (4) user interface layer. The base map is a satellite imagerywhich is dynamically captured from a Web Map Server (WMS) or a Google Map server. The second layer (database layer) consists of Object Relational Database Management System (ORDBMS), and PostGIS (extension of PostgreSQL). Jogl (Java’s OpenGL graphic library), JAVA and graphical user interface libraries forms the third layer, which is also called middle layer. Jogl includes functions which are necessary for user interface. Also, according to directives from the user interface layer drawing shapes and storing database operations are performed by sending marked points to Jogl library and spatial database.
Figure 1. Overall architecture and its components
The messaging and communications among these components are illustrated in Figure 2. The numbered solid arrows show the message and data flow in the proposed architecture. The details are given in stepwise order as below.
Step 1: The user selects the type of operation (polygon or line drawing).
Step 2: To draw a shape, mouse listener function on Jogl listens the user actions and keeps the coordinates of the points which are created by users’ mouse clicking on the screen.
Step 3: The received coordinates are sent to Java.
Step 4: Jogl makes drawing according to the set of points and operation type specified by the user.
Step 5: Java informs PostGIS and PostgreSQL of the user’s actions by invoking their built-in functions.
Step 6: If the user wants to query area, area of polygon is calculated by means of functions of PostGIS and sent to Java. Area is calculated in unit square, and then converted to the metric system in accordance with the selected spatial reference (SRS) and projection systems. Similar steps are performed for calculations of circumference of a polygon and distance between two points or polygons.
Step 7: The values of the calculated area, circumference, and length are displayed on the user interface.
Step 8: If the user wants to change drawn polygon, database is updated and then this event is sent to Jogl library to be drawn on the user interface and drawing process is carried out.
Figure 2. A detailed schema of system
The spatial queries such as area of a polygon, circumference of a polygon, length and distance of two polygons or points are performed by means of PostGIS’s built-in functions. The details are presented as follows.
Spatial data are defined with their geometric and non-geometric attributes. Geometic attributes. Geometric attributes or properties are represented by points, lines, linestrings and polygons. A sample SQL query to store newly created polygon object (with five-vertex) into PostgreSQL spatial database is given below:
INSERT INTO polygon_region VALUES ('Cyprus', ‘POLYGON ((0 10, 15 10, 15 -5, 10 -5, 10 0, 0 10))');
Polygons can be represented mathematically by a circular sequence of points providing that starting and ending points are of the same (x, y) values. So, we pay attention that starting and ending points of polygon are same by storing starting point in a buffer.
The area and circumference values of polygon drawn by user are obtained via built-in functions of PostGIS. The real area and circumference are calculated from the polygon coordinates according to the below formula:
Real_ circumference = Map scale value * Circumference from polygon in database (1) Real_area = (Map scale value)2 * Area calculated from polygon in database (2)
Sample spatial queries performing area and circumference of a polygon are given below:
SELECT Round(ST_Area (polygon)) FROM dbpolygon WHERE name= 'Cyprus' SELECT Round(ST_length(ST_Boundary(polygon))), FROM dbpolygon WHERE name='Cyprus'
To find distance between two points or polygons, firstly projection from pixel coordinates to latitude and longitude coordinates should be done. And then, Euclidean distance formula is used for calculating the shortest distance between the points (ignoring any hills and etc.). Instead of using pixel numbers, let’s call the lower left corner (a, b), the lower right corner (c, d), the upper left corner (f, g), and the upper right corner (k, l). Let’s call the (latitude, longitude) values of the lower left corner (u, v), of the lower right corner (r, s), the upper left corner (p, q), and the upper right one (m, n). Then we might assume linear formulas:
X=Ax+By+C Y=Dx+Ey+F (3)
where we put in the pixel values for (x, y) and get (lat, long) for (X,Y). For example, the lower left corner values would give
u=Aa+Bb+C v=Da+Eb+F (4)
Using the lower right and upper left corners listed above result in four more equations. Those equations in the unknowns of A, B, C, D, E and F are given below. A = (-g*u+d*u-d*p-r*b+r*g+p*b)/(f*b-c*b+c*g-a*g+a*d-f*d) B = -(-f*u+a*p+c*u-c*p-a*r+f*r)/(f*b-c*b+c*g-a*g+a*d-f*d) C = (-p*c*b+d*a*p-d*f*u+r*f*b+g*c*u-g*a*r)/ (f*b-c*b+c*g-a*g+a*d-f*d) D = (-g*v+d*v-d*q-s*b+s*g+q*b)/(f*b-c*b+c*g-a*g+a*d-f*d) E = -(-f*v+a*q+c*v-c*q-a*s+f*s)/(f*b-c*b+c*g-a*g+a*d-f*d) (5)
F = (-q*c*b+d*a*q-d*f*v+s*f*b+g*c*v-g*a*s)/(f*b-c*b+c*g-a*g+a*d-f*d)
The values of the small letters at the right side of the above equations might be in world coordinates (lat, long) or in screen coordinates (x, y). No matter what type they are in, equations are solved and converted to each other easily. Once we know the values of A, B, C, D, E and F, we can easily convert (lat, long) values to (x, y) values and vice versa.
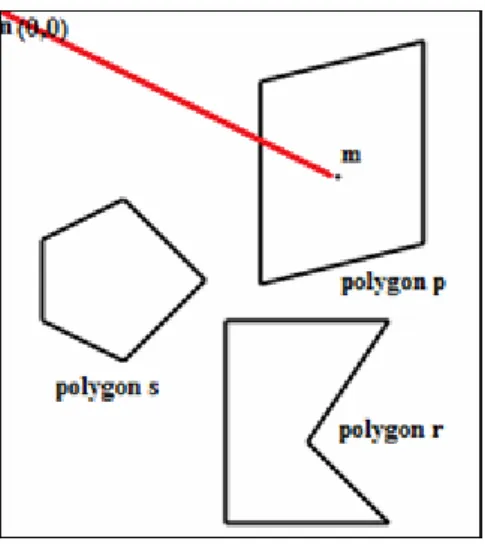
The user can draw multiple polygons on the image and then calculate area or circumference of desired polygon by clicking inside it. The point-in-polygon (PIP) test asks whether a given point in the plane lies inside, outside, or on the boundary of a polygon. Auxiliary point lying outside of polygon is used for this PIP test. Providing that m is given point and n is auxiliary point, consider a line segment emanating from m to n. If the number of times this m-n line segment intersects the line segments making up the polygon is even then the point m is outside the polygon. If the number of intersections is odd then the point m lies inside the polygon [13]. We consider that auxiliary point n is first point (0, 0) of canvas screen. This test is applied for all polygons. If number of intersections for polygon p is odd, given point m is inside of polygon p. In Figure. 3, m-n line segment intersects polygon p once (odd) and polygon r and s none (even).
4. Case Study and Evaluation
The effectiveness of the proposed system has been proven by four application scenarios. In scenario 1, user draws polygons on the satellite image (Figure. 4.a). Afterwards, area and circumference of the polygons are computed by means of interactive user tools (Figure. 4.b-d). Polygons are stored into the backend spatial database.
(a) (b)
(c) (d) Figure 4. Scenario-1 Adding polygon: (a) drawn polygons by user on the
satellite image, (b-d) calculating of area and circumference of drawn polygons The actual area of Cyprus is 9251 km2 and circumference is 648 km. By using the proposed system, the area and circumference is calculated as 9043 km2 and 544 km respectively. Compared to the actual measured values, the system gives 95% correct results in terms of area and 85% correct results in terms of circumference.
Scenario 2 is about updating spatial objects stored in a spatial database through the interactive user tools. In this case, users upload spatial objects from the database and overlay on the map. Afterwards, users play with the objects by dragging/dropping (Figure. 5.a), or even can change the objects by holding one of the vertexes of the polygon and dragging to somewhere else (Figure. 5.b.
(a) (b) Figure 5. Scenario-2 Editing polygon: (a) first status of the to be
edited polygon, (b) last status of the to be edited polygon
In scenario 3 (Figure. 6), a line is drawn between two points, and distance values are calculated as described earlier in this document.
(a) (b) Figure 6. Scenario-3 Calculating distance between
(a) two polygons, (b) and points
The actual distance between the west and east of The Cyprus Island is 132 km and the distance between the north and south is 116 km. The measured values are 120 km and 105 km respectively.
The actual area of Imbros is 289 km2 and circumference is 95 km. By using the proposed system, the area and circumference is calculated as 270 km2 and 70 km respectively. The actual distance between the west and east of The Imbros is 29.5 km and the distance between the north and south is 13 km. The measured values are 24.11 km and 8.85 km respectively (see Figure. 7).
(a) (b) Figure 7. Scenario-4 calculating (a) area and circumference of
Imbros, (b) and distance between its end points
The differences of the distance values possibly might come from many factors such as mathematical groundings, and the precision of the users’ interaction with the system through the mouse. The obtained results are sufficient in terms of the importance of the application. Applications performing of calculating the area and circumference of polygons and determining of the distances between two points (e.g. houses) or polygons (regions) are not very common.
5. Results and Future Works
In this study, we have developed interactive visualization and analysis tools for spatial data sets overlaid on satellite map images. This is achieved by integrating open source graphic library (OpenGL) with spatial databases (PostGIS). Developed tools also support spatial queries such as calculating distance, area and circumferences of the selected objects. Examples of these are given in Section 2. The work presented in this paper is developed with open source technologies in terms of databases and graphics libraries. This enables application specific customization and extensions of the developed code, reduced dependency on software vendors, and finally lower cost.
In the future we plan to extend the study with the shape files. Shape files are popular geospatial vector data format for GIS software. Large scale vector data in shape files are possibly be overlaid on remotely sensed satellite images. This enable us to
create a tool to prove the correctness (or the quality) of the location and shapes of spatial objects located on earth.
References
[1] Fischer MM, Nijkamp P. Geographic Information Systems, Spatial Modeling, and Policy Evaluation. New York: Springer; 1993.
[2] Jing T, Juan X, Li W. Open Source Software Approach for Internet GIS and Its Application. Intelligent Information Technology Application (IITA 08). 2008; 3: 264-268.
[3] Lodha SK, Faaland NM, Wong G, Charaniya AP, Srikumar R, Keller AK. Consistent visualization and querying of GIS databases by a location-aware mobile agent. Computer Graphics International Proceedings. 2003; 248-253.
[4] Gözcü Ş. Opengl ve Glut İle Oyun Programcılığına Giriş. İstanbul: Seçkin Yayıncılık; 2006.
[5] Burrough PA. Principles of Geographical Information System for Land Assessment. Oxford: Clardon Press; 1987.
[6] Raju PLN. Spatial Data Analysis. Satellite Remote Sensing and GIS Applications in Agricultural Meteorology. 2003; 151-174.
[7] Ghouse ZM, Duckham M. Integrated Storage and Querying of Spatially Varying Data Quality Information in a Relational Spatial Database. Transactions in GIS. 2009; 13(1):25-42.
[8] Huang PW, Hsu L, Su YW, Lin PL. Spatial inference and similarity retrieval of an intelligent image database system based on object’s spanning representation. Journal of Visual Languages and Computing. 2008; 19:637-651.
[9] Lijing Z, Jing Y. Management Methods of Spatial Data Based on PostGIS. Second Pacific-Asia Conference on Circuits. Communications and System (PACCS). 2010; 410-413.
[11] Steinhage V, Behley J, Meisel S, Cremers A.B. Automated Updating and Maintenance of 3D City Models. Core Spatial Databases-Updating, Maintenance and Sevices. 2010; 38:20-25.
[12] Jie L, Yuhao W, Honggang Q, Yi-na L, Jun-cai1 T. Implementation of Large Number of Buildings Based On OpenGL. 5th International Conference on Wireless Communications Networking and Mobile Computing. 2009; 1-3.
[13] Cromley R.G. Digital Cartography, Englewood Cliffs. New Jersey: Prentice Hall 1992.