31 COMPANY EMPLOYEES’ PERCEPTION OF R&D AND PERCEPTION’S EFFECT ON
DEPARTMENTS
Ali TÜKENMEZ1, Yemliha DURMAZ2, Zafer ASLAN3
1-2-3 Istanbul Aydın University, Computer Engineering Department, 34295, Istanbul, Turkey
[email protected] , [email protected]
Abstract
In today’s business world, research and development activities become important in each passing day by techno-logical development and accelerated innovation. Harmonization of research and development activities (R&D) what have a place in companies and other departments is so important for organizational productivity. Accord-ingly, in this research, determination of company employees’ R&D perception and its influence on other depart-ments can strengthen the relation between departdepart-ments. Research conducted is carried out with 211 private sector employee who labors in Yıldız Technical University’s Techno Park in Davutpaşa and Istanbul Technical Uni-versity. In Scope of research, descriptive statistics are examined related with R&D attitudes. Also difference of R&D attitudes’ level related with employees’ department type and reliability analysis are materialized. The results ob-tained indicated that the relation between departments, information Exchange of departments and department employee’s sense of proximity are high correlated. Finally, in scope of research, each of departments’ employee sense of R&D department are detected as different from each other.
Keywords: R&D, Performance, R&D Management, Coordination
ŞİRKET ÇALIŞANLARININ AR-GE ALGISI VE DEPARTMANLAR ÜZERİNDEKİ ETKİSİ (TEKNOPARK UYGULAMASI)
Özet
Bugünün iş dünyasında, AR-GE faaliyetleri teknolojik gelişmeler ve hızlanan inovasyonlar ile birlikte daha da önemli hale gelmektedir. Şirketlerdeki AR-GE faaliyetlerinin diğer departmanlarla uyum içerisinde olması, organizasyonun üretkenlik / verimlilik için oldukça önemlidir. Buna göre, bu çalışmada, AR-GE çalışmaları ile ilgili kararlılığın şirket çalışanlarınca benimsenmesi ve diğer bölümler üzerindeki etkileri departmanlar arasındaki ilişkiyi güçlendirebi-lir. Bu çalışma, Davutpaşa’daki Yıldız Teknik Üniversitesi Techno Park’ında ve İstanbul Teknik Üniversitesi’nde çalı-şan 211 özel sektör çalıçalı-şanı ile yürütülmüştür. Araştırma kapsamında, AR-GE bakış açısı/ davranışıyla ilgili konu-lar tanımlayıcı istatistik çalışmakonu-ları ile incelenmiştir. Ayrıca, çalışankonu-ların çalıştıkkonu-ları departman türüne göre AR-GE bakış açısındaki farklılık seviyesi ve AR-GE çalışmalarına olan güvenilirlik analizi somutlaştırılmıştır. Departman-lar arası ilişkiyle ilgili elde edilen sonuçDepartman-lar, bölüm çalışanDepartman-larının yakınlık hissi ve departmanDepartman-lar arası bilgi deği-şimi arasındaki korelasyonun yüksek seviyede olduğu görülmektedir. Sonuç olarak, araştırma kapsamında de-partmanın her bir çalışan için Ar-Ge dede-partmanına olan duyarlılığının birbirinden farklı olduğu tespit edilmiştir. Anahtar Kelimeler: AR-GE, Performans, AR-GE Yönetimi, Koordinasyon
32
1. INTRODUCTION
Nowadays companies are in fierce competition environment. To provide a competitive advantage requ-ires producing original product and developing them. At this point, R&D activities what takes an impor-tant place in technological management studies come into prominence. According to Bölükbaş (2013: 6), R&D is a creative work what increases the repertory of culture, people and society and uses it to de-sign a new process, system and applications. R&D activities include product dede-sign and software activi-ties and experimental, scientific and technique content. This process goes on till idea to product, product to continuous improvement, improvement to annihilation of product (Öner, 2006: 6). In case mentioned R&D activities are so costly and comprehensive. These activities include risks in point of companies beca-use of its long term yield. To minimize risks and take advantage of R&D are based on systematic R&D ac-tivities and performance measurement. Following the searches indicates that invention, patent, techno-logy management; novelty, product development, know-how and industrial design are concepts which support R&D activities. Besides R&D management is guidance and control of R&D activities and its sta-ges. These activities have importance for companies (Palamutçuoğlu, 2015: 72). So as to meet an expec-tation of customers by one product of brand, R&D activities assume following the latest developments and its implementation. Companies’ technological information what shape with R&D activities, provide community development and economic progress (Ekren, 2000: 1-2). When R&D activities in company are increased, It is possible to enhance of scientific progression. So reformed R&D activities play a significant role to determine the development level of country (Kavak, 2009: 620). As noted above, the aims of R&D management are producing a qualified product and achieving the improvement activities. Also a set of corrective actions is done for increasing of productivity and regulating the workflow planning correla-ted with company policies (Tuominen vd., 1999: 138). According to Knowledge-Based Approach, infor-mation and qualifications of companies are sum of company employees’ inforinfor-mation and qualifications (Demirkaya vd., 2011: 447). Therefore, the most important factor while managing of R&D process is com-pany employees. Human factor has a directly effect on communication between departments. Additio-nally, it is seen obviously that developing product and idea is correlate with learning activities of emp-loyees. The two general results of R&D activities are learning and innovation. Also, information transfer and shared vision are two factor what have an impact on organizational learning. According to Çemberci (2013:116-117), there is a relation between dependence of learning, shared vision, information transfer and organizational project and departmental project learning. Namely, as information sharing inter de-partment in organization is increase, so organizational and dede-partmental project learning becomes easy. Thus, success of project and success of organization increase. Therefore, information transfers inter de-partments and so important. Besides that the R&D related to relational operations was also important to a good connection between the many actors involved in the conception of services. At the same time research results determine that the possibility of considering projects and researchers widens the scope and allows the inclusion of a net of actors who might interact and contribute to R&D especially in servi-ces. So interdepartmental information sharing seems to contribute to the improvement of statistics re-lated to R&D in services (Bohrer & Raupp de Vargas, 2014: 803). In this context, organization’s R&D cul-ture – the values and behaviors that contribute to the unique social and psychological environment of an organization improves with collaboration of interdepartmental (Tagged, 2014: 5) So carrying out the
33
relationship between departments and process of collaboration is required for completing R&D activi-ties and job process productively. This survey purposes to create awareness by displaying the sense of R&D activities of company employees and alteration about their sense.
2. AIM OF THE STUDY
The purpose of this study was to examine the company employees’ perception of R&D and this perception’s effect on departments. So answers of the research will be searched these questions:
1) What is the perception level related proximity of departments about R&D? 2) What is the eliciting level of department to R&D department?
3) What is the level of relation between other departments and R&D department?
4) Is there any connection between department’s relation with R&D and proximity to R&D and eliciting to R&D?
5) Do the levels of attitude become different from department to other departments?
3. METHOD
3.1 Universe and Sampling
Target population of this study composes of private sector employees of Yıldız Technical University’s Techno Park in Davutpaşa and Istanbul Technical University. In this research, convenience-sampling method used because of the difficulty related with reaching all the employees. Population of is formed with 500 private sector employees working in techno park. Research sample consists of 211 private sec-tor employee who labors in Yıldız Technical University’s Techno Park in Davutpaşa and Istanbul Techni-cal University. To reckoning of sample, method of Techni-calculation, which numbers the known population, is used. After calculation, results 217 persons are suitable for analyzing. In scope of research, 230 question-naires were distributed. Nine questionquestion-naires are regarded as invalid because of their empty answers. Fi-nally, 211-sample sizes are reached.
3.2 Data Collection and Devices
Data collection tool of this research is a survey form what has a two section. Chapter one includes de-mographic features (gender, age,, educational background, marital status, term of employment in com-pany, term of employment in sector and department). In second section, private sector employees’ atti-tude scale about R&D what has 26 items was used. In this research Likert-type scale what has a 5-point from 1 ‘strongly disagree’ to 5 ‘strongly agree’ was implemented to measure the participation level of pri-vate company employees. Survey questions about R&D attitude are classified in 3 section. Chapter A queries proximity of other departments to R&D department, Chapter B examine providing information from other departments to R&D department. In addition, chapter C queries the relationship between R&D department and other departments. This scale’s validity and reliability study is carried out in simi-lar way with Murat (2010).
34
3.3 Analysis of Data
Data of this survey were analyzed with Statistical Package for Social Sciences (SPSS) 21. In this research, private sector employees who are in the group of sample were analyzed. In addition, their demographic characteristics were analyzed with Frequency and Percentage analyzes. For descriptive statistics belong to R&D scale were calculated arithmetic mean and standard deviation. Because data distribution is pa-rametric (normal distribution), analysis of variance is used to compare 3 and more group key to scale of R&D’s demographic characteristic. As a result of variance analyze, Scheffe Test was used to find a varia-tion between groups. For specifying the relavaria-tion between R&D and other departments, proximity to R&D and providing information to R&D department, Pearson correlation analyze was done. Finally to examine the reliability test belong to scale, Cronbach’s Alpha reliability analysis was done.
4. RESULTS
Table 1 shows preliminary results of the study.
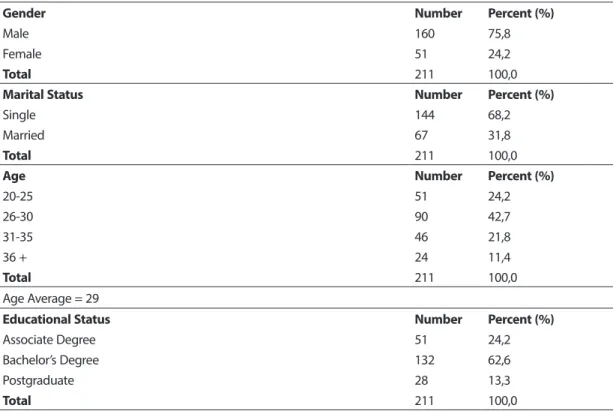
According to study, 75,8 % of survey participants were male. 68,5 % of survey participants were single, 42,7 % of survey participants were between 26-30 ages. Besides that Participant of this survey has a age average as 29. Most of the participants were graduated from bachelor’s degree with the 62,2 %. Also 32,7 % of survey participants are working in this company about one year.
Table 1. Survey Participants’ Demographic Information
Gender Number Percent (%)
Male 160 75,8
Female 51 24,2
Total 211 100,0
Marital Status Number Percent (%)
Single 144 68,2
Married 67 31,8
Total 211 100,0
Age Number Percent (%)
20-25 51 24,2 26-30 90 42,7 31-35 46 21,8 36 + 24 11,4 Total 211 100,0 Age Average = 29
Educational Status Number Percent (%)
Associate Degree 51 24,2
Bachelor’s Degree 132 62,6
Postgraduate 28 13,3
35
Operation Time in Company Number Percent (%)
1 year 69 32,7
2 year 51 24,2
3 year 35 16,6
4 year + 56 26,5
Total 211 100,0
Operation Time Average in Company = 2,74
Operation Time in Sector Number Percent (%)
1-3 year 66 31,3
4-6 year 72 34,1
7-9 year 39 18,5
10 year + 34 16,1
Total 211 100,0
Operation Time Average in Sector = 5,5
Department Number Percent (%)
HR 36 17,1 Software 71 33,6 Reporting 17 8,1 Finance 39 18,5 It 37 17,5 Other 11 5,2 Total 211 100,0
The average of term of employment was determined as some 2,74 years. Furthermore, 34,7 % of par-ticipants have a 4-6 years of sector experience. Otherwise professional time average in sector is 5,5 ye-ars. In scope of research, 17,1 % of participants are working in HR department and 33,6% of participants are working in Software department. Also, 8,1 % of participants are working in Reporting department. Finally, 18,5 % of participants are working in Finance department and 5,2 % of participants are working in Other departments.
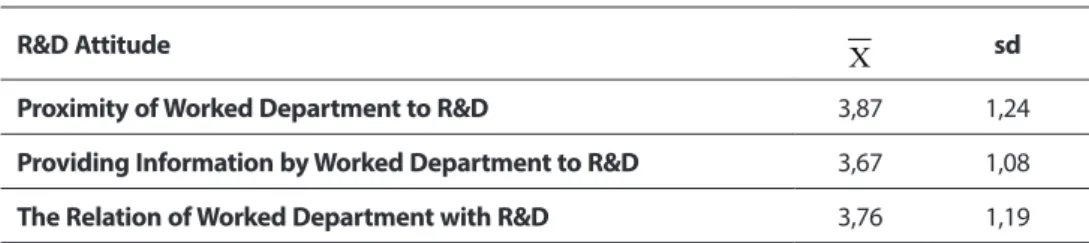
Table 2. Descriptive Statistics Related R&D Attitude
R&D Attitude Χ sd
Proximity of Worked Department to R&D 3,87 1,24 Providing Information by Worked Department to R&D 3,67 1,08 The Relation of Worked Department with R&D 3,76 1,19
36
When employees’ attitude analyzed from different department, the level of “Proximity of Worked De-partment to R&D” ( = 3,87), “Providing Information by Worked DeDe-partment to R&D” ( = 3,67) and “The Relation of Worked Department with R&D” ( = 3,76) was determined as a high level, (Table 2).
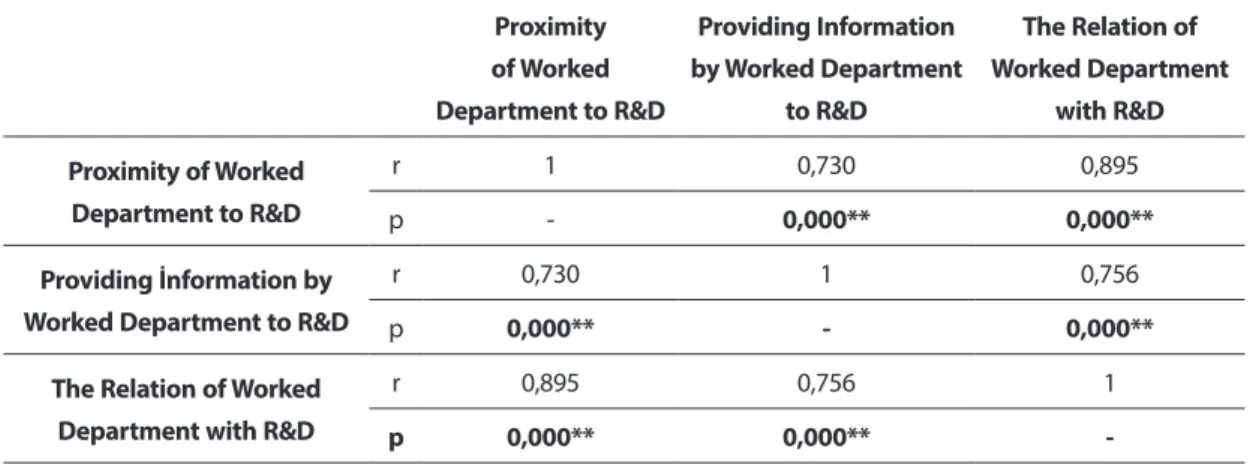
Table 3. The Results of Pearson Correlation Coefficient Proximity of Worked Department to R&D Providing Information by Worked Department to R&D The Relation of Worked Department with R&D Proximity of Worked Department to R&D r 1 0,730 0,895 p - 0,000** 0,000** Providing İnformation by Worked Department to R&D
r 0,730 1 0,756
p 0,000** - 0,000**
The Relation of Worked Department with R&D
r 0,895 0,756 1
p 0,000** 0,000**
-** p<0,01
In this survey “The Relation of Worked Department with R&D”, “Proximity of Worked Department to R&D” and “Providing Information by Worked Department to R&D” are determined as correlated sub-dimensions (p<0,01). When factors of relation are examined, the highest relation can be seen between “Proximity of Worked Department to R&D” and “The Relation of Worked Department with R&D”. This correlation is de-termined very strong and positively (p<0,01) (0,80<r<1,0) (r=0,895), (Table 3).
In this study one way ANOVA analyze is done to determine significant difference of participant’s R&D sub-dimension attitude by worked department. Also, there is a statistically significant difference of R&D attitudes according to worked department. To determine the variance of employees’ R&D attitudes, ho-mogeneity test is done. Results of this test show that variances are homogen (p>0,05 p=0,076). Because of these results to get to the bottom of this differences, Scheffe Test is used as a type of Post Hoc Test, (Table 4)..
37 Table 4. One Way ANOVA Test Results Belong to Differentiation of Participant’s R&D Attitude Level According to
Worked Department Type
R&D Attitudes Worked
Department n Χ sd F p Scheffe Proximity of Worked Department to R&D HR 36 3,47 1,24 4,678 0,008* 2-4 2-5 SOFTWARE 71 3,90 1,18 REPORTING 17 4,11 0,77 FINANCE 39 3,94 0,69 IT 37 4,05 1,01 OTHER 11 3,83 1,12 Providing İnformation by Worked Department to R&D
HR 36 3,60 0,90 3,379 0,016 2-3 4-5 SOFTWARE 71 3,75 0,63 REPORTING 17 3,79 0,91 FINANCE 39 3,64 0,60 IT 37 3,53 0,90 OTHER 11 3,75 0,66
The Relation of Worked Department with R&D
HR 36 3,53 1,18 6,757 0,002* 2-4 2-5 SOFTWARE 71 3,81 1,01 REPORTING 17 4,05 0,93 FINANCE 39 3,75 0,72 IT 37 3,79 0,88 OTHER 11 3,75 1,12
*P<0,05 1. group HR, 2. group SOFTWARE, 3. group REPORTING 4. group FINANCE, 5.grup IT, 6. group OTHER
As a result of Scheffe Test, there is a difference about the perceived relation of worked department with R&D department (F=6,757, p<0,05). In consequence of Scheffe Test, employees of software department have a statistically significant difference from finance department and IT department. Otherwise the sense of relation between Software department ( = 3,81) and R&D is higher than finance department
( = 3,74) and IT department ( = 3,79)’s sense of R&D.
As a result of Scheffe Test there are some differences about providing information by worked department to R&D department (F= 3,379, p<0,05). Software department employees has a statistically significant dif-ference from employees of Reporting department and IT department. Sense of providing information by Reporting Department ( = 3,79) to R&D is higher then Software department’s sense of employees
( = 3,75). Besides this Sense of providing information by Finance department ( = 3,64) to R&D is
38
As a result of Scheffe Test, there is some differences about proximity of worked department to R&D de-partment (F= 4,678, p<0,05). As a result of Scheffe Test, software dede-partment employees are different from IT department and Finance department employees. Finance department employees’ proximity of R&D is higher ( = 3,94) than software department employees and ( = 3,90) HR department
emplo-yees ( = 3,47). Also, IT department emploemplo-yees’ proximity of R&D is higher than ( = 4,05) software de-partment ( = 3,90) too.
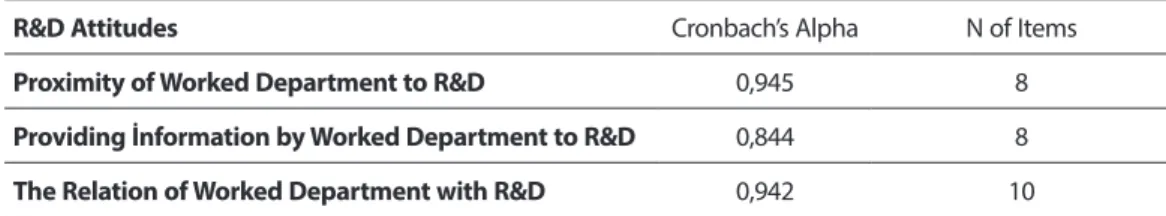
Table 5. Results of Reliability Analysis Belong to R&D Attitudes
R&D Attitudes Cronbach’s Alpha N of Items
Proximity of Worked Department to R&D 0,945 8 Providing İnformation by Worked Department to R&D 0,844 8 The Relation of Worked Department with R&D 0,942 10
It is seen in Table 5, “Providing Information by Worked Department to R&D” sub-dimensions’ reliability co-efficient is calculated as 0,945. “Providing Information by Worked Department to R&D” sub-dimension’s reliability coefficient is calculated as 0,844. “Also, The Relation of Worked Department with R&D” sub-dimension’s reliability coefficient is calculated as 0,942. These values indicate that dimensions have high reliability (0,80< Cronbach’s Alpha<1,0).
5. CONCLUSION
Most effective way to proceed in the end is produced of technology. At this point, R&D activities come into prominence what have an important position in technological management. R&D activities include risks for companies because of its costly and wide ranged structure. Also, long term gaining pose some risks to companies too. In an attempt to minimize these risks, R&D activities must be conducted syste-matically and assays must be done correctly. Besides, for getting better results about R&D activities re-quire to work with other departments correspondingly. Therefore, to determine how department’s emp-loyees perceive R&D activities gives tips to company managers about making real of strategic targets by all the departments.
In the direction of this survey, which is realized to determine company employees’ sense of R&D activi-ties and their effect on departments, indicated that the relation between departments, information Exc-hange between departments and department employee’s sense of proximity are statistically high corre-lated. In addition, according to study, proximity of other departments to R&D department and relation between other departments and R&D department have a positive relationship. In this study, there is a sig-nificant difference between employees of finance department, IT department and software department. At finance departments employees’ proximity of R&D department is higher than software department’s
39
employees. Besides that, IT department employees’ proximity of R&D department is higher than emplo-yees at software departments too.
The study results show that when information Exchange is increased, relation between departments will improves and proximity level will rise. Then powered communication network and interaction yields what increases the productivity of company. Besides depending on interdepartmental sharing, sense of R&D indicates variability. Also department employees who work for common targets get high level R&D per-ception. High level perception of R&D belong to financial department shows that effective financial po-lity and financial strategies determines R&D activities. So, this situation creates a sharing environment of interdepartmental. Similarly, IT department what determines the problems about informatics and tech-nology and finds a solution about them requires being active with close contact.
In today’s working conditions with high-level competition, being positioned of R&D department in anot-her department’s mind is so important for sustainability of company. If sense of R&D department rises, employees adopt the innovations in company quickly. Also in this way, adaptation of employees to tech-nological progress must be taken into consideration. Admittedly, importance of informing to employees about innovation process and provide them to work for common targets bring to company success and outstanding performance in the long term. It should not be forgotten that when company motivates employees, they would work for company objectives.
6. REFERENCES
Bohrer, C. T., & Raupp de Vargas, E. (2014). Can R&D Be Identified and Measured in Services? Empirical
Evidence From University Hospitals. Science and Public Policy, 41(6), 793–808.
Bölükbaş, M. (2013). Analysing of Turkish Defence Industry Projects within the Scope of R&D Management.
İstanbul: War College Strategic Researches Institute , Unpublished Master’s Thesis
Çemberci, M. (2013). The Effect of Organizational Learning on R&D Teams’ Performance Journal of Aca-demic Studies, 15(57), 95-120.
Demirkaya, H., Özcüre, G., & Eryiğit, N. (2011). An Application on The Impacts of Human Resource
Ma-nagement in Technology MaMa-nagement of The Companies. Procedia Social and Behaviorial Sciences (24), 474-486.
Ekren, N. (2000). Information and Economic Effectiveness. Activeline Monthly Banking and Finance Jour-nal (6), 1-2.
Kavak, Ç. (2009). Innovation Concept and It’s Main Indicators in Economy of Knowledge. XI. Academic In-formatic Conference (617-628). Şanlıurfa: Harran University.
Murat, D. K. (2010). The Study of Marketing Effects on R&D Studies. İstanbul: İstanbul Technical University
Institute of Science and Technology, Unpublished Master’s Thesis.
40
Palamutçuoğlu, T. (2015). Administration and Organization Notes. Manisa: Celal Bayar University Kula
Vo-cational School of Higher Education.
Tagged, R. (2014). Developing a Strong R&D Structure to Drive Company Growth. Nu Angle Whıte Paper
(13), 1-10. August 7, 2017, http://nu-angle.com/the-secrets-of-successful-rd/
Tuominena, M., Piippoa, P., Ichimurab, T., & Matsumotob, Y. (1999). An Analysis of Innovation