, where N is the number of cavities in the waveguide. This essential behavior is employed to analyze the transmission response of CCW-based Mach-Zehnder interferometer structures introduced recently.
DOI: 10.1103/PhysRevB.71.085108 PACS number共s兲: 42.70.Qs, 42.60.Da, 42.25.Hz
I. INTRODUCTION
Waveguide structures are essential components of photo-nic integrated circuits. In photophoto-nic crystals 共PC’s兲, it is proposed1 and shown2–6 that the electromagnetic wave can
be guided through sharp bends and intersections with high transmission characteristics. Various designs for waveguide bends have been studied to improve the transmission.7–10
Following the proposal by Yariv et al.,11 coupled cavity waveguides 共CCW’s兲 in photonic crystals have become an intense research subject in recent years, as they provide some advantages over conventional PC-based waveguides.11–14
These advancements open a way to construct extremely compact and efficient integrated photonic circuits.5,6,15,16 Nu-merous CCW-based fundamental optical device components 共e.g., splitters, switches, channel add-drop filters兲 have been demonstrated in the microwave regime and are being readied for the optical regime. In particular, CCW’s can be utilized to construct ultracompact optical delay lines which has a direct impact on the overall device size.17The application potential
of CCW’s drives in turn the investigation of basic optical properties in detail, such as the coupling properties of cavities. Lan et al.18pointed out this necessity and conducted a systematic analysis of defect coupling in one- and two-dimensional photonic crystals using transfer matrix formalism.
In the first part of the paper, we aim to extend the inves-tigation of the coupling properties of CCW’s experimentally and numerically. In particular, we show the exponential de-cay of localized modes within the cavities, by measuring the coupling strength of two cavities as a function of the inter-cavity distance. For this purpose, we employ the tight-binding formalism. Surprisingly, we find that even the result-ing eigenmodes of two merged cavities obey the tight-binding formalism very well, despite the anticipated strong interaction between the individual cavity modes.
In the second part of the paper, we investigate the phase delay spectra of single and coupled cavity structures. It is well known that, in addition to improved transmission char-acteristics, the slow group velocity at the guiding band edges
promotes CCW’s as promising candidates for optical delay lines. An example is the CCW-based Mach-Zehnder interfer-ometer共MZI兲, proposed and demonstrated recently. Soljačić
et al. investigated the phase shift induced by nonlinear
ef-fects in CCW-based MZI numerically.19 Later, Martinez et
al.20 demonstrated experimentally a MZI structure, with a simple transfer function model utilizing the difference in the number of cavities of the respective interferometer branches. Both studies emphasize the compact size of the structures that is required to attain the operational phase shift of. To this end, we measure the phase delay of CCW’s, and dem-onstrate that the phase shift through a cavity is equal to, which then extends linearly to Nfor a CCW consisting of
N cavities. This leads to a clear interpretation of the
opera-tion of a CCW-based MZI in terms of the phase difference 共i.e., difference in the number of cavities兲 between the re-spective branches of the interferometer, and provides support to the transfer function model introduced before.20
This paper is organized as follows: In the second section, we describe the experimental setup and present the measure-ments of confinement effects on a single cavity and the cou-pling strength between two cavities as a function of the in-tercavity distance. The measurement of the phase spectra of single cavity and CCW structures is discussed in the third section. In the fourth section, we employ the results of the third section to analyze the operation of CCW-based MZI structures. We conclude by summarizing the results.
II. COUPLED CAVITIES: CONFINEMENT EFFECTS AND THE COUPLING CONSTANT
The photonic crystal in this study consists of a hexagonal array of cylindrical alumina rods with radius r = 1.575 mm and a refractive index of n = 3.13 at microwave frequencies. The lattice constant is chosen as a = 7.0 mm. The transmis-sion and phase spectra are measured using a network ana-lyzer and a set of horn antennas in TM polarization关electric field E perpendicular to the plane of two-dimensional 共2D兲 photonic crystal兴. In all measurements, the major
propaga-tion direcpropaga-tion is set along the ⌫K direction of the photonic crystal, unless otherwise noted. Numerical simulations based on the finite-difference time-domain 共FDTD兲 method are used to compare with experimental data.
We first measured the transmission spectrum of the uni-form photonic crystal, which exhibits a band gap between 12.8 and 18.7 GHz. A single cavity is formed by removing a rod within the photonic crystal, which appears as a localized mode within the gap of the transmission spectrum. For the investigation of the confinement, two PC structures are con-structed having 5⫻29 and 7⫻29 layers, respectively. Since the crystal is much thicker along the lateral direction, the confinement depends on the number of layers around the cavity along the propagation direction, which we denote as “cap layers” in this paper. For the present structures, the number of cap layers are 2 and 3, respectively. Figure 1 shows the transmission spectra of a single cavity for two confinement strengths, which are depicted by the schematics in the figure. The cavity mode frequency located at f = 16.898 GHz appears to be independent of the confinement strength. This agrees well with the transfer matrix results where no significant dependence of resonant frequency on defect size is reported.18
It is evident that the spectral width and the transmission amplitude shrinks with increasing confinement, as expected. We further note that the dashed lines obtained by FDTD measurements are in very good agreement with the measure-ments.
Figure 2 shows the transmission spectra for two defects of radii 0.645 and 6.06 mm, respectively. The larger defect ex-hibits two modes, from which only the high-frequency mode is shown on the figure. For the small defect, the resonance frequency is f = 15.98 and 16.02 GHz for strong and weak confinements, respectively. In the case of large defect, the resonance occurs at f = 16.90 and 16.92 GHz, respectively. Even though a shift of resonance frequency is noticeable, we refrain from attributing this shift solely to the finite size of the defect. This is because the small distortions of the rod positions while modifying the confinement strength共i.e.,
re-moving or adding rods to cap layers兲 may alter the frequency of the cavity and cause a shift of similar magnitude.
Although the confinement strength does not alter the reso-nance mode, the spectral broadening of the mode depends on it. We find that adding one more cap layer to each end of the crystal increases the confinement drastically, evident from the decrease of the spectral width of the mode.
If two or more cavities are present, it is well known that the eigenmode of the single cavity splits into coupled modes. This phenomenon is investigated experimentally and de-scribed within the classical wave analog of the tight-binding 共TB兲 approximation for photonic crystal structures in detail.11–14,21–23In the following, we will present the
depen-dence of the coupling parameter to the intercavity distance for two cavities. Based on the formulation of Ref. 12, the eigenfrequencies of two coupled cavities are given by
1,2=⍀
冑
1 ±1
1 ±␣1
, 共1兲
where␣1 and1are the first-order coupling parameters
de-fined as
␣1=
冕
drជ共rជ兲Eជ⍀共rជ兲 · Eជ⍀共rជ−⌳xˆ兲, 共2a兲1=
冕
drជ0共r − ⌳xˆ兲Eជ⍀共rជ兲 · Eជ⍀共rជ−⌳xˆ兲. 共2b兲Here, Eជ⍀共rជ兲 describes the single-cavity mode, 0共rជ兲 and
共rជ兲=共rជ−⌳xˆ兲 are the dielectric functions of the single- and coupled-cavity systems, respectively, and ⌳ is the distance between the cavities.
For an array of cavities, where each cavity interacts weakly with neighboring cavities, a defect band 共waveguid-ing band兲 is formed. Similar to the two-coupled-cavity case, FIG. 1. Measured 共solid lines兲 and simulated 共dashed lines兲
transmission spectrum of a single cavity for the number 2共gray兲 and 3共black兲 of confining layers. Top right: Schematics of the re-spective structures共full lateral width is not shown兲.
FIG. 2. Transmission spectra for a defect of radius r = 0.645 mm共left panel兲 and of a defect of radius r=6.06 mm 共right panel兲. Upper 共lower兲 curves correspond to weak 共strong兲 confine-ment. Schematics display the strong confinement structures for re-spective defect sizes.
this can be written as
Eជ共rជ兲 = E0
兺
n
e−ink⌳Eជ⍀共rជ− n⌳xˆ兲. 共3兲 A simple expression for the dispersion relation of the waveguiding band is given by
共k兲 = ⍀关1 +cos共k⌳兲兴, 共4兲 where=兩1−␣1兩 is the coupling constant parameter, which
can be obtained from the splitting of the eigenmodes of two coupled cavities. After obtaining⍀, 1, and 2 from
mea-surements or simulations, one can determine␣1 and1
val-ues by using Eqs.共2a兲 and 共2b兲. The bandwidth of the guided modes is proportional to the coupling constant and to the single-cavity frequency
⌬= 2⍀. 共5兲
Thus, an alternative method for obtaining the coupling con-stant is measuring the bandwidth of the waveguide and the resonance frequency of an isolated cavity.
Based on this formalism, we investigate the dependence of the coupling constant to the distance between the cavities. Two cavities are formed by removing rods within the PC. The distance between the cavities is changed by an integer multiple of the crystal period from a to 4a. By determining the eigenfrequencies from the transmission spectra, the TB coupling constant is calculated. Table I lists the measured and simulated data for the eigenmode frequencies of two coupled cavities and the corresponding calculated TB cou-pling constant.
In Fig. 3, we plot the calculated coupling constant as a function of the distance between the cavities. Since the spa-tial extent of the modes decays exponenspa-tially, the coupling constant, which essentially depends on the overlap integral of the eigenmodes, also shows an exponential decay. Here, we observe an interesting behavior: when the intercavity dis-tance is a, the two cavities actually merge to into a single multimode cavity of size 2a, and the modes of this cavity are strongly interacting. Yet, the resulting mode splitting can be described within the TB formalism and the coupling constant fits to the exponential decay behavior very well, as shown in Fig. 3. However, second nearest neighbor couplings become significant with decreasing intercavity distance, therefore,
formalism in its transmission characteristies.
We note that the exponential dependence is obtained be-tween the nondegenerate fundamental mode of the cavities. In the case of modes with nonisotropic spatial extension, the overlap of the fields, and hence the coupling constant as a function of intercavity distance may deviate from the expo-nential behavior.
III. THE PHASE SPECTRA OF COUPLED CAVITIES The phase information of the transmitted electromagnetic wave is required to determine the dispersion of PC struc-tures. Various experimental studies are performed to deter-mine the band structure of two-dimensional and three-dimensional photonic crystals for different frequency regimes.24,25The frequency-dependent phase shift is usually
measured by time-domain spectroscopy26–28or using a
net-work analyzer. Robertson et al.26investigated the band struc-ture of alumina based 2D PC’s using coherent microwave transient spectroscopy. Kitahara et al.27measured the
ampli-tude and phase shift of transmission spectra of methylpentene-polymer-based photonic crystals by terahertz time-domain spectroscopy, and found out that the phase shift per crystal plane is equal to. On the other hand, we have found, to our knowledge, that a direct measurement of the phase shift through CCW’s was not reported before,
notwith-FIG. 3. Measured 共solid circles兲 and simulated 共open squares兲 tight-binding coupling constant as a function of the distance be-tween the cavities. The dashed line denotes the exponential fit.
standing the studies involving CCW’s in the context of opti-cal delay lines. In this section of the paper, we are addressing this overlooked issue. As we will present shortly, understand-ing how the phase advances through a CCW provides a clear and solid basis for interpreting the operation of CCW-based MZI structures.
The phase measurements in our study are performed with an HP 8510C network analyzer. The instrument itself pro-vides the phase of the transmitted signal 共S12 in the
S-parameter convention兲, between 关−, +兴, as a function of frequency. These raw data are then “unwrapped” by adding 2 at the ± jumps, to obtain the phase spectra. Since the absolute phase is meaningless, the phase is measured with respect to a calibration. We first perform the calibration in air, by removing the photonic crystal between the antennas, and then measure the relative phase of the relevant structure. Figure 4 shows the measured phase change through single cavity and two and three coupled cavities along with the corresponding transmission spectra. It is evident that the net phase shift through a cavity, and through each of the coupled cavities, is equal to.
The phase shift has its origin in that the cavity in a pho-tonic crystal resembles a Fabry-Perot cavity. The
transmis-sion maximum occurs at the frequency corresponding to a standing wave within the cavity. So when the frequency is changed across the resonance, the induced phase shift be-comes. When many cavities are coupled to form a CCW, each cavity acts as a Fabry-Perot resonator, and the phase difference between the neighboring maxima in the guiding band should be. As a result, the total phase shift across the waveguide should become N, N being the number of cavi-ties. In Fig. 5, we show the phase shift across the guiding band of CCW’s having 12, 13, and 15 cavities, respectively. The width of the guiding band of all three CCW’s are simi-lar. This is expected, since for a sufficiently large number of cavities, the guiding band only depends on the coupling con-stant and the resonant frequency of a single cavity, as given by Eq.共5兲. We observe that the phase spectra scale propor-tional to the number of cavities. The phase at the low-frequency edge of the guiding band is at 4, which then advances to 16, 17, and 19 at the high frequency edge of the guiding band. This type of phase shift is also present across the transmission band of the photonic crystals, where
FIG. 6. Comparison of the transmission spectra of a 7⫻7 MZI 共solid lines, top schematic兲 to one of its isolated branches 共dashed lines, bottom schematic兲. Left panel shows measurements; right panel shows simulations.
FIG. 4. The phase shift共thick lines兲 across a single cavity 共bot-tom兲 and two 共middle兲 and three 共top兲 coupled cavities. Thin lines denote the respective transmission spectrum. Arrows indicate the phase shift through individual cavities.
FIG. 5. The phase共lines extending from zero on the upper left兲 and transmission spectra of CCW’s consisting of N = 15 共solid black兲, 13 共dashed black兲, and 12 共solid gray兲 cavities, respectively.
the induced phase shift 共i.e., number of transmission maxima兲 in the frequency region corresponds to the number of crystal planes across the sample in the chosen propagation direction.27,28
共m⫻n兲 according to the number of cavities only in the branches共i.e., the cavities in the input and output ports are not included in the notation兲. For instance, 7⫻5 denotes a MZI with 7 cavities on one branch and 5 on the other.
First, we demonstrate that an共n⫻n兲 symmetric MZI does not exhibit a dip in the transmission spectrum, since the field traversing either branch acquires the same amount of phase shift. Figure 6 compares the transmission spectrum of a 7 ⫻7 MZI to that of an isolated single branch. The measure-ments on the left panel and simulations on the right panel both show that the double branch and the single branch ex-hibit very similar transmission characteristics. We note that the flatness of the guiding band obtained in the simulations is not present in the measurements. This is related to the irregu-larities共small disordering of the rods兲 of the real PC, which are not present in the simulations. The fluctuations are more pronounced for the double branch, as the interfering fields are more sensitive to small differences in the branches.
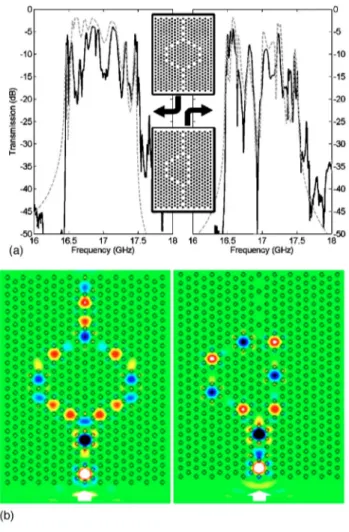
In contrast, the transmission spectra of a 7⫻5 MZI ex-hibits a distinct dip at f = 16.88 GHz of about ⫺60 dB as shown in Fig. 7. Note also the very good agreement between the simulation and experiment for both the 7⫻7 and 7⫻5 MZI structures. In the computed field mode at f
= 16.88 GHz, it is evident that the field interferes destruc-tively at the output Y junction of the 7⫻5 MZI.
To analyze the dip, we assume that the field at the output Y junction can be written as a superposition of the field at either branch:
FIG. 7.共Color online兲 共a兲 Measured 共solid lines兲 and simulated 共dashed lines兲 transmission spectra of 7⫻7 and 7⫻5 MZI struc-tures, depicted in the middle schematics.共b兲 Simulated electric field profile at f = 16.88 GHz for 7⫻7 共left兲 and 7⫻5 共right兲 MZI, re-spectively. The arrow at the bottom indicates the input port.
FIG. 8. Phase共solid black兲 and transmission 共solid gray兲 spectra of 7⫻5 共left兲 and 8⫻4 共right兲 MZI structures共see middle sche-matics兲. The lower figures show the transfer function of Ref. 21. Horizontal dashed lines denote the odd- multiples of the phase dif-ference, whereas vertical dotted lines denote the zeros of the trans-fer function.
Eout共f兲eiout共f兲= E
1共f兲ei1共f兲+ E2共f兲ei2共f兲, 共6兲
where E1,2共f兲 and 1,2共f兲 denote the frequency-dependent
amplitude and phase of the respective branch field. For an ideal MZI, the amplitude will be independent of the branch. Consequently, the outgoing field vanishes whenever the phase difference between the branch fields⌬=1−2is an
odd multiple of共we postpone the discussion of superposi-tion and equal amplitude assumpsuperposi-tions further below兲. In the preceding section, it is demonstrated that the shift in phase across the guiding band of N coupled cavities is equal to N. Since⌬N=2 for the 7⫻5 structure, the difference between the phase shifts of the respective branches will be equal to within the guiding band once. Similarly for an 8⫻4 struc-ture, where ⌬N=4, two interference dips will appear for ⌬=and⌬= 3as⌬advances from 0 to 4across the guiding band. Figure 8 demonstrates the matching between the odd-multiples of the phase difference and the transmis-sion dip.
We have also included transfer function calculations ac-cording to the simple model of Ref. 20. There, the transfer function of the MZI with input output directional couplers is given by T11共f兲 = sin2
冋
⌬N 2 arccos冉
f − f0 kf0冊
册
, T21共f兲 = cos2冋
⌬N 2 arccos冉
f − f0 kf0冊
册
, 共7兲which depends only on the eigenfrequency of an isolated cavity f0, coupling constant, and the difference in the
num-ber of cavities⌬N. According to this formulation, the trans-fer function exhibits a dip for ⌬N=2 and two dips for ⌬N = 4 within the guiding band. We observe that both cases are in good agreement with the measured transmission dips and the odd- phase difference positions.
Should we expect a perfect match between the odd- multiples of the phase difference and the transmission dip? We know that the transmission band includes resonance peaks equal to the number of cavities. Therefore, the trans-mission amplitude at a particular frequency within the guid-ing band will be intrinsically different on each of the CCW branches, containing a different number of cavities, respec-tively. Hence, the condition E1共f兲=E2共f兲 may not be
satis-fied, which, in turn causes a mismatch.
Another issue is the coupling: in Sec. II, the cavity cou-pling is shown to be significant for separations as large as 4 times the lattice period. Thus, for cavities close to the Y junctions, both intrabranch and interbranch interactions are present, which renders the superposition idea of isolated branch fields to an approximation for the full MZI structure. To demonstrate this, we compare the transmission spectrum constructed from the superposition of isolated branch fields to that of the full structure for 7⫻5 MZI:
log10兩E7⫻5ei7⫻5兩2↔ log10兩E7ei7+ E5ei5兩2. 共8兲
As can be seen in Fig. 9 the superposed field does indeed have a dip around that of full MZI, but the discrepancies throughout the guiding band are evident. Clearly, the details of interbranch interactions depend on the particular interfer-ometer geometry.
V. CONCLUSION
In this paper, we have investigated the confinement, cou-pling properties, and the phase spectra of single- and coupled-cavity structures. The resonance frequency of cavi-ties is found to be independent of the confinement strength. The exponential dependence of the cavity coupling constant is obtained experimentally, which agrees very well with cal-culated parameters of the tight-binding formalism. We have experimentally demonstrated that the phase shift across the localized mode of a cavity is equal to. In a CCW consist-ing of N number of cavities, the induced phase shift adds up exactly to N. This result is utilized to analyze the transmis-sion spectra of CCW-based Mach-Zehnder interferometers. We demonstrate that the phase difference between individual branches by odd multiples ofcorresponds to transmission dips in the full Mach-Zehnder structure. Deviations from this matching are discussed in terms of the interbranch coupling and of different transmission amplitudes due to the different number of cavities.
FIG. 9. Comparison of the transmission spectrum measured for full 7⫻5 MZI 共dashed line兲 and that of constructed by superposi-tion of the fields of individual isolated branches共solid line兲.
9A. Chutinan, M. Okano, and S. Noda, Appl. Phys. Lett. 80, 1698
共2002兲.
10A. Talneau, L. L. Gouezigou, N. Bouadma, M. Kafesaki, C. M.
Soukoulis, and M. Agio, Appl. Phys. Lett. 80, 547共2002兲.
11A. Yariv, Y. Xu, R. K. Lee, and A. Scherer, Opt. Lett. 24, 711
共1999兲.
12M. Bayindir, B. Temelkuran, and E. Ozbay, Phys. Rev. Lett. 84,
2140共2000兲; Appl. Phys. Lett. 77, 3902 共2000兲.
13M. Bayindir, E. Ozbay, B. Temelkuran, M. M. Sigalas, C. M.
Soukoulis, R. Biswas, and K. M. Ho, Phys. Rev. B 63, 081107 共2001兲.
14E. Lidorikis, M. M. Sigalas, E. N. Economou, and C. M.
Souk-oulis, Phys. Rev. Lett. 81, 1405共1998兲.
A 20, 147共2003兲.
24S. L. McCall, P. M. Platzman, R. Dalichaouch, D. Smith, and S.
Schultz, Phys. Rev. Lett. 67, 2017共1991兲.
25E. Yablonovitch, T. J. Gmitter, and K. M. Leung, Phys. Rev. Lett.
67, 2295共1991兲.
26W. M. Robertson, G. Arjavalingam, R. D. Meade, K. D.
Brom-mer, A. M. Rappe, and J. D. Joannopoulos, Phys. Rev. Lett. 68, 2023共1992兲; J. Opt. Soc. Am. B 10, 322 共1993兲.
27H. Kitahara, N. Tsumura, H. Kondo, M. W. Takeda, J. W. Haus,
Z. Yuan, N. Kawai, K. Sakoda, and K. Inoue, Phys. Rev. B 64, 045202共2001兲.
28T. Aoki, M. W. Takeda, J. W. Haus, Z. Yuan, M. Tani, K. Sakai,