CONTRIBUTION OF NOTCH SIGNALING ON HCC
STEM CELL STATUS AND UTILIZING TLR
AGONISTS AND NOTCH INHIBITION TO IMPROVE
HCC THERAPY
A THESIS
SUBMITTED TO THE DEPARTMENT OF MOLECULAR BIOLOGY AND GENETICS
AND THE GRADUATE SCHOOL OF ENGINEERING AND SCIENCE OF BILKENT UNIVERSITY
IN PARTIAL FULFILLMENT OF THE REQUIREMENTS FOR THE DEGREE OF
MASTER OF SCIENCE
BY
YUSUF İSMAİL ERTUNA
SEPTEMBER, 2014
I certify that I have read this thesis and that in my opinion it is fully adequate, in scope and in quality, as a thesis for the degree of Master of Science.
Prof.Dr.İhsan Gürsel Prof. Dr. Mehmet Öztürk (Advisor) (Co-Advisor)
I certify that I have read this thesis and that in my opinion it is fully adequate, in scope and in quality, as a thesis for the degree of Master of Science.
I certify that I have read this thesis and that in my opinion it is fully adequate, in scope and in quality, as a thesis for the degree of Master of Science.
Approved for the Graduate School of Engineering and Science
Prof.Dr.Levent Onural
Director of the Graduate School of Engineering and Science Assoc.Prof.Dr.Elif Erson-Bensan
ABSTRACT
CONTRIBUTION OF NOTCH SIGNALING ON HCC STEM CELL STATUS AND UTILIZING TLR AGONISTS AND NOTCH INHIBITION TO IMPROVE
HCC THERAPY Yusuf İsmail ERTUNA
M.Sc. in Molecular Biology and Genetics Supervisor: Prof. Dr. İhsan Gürsel Co–Supervisor: Prof. Dr. Mehmet Öztürk
September 2014, 113 Pages
Hepatocellular carcinoma (HCC) is the seventh most common cancer type worldwide, and ranked third place among cancer-related deaths within both sexes. As in many solid tumors, HCC shelters a cancer stem cell subpopulation, and is held responsible for the resistance developed during chemo-and-radio-therapy of HCC. The only option to cure HCC is liver transplantation, which is the bottleneck to provide a remedy to patients due to limited availability. Understanding the stem cell behavior of HCC would critically contribute to develop effective eradication strategies. In this study, a panel of 17 HCC cell lines was evaluated for their CSC status. Of these cell lines, six of them were determined to be positive for CD133 expression, a cardinal CSC marker. Next, HepG2, Huh7 and Hep3B-TR, (a desensitized TGF-beta-1 receptor clone) were selected and Notch activity vs. CSC fraction was investigated by analyzing CD133+/EpCAM+ levels. Our results revealed that DAPT (a notch inhibitor) led to a drop in CD133+/EpCAM+ levels in HepG2 and Huh7 by half, but not in Hep3B-TR cells, implicating a possible TGFβ1R involvement on CSC generation/maintenance. Treatment of cells with a notch ligand, Jagged-1, however, had little or no positive effect on CD133+/EpCAM+ expressions in all tested cells. Additionally, HCC cells' response to different TLR ligands and the resulting transcript expressions of TLRs were investigated by PCR. Of note, TLRs are widely used in immunotherapy of cancers. Here we aimed to combine Notch inhibitor along with selected TLR ligand, thereby improving tumor clearance in athymic mice xenografted with HCC. We found that in three selected cell lines upon TLR2 ligand stimulation, TLR5 and TLR7 were highly upregulated. Afterwards, treating these HCC cell lines with these ligands we observed that TLR3, TLR7/8 and TLR9 levels were activated. In the final part of this study, tumor-bearing mice with Huh7, were subjected to a combination therapy with TLR ligands +/- DAPT. We demonstrated that combination therapy comprising TLR3, 7/8 and 9 ligands and DAPT (only two injections, a week apart) induced significant tumor regression.
Keywords: Hepatocellular carcinoma, Cancer stem cells, Notch signaling pathway,
ÖZET
NOTCH YOLAĞININ HCC KÖK HÜCRELERİNE KATKISI VE HCC TEDAVİSİ İÇİN TLR ULAKLARIYLA NOTCH BASKILAMASININ KULLANILMASI
Yusuf İsmail ERTUNA
Moleküler Biyoloji ve Genetik Yüksek Lisansı Danışman: Prof. Dr. İhsan Gürsel Eş Danışman: Prof. Dr. Mehmet Öztürk
Eylül 2014, 113 Sayfa
Hepatosellüler karsinom (HSK) dünya genelinde en sık görülen kanserler sıralamasında yedinci, kanser kaynaklı ölümler göz önünde bulundurulduğunda ise üçüncü sırada yer almaktadır. Birçok solid tümörde görüldüğü gibi, HSK tümörlerinde de bir kanser kök hücresi altpopulasyonu barındırdığı bilinmektedir. Bu nedenle, HSK tümörlerinin radyoterapi ve kemoterapiye direnç geliştirmeleri bu kanser kök hücrelerinin düzeyleriyle sağlanmakta olduğu düşünülmektedir. Günümüzde HSK tedavisi için en etkin yol karaciğer naklidir. Ne yazık ki, uygun donör azlığı bu yaklaşımın etkin sağaltım sağlamasını sınırlı kılmaktadır. Bu bağlamda, karaciğer kanseri kök hücre altgruplarıın düzeyini belirleyip miktarını azaltacak stratejiler geliştirmek, etkili tedavi yöntemleri geliştirilmesine önemli katkılarda bulunacaktır. Bu çalışmada, HSK kökenli 17 hücre hattı kullanılarak bir kanser kök hücresi paneli oluşturulmuştur. İmmünoperoksidaz ve Akım Sitometresi tenikleriyle gerçekleştirilen tarama sonunda altı KKH'nın kabul edilen bir kanser kök hücresi (KKH) markörü olan CD133 ifadesi bakımından oldukça pozitif olduğu saptanmıştır. Daha sonra üç hücre hattı HepG2, Huh7 ve Hep3B-TR (TGF-beta-1 almaçı duyarsızlaştırılmış) seçilerek Notch yolağının etkinleştirilmesi veya bastırılması, kök hücre altgrubu düzeyine olan etkisi belirlenmiştir.. Elimizdeki veriler, Huh7 ve HepG2 hücre hatlarının DAPT (bir tür gamma-sekretaz inhibitörü) ile muamelesi sonucunda CD133+/EpCAM+ KKH altpopulasyonun yarı yarıya azaldığını, buna karşın Hep3B-TR hücrelerinde herhangi bir değişim saptanmadığı gözlenmiştir. Bu veriler, TGFβ1 reseptörünün KKH oluşumunda ve devamlılığında rolü olabileceği ihtimalini önermektedir. Seçilen hücre hatlarının Jagged-1 (Notch ligandı) ile muamelesi sonucunda ise KKH altpopulasyonu üzerine bir etki oluşturmamıştır. Bu hücre hatlarının bazal toll-benzeri reseptör (TLR) ifade düzeyleri PZR metoduyla incelendiğinde, TLR5 ve TLR7 transkriptlerinin yüksek olduğu bulunmuştur. Bu ulaklarla hücreleri muamele edilince de, TLR3, 7/8 ve 9 genlerinin daha fazla arttırdığı gözlenmiştir. Bu sonuçların ışığında Notch inhibitörüyle, TLR ulaklarının kullanıldığı bir kombine tedavinin HSK tümörü geliştirilmiş atimik farede denenmesi planlanmıştır. Çalışmanın son bölümünde, Huh7 hücreleri farelere zenograft edilerek, ya sadece TLR ligand kokteyli, veya DAPT eklenmiş şekilde, iki kez peritümöral enjeksiyonu sonunda (bir hafta arayla)
tümör düzeyleri takip edilmiştir. Sonuç olarak, TLR3, TLR7/8 ve TLR9 ligandlarının DAPT ile kombine terapisinin uygulandığı hayvanlardaki tümör boyutlarının önemli derecede gerilediği bulunmuştur.
Anahtar sözcükler: Hepatosellüler karsinom, Kanser kök hücresi, Notch sinyal
To my parents Emine and Mehmet,
and my dear brother Kürşat...
Acknowledgements
Throughout this thesis, many people have been supportive both motivationally and intellectually and I would like to express my deepest appreciation to them.
First, I would like to thank one of my thesis supervisors, Prof. Dr. Mehmet Öztürk, since he never hesitated to share his immense scientific knowledge with me to improve my scientific insight. I have found the chance the work with him for the last two years, and I feel extremely lucky to work under his supervision and guidance, without his contribution I would not be able to carry my scientific vision to this degree.
I would like to thank to Prof. Dr. İhsan Gürsel, my second supervisor, as well. His motivation always led me to get motivated during my studies, and thanks to him, I have learned how to direct and develop alternative ideas when I need to get through the tough parts of a scientific project.
I am extremely thankful to both Dr. Öztürk and Dr. Gürsel for being not only scientific mentors but real life mentors, as well.
I would also like to thank to Merve Deniz, since she always helped me during this work, and I am grateful to Tamer and Gizem for their contribution in this study as well.
I am very grateful to Öztürk group members and my last group Gürsel group members, Kübra, Banu, Gizem, Tamer, Gözde, Begüm H., Fuat and Begüm, both groups had a family and scientific environment.
I would like to thank all MBG Faculty and Staff members, as well.
I would like to also thank to my close friends, Sıla Özdemir, Melek Cansu Petek, Dilek Çevik, Seda Koyuncu, Pelin Telkoparan, Şahika Cıngır, Mustafa Erol, thanks to their caring love I was able to complete this work in a family environment.
I am extremely grateful to my parents and my brother Kürşat, they have always supported me and believed in me during all my scientific and personal life. I would like to especially thank to Mehmet Ali Nergiz, he was supportive all the time and helped me to get up every time I stumble on.
Lastly, I would like to thank to the Scientific and Technological Research Council of Turkey (TÜBİTAK), for supporting me with BİDEB 2210-E during my Master studies.
Table of Contents
ABSTRACT ... ii
ÖZET ... iii
Acknowledgements ... vi
List of Figures ... xii
List of Tables ... xvi
Abbreviations ... xvii
1. Introduction ... 18
1.1 Hepatocellular carcinoma ... 18
1.1.1 Epidemiology of Hepatocellular Carcinoma ... 18
1.1.2 Etiologies and Risk Factors of Hepatocellular Carcinoma ... 19
1.1.2.1 Virus Induced Hepatocellular Carcinoma ... 19
1.1.2.3 Alcohol and Hepatocellular Carcinoma ... 20
1.1.2.4 Aflotoxin Exposure Induced Hepatocarcinogenesis ... 21
1.1.2.5 Additional Factors Inducing Hepatocarcinogenesis ... 21
1.1.3 Molecular Pathogenesis of Hepatocellular carcinoma ... 22
1.1.4 Genetics of Hepatocellular Carcinoma ... 24
1.2 Cancer stem cells (CSCs) ... 25
1.2.1 Biology of Cancer Stem Cells ... 25
1.2.2 Selected Markers of Cancer Stem Cells ... 26
1.2.3 Cancer Stem Cells and Hepatocellular Carcinoma ... 28
1.2.4 Signaling Pathways in CSCs and HCC ... 29
1.3 Notch signaling pathway ... 31
1.3.1 Notch signaling in CSCs and HCC ... 33
1.4 Involvement of Toll-like receptors in HCC ... 34
1.5 Cancer-immunotherapy ... 35
1.6 Aim of the Study ... 36
2. Materials and Methods ... 38
2.1. Materials ... 38
2.1.2. Tissue Culture Reagents and Materials ... 38
2.1.3. Polymerase Chain Reaction (PCR) ... 39
2.1.4. Primers ... 39
2.1.5. Agarose Gel Electrophoresis ... 40
2.1.6. Spectrophotometry ... 40
2.1.7. Determination of Gene Expression ... 40
2.1.7.1. Total RNA Isolation ... 40
2.1.7.2. First Strand cDNA Synthesis ... 40
2.1.8. Antibodies ... 40
2.1.9 Immunoperoxidase Assay Reagents ... 42
2.1.10 TLR Ligands ... 42
2.2. Solutions and Media ... 42
2.2.1. General solutions ... 42
2.2.2. Tissue culture solutions ... 43
2.2.3. Immunofluorescence Staining Solutions ... 43
2.2.4. Immunoperoxidase Staining Solutions ... 44
2.2.5. Sodium Deodecyl Sulphate (SDS)-Polyacrylamide Gel Electrophoresis (PAGE) and Immunoblotting Solutions ... 44
2.2.6. Preparation of DAPT and rhJagged-1 ... 45
2.3. Methods ... 45
2.3.1 Tissue Culture Methods ... 45
2.3.1.1Cell Lines and Growth Conditions of Cells ... 45
2.3.1.2Passaging Cells ... 46
2.3.1.3 Thawing and Cryopreservation of Cells ... 46
2.3.1.4Treatment of Cells ... 47
2.3.2 Agarose Gel Electrophoresis ... 47
2.3.3 Total RNA Extraction from Cultured Cells ... 48
2.3.4 First Strand cDNA Synthesis ... 49
2.3.5 PCR ... 49
2.3.6 Total Protein Extraction from Cultured Cells ... 50
2.3.7 Western Blotting ... 50
2.3.8 Immunoperoxidase Assay ... 52
2.3.9 Immunofluorescence Assay ... 53
2.3.11 Immunotherapy of Hepatocellular Carcinoma in Athymic mice Xenografts ... 54 2.3.12 Statistical Analysis ... 55 3. Results ... 56
3.1 Investigation of CD133 Positivity Levels in Hepatocellular Carcinoma Cell Lines as a Biomarker ... 56
3.1.1 Panel for Basal CD133 Abundance of Hepatocellular Carcinoma Cell Lines .. 56 3.1.2 Checking CD133 Positivity Panel Results by Flow Cytometry ... 58
3.2 Serum Starvation Model to Assess Cancer Stem Cell Sub-Populations in Hepatocellular Carcinoma Cell lines ... 61
3.2.1 Effects of Serum Starvation on CD133+/EpCAM+ Cancer Stem Cell
Population ... 62 3.2.2 Time-dependent alteration of CD133+/EpCAM+ Cancer Stem Cell Fraction in Serum Starvation ... 63
3.3 Notch Signaling Involvement in Regulation of Cancer Stem Cell Population in Hepatocellular Carcinoma ... 71
3.3.1 Altered Notch Signaling Affects CD133+ Cancer Stem Cell Fraction in Huh7 71 3.3.2 Dose-dependent Effects of Notch Alteration on CD133+/EpCAM+ Cancer Stem Cell Population... 73 3.3.3 Time-dependent Effects of Notch Alteration on CD133+/EpCAM+ Cancer Stem Cell Population... 76
3.4 Investigation of Oval Cell-like Population in Hepatocellular Carcinoma Cell Lines ... 79 3.5 Determination of Toll-like Receptor Activity in Hepatocellular Carcinoma ... 82
3.5.1 Basal Toll-like Receptor Expression in Hepatocellular Carcinoma Cell Lines ... 82 3.5.2 Effects of TLR ligand treatments on the expression levels of TLRs in HCC cell lines... 84
3.6 Strategies for effective Immunotherapy of Hepatocellular Carcinoma in Athymic mice Xenografts ... 86
4.1 Investigation of cancer stem cell subpopulation in hepatocellular
carcinoma cell lines. ... 89
4.2 Effects of Notch signaling pathway on CD133+/EpCAM+ subpopulation in selected HCC derived cell lines ... 91
4.3 TLR expression in HCC and cancer-immunotherapy by TLR ligands and Notch inhibition ... 93
5. References ... 96
6. Appendices ... 107
Appendix A ... 107
Appendix A1 Cancer stem cell studies on Hep3B ... 107
Appendix A2 TLR ligand treatment effects on TLR levels in Hep3B ... 110
Appendix B ... 111
List of Figures
Figure 1.1: Multistep pathogenesis of hepatocellular carcinoma. ... 23
Figure 1.2: CSC marker preference percentage by the scientific communities ... 27
Figure 1.3: CSC based tumor initiation model in HCC ... 29
Figure 1.4: Signaling pathways involved in hepatic cancer stem cells ... 31
Figure 1.5: Notch signaling pathway ... 32
Figure 1.6: Notch signaling crosstalk with other signaling pathways in carcinogenesis ... 34
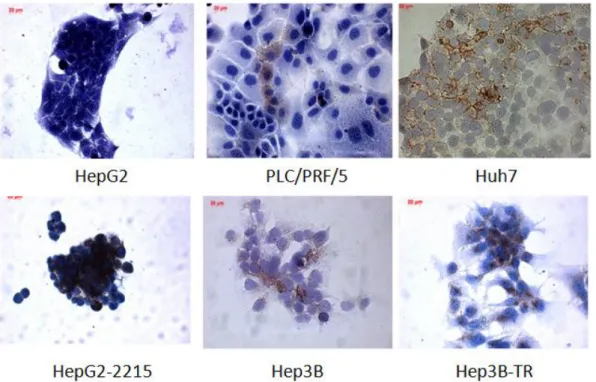
Figure 3.1: Eleven hepatocellular carcinoma cell lines that were detected to be negative for CD133 expression ... 57
Figure 3.2: Six HCC cell lines were detected to be positive for CD133 expression. 58 Figure 3.3: Representative dot plots of eleven HCC cell lines lacking CD133 expression. ... 59
Figure 3.4: Representative dot plots of HCC cell lines positive for CD133 expression.. ... 60
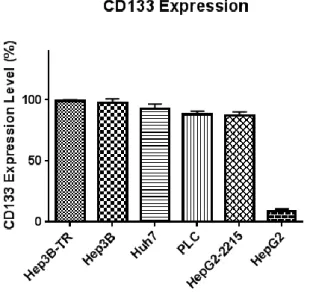
Figure 3.5: Graphical representation of the flow cytometry data showing the CD133 positivity levels of 6 HCC cell lines ... 61
Figure 3.6: Effects of serum starvation on CD133+/EpCAM+ subpopulation of CSCs in selected HCC cell lines ... 63
Figure 3.7: Dot plots showing the time-course change in CD133+/EpCAM+ subpopulation within three different HCC cell lines... 64
Figure 3.8: Flow cytometry analyses showing the daily changes occuring in CD133+/EpCAM+ subpopulation within serum deprived media for HepG2 ... 65
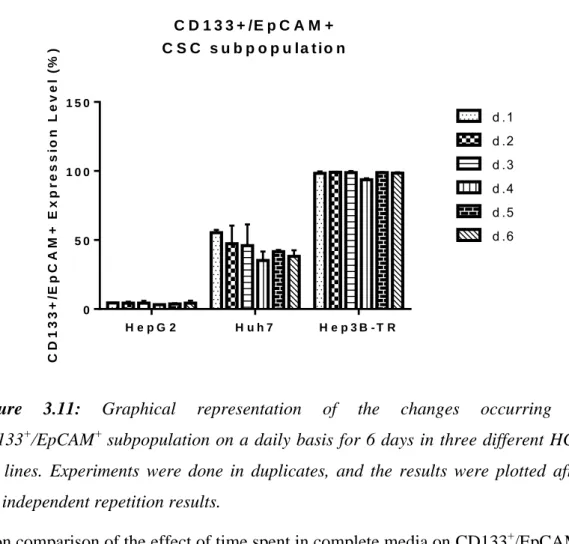
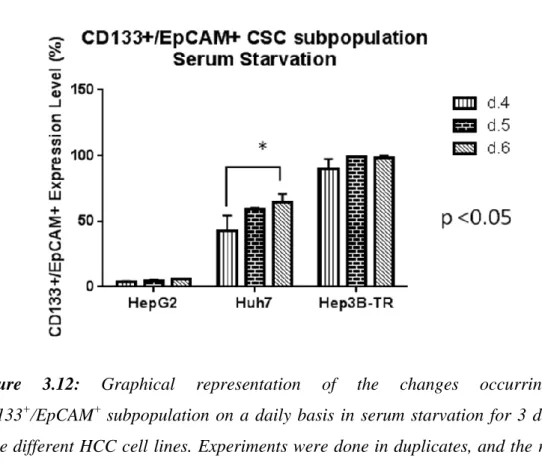
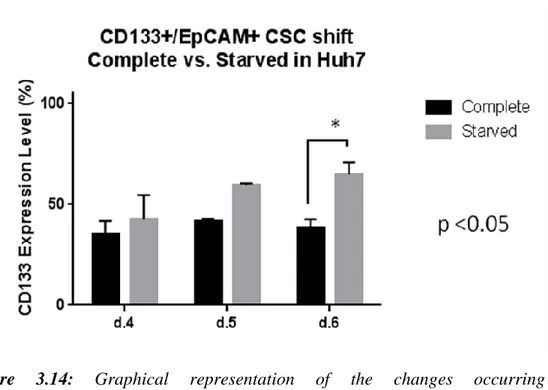
Figure 3.9: Flow cytometry analyses showing the daily changes occuring in CD133+/EpCAM+ subpopulation within serum deprived media for Huh7. ... 66 Figure 3.10: Flow cytometry analyses showing the daily changes occurring in CD133+/EpCAM+ subpopulation within serum deprived media for Hep3B-TR. ... 67 Figure 3.11: Graphical representation of the changes occurring in CD133+/EpCAM+ subpopulation on a daily basis for 6 days in three different HCC cell lines ... 68 Figure 3.12: Graphical representation of the changes occurring in CD133+/EpCAM+ subpopulation on a daily basis in serum starvation for 3 days in three different HCC cell lines ... 69 Figure 3.13: Graphical representation of the changes occurring in CD133+/EpCAM+ subpopulation in complete vs. serum-starved media for HepG2. 69 Figure 3.14: Graphical representation of the changes occurring in CD133+/EpCAM+ subpopulation in complete vs. serum starved media for Huh7. ... 70 Figure 3.15: Graphical representation of lack of the changes occurring in CD133+/EpCAM+ subpopulation in complete vs. serum starved media for Hep3B-TR.
... 70
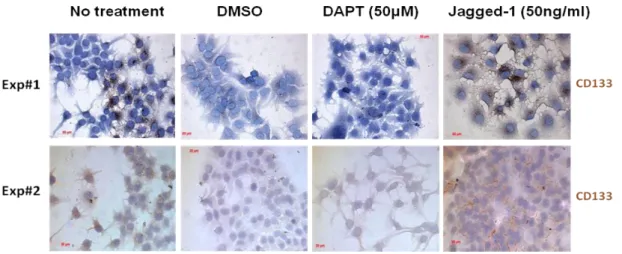
Figure 3.16: Immunoperoxidase assay results showing colony formation experiment with Notch agonists and antagonist to understand their effects CD133 positivity .... 72
Figure 3.17: Quantitative representation of the colonies having CD133 expression
higher than 20% within themselves upon Notch ligand and inhibitor treatment of Huh7 cells. ... 72 Figure 3.18: Dot-plot analyses showing the dose-dependent effects of Jagged-1 and DAPT on CD133+/EpCAM+ subpopulation shifts in HepG2 at day 6. ... 74 Figure 3.19: Flow cytometry analyses showing the dose-dependent effects of Jagged-1 and DAPT on CDJagged-133+/EpCAM+ subpopulation shifts in Huh7. ... 74 Figure 3.20: Flow cytometry analyses showing the dose-dependent effects of Jagged-1 and DAPT on CDJagged-133+/EpCAM+ subpopulation shifts in Hep3B-TR. ... 75
Figure 3.21: Graphical representation showing the effects of Jagged-1 and DAPT on CD133+/EpCAM+ subpopulation shifts in HepG2, Huh7 and Hep3B-TR.. ... 76 Figure 3.22: Flow cytometry analyses showing the time dependent changes of CD133+/EpCAM+ fraction upon DAPT and Jagged-1 treatments in HepG2. ... 77 Figure 3.23: Flow cytometry analyses showing the time dependent changes of CD133+/EpCAM+ fraction upon DAPT and Jagged-1 treatments in Huh7. ... 77 Figure 3.24: Flow cytometry analyses showing the time dependent changes of CD133+/EpCAM+ fraction upon DAPT and Jagged-1 treatments in Hep3B-TR. ... 78 Figure 3.25: Effects of DAPT on CD133+/EpCAM+ population in a time-dependent manner. ... 78 Figure 3.26: Western blot analysis images showing the heterogeneous expression of HNF4α+ and Sox9+ oval cell markers in HCC cell lines. ... 80 Figure 3.27: Immunofluorescence images showing presence of co-expression of HNF4α and SOX9 in HepG2 and HepG2-2215 cell lines ... 81 Figure 3.28: Immunofluorescence images showing presence of co-expression of HNF4α and SOX9 in Hep3B and Hep3B-TR cell lines. ... 81 Figure 3.29: Immunofluorescence images showing presence of co-expression of HNF4α and SOX9 in Huh7 and PLC cell lines ... 81 Figure 3.30: Immunofluorescence images showing absence of co-expression of HNF4α and SOX9 in FLC4. ... 82 Figure 3.31: Gel image showing PCR product bands for basal TLR levels in 6 HCC cell lines ... 83 Figure 3.32: Gel image showing PCR product bands of TLR levels in HepG2 upon under treatment of different TLR ligands. ... 84 Figure 3.33: Gel image showing PCR product bands of TLR levels in Huh7 upon treatment with different TLR ligands ... 85 Figure 3.34: Gel image showing PCR product bands of TLR levels in Hep3B-TR upon treatment with different TLR ligands ... 86
Figure 3.35: HCC bearing mice (N=4) tumor burden plots ... 87 Figure 3.36: Photomicrographs showing tumors of different mice at day 9 post therapy... 88 Figure 3.37: Time course tumor growth kinetics of untreated and immunotherapy applied test groups. ... 88 Figure A1: Flow cytometry analysis showing the CD133/EpCAM double positive population changes upon serum starvation. ... 107 Figure A2: Flow cytometry analysis showing the CD133/EpCAM double positive population changes on a daily basis in complete media. ... 108 Figure A3: Flow cytometry analysis showing the CD133/EpCAM double positive population changes on a daily basis in complete media vs. serum starved media. . 109 Figure A4: Flow cytometry analysis showing the CD133/EpCAM double positive population changes upon Notch signaling alteration. ... 109 Figure A5: Gel image showing PCR product bands of TLR levels in Hep3B upon treatment with different TLR ligand ... 110
List of Tables
Table 1.1: Commonly used cancer stem cell markers for hepatocellular carcinoma. 27 Table 2.1.: Primers pairs involved in this study are enlisted as depicted below. ... 39 Table 2.2: Listed version of the antibodies used in this study ... 40 Table 2.3: Reagents used in PCR preparation. ... 49
Abbreviations
HBV Hepatitis-B virus HCV Hepatitis-C virus HCC Hepatocellular carcinoma TLR Toll-like receptor CSC Cancer-stem cellROS Reactive oxygen species
NAFLD Non-alcoholic fatty liver disorder
NK Natural killer
FCS Fetal calf serum
LPS Lipopolysaccharide
IFN Interferon
PGN Peptidoglycan
LTA Lipoteichoic acid
Chapter 1
1.
Introduction
1.1 Hepatocellular carcinoma
1.1.1 Epidemiology of Hepatocellular Carcinoma
Liver cancer has a 4.6% survival rate, which renders it to be the second most lethal cancer type worldwide in both sexes after pancreas cancer 1. The severity of liver cancer stems from several aspects including the shortage of the markers used for pinpointing cancerous cells and highly resistant nature against radio and chemotherapy.
There are various subtypes of liver cancer encompassing intrahepatic bile duct carcinoma, hepatoblastoma, bile duct cystadenocarcinoma, haemangiosarcoma and last but with being the most common type of primary liver cancer type by consisting around the 85% of all cases, hepatocellular carcinoma(HCC) 2.
HCC, per se enters the list of most common cancer types as seventh, and is the third upon evaluation of primary cancer related deaths worldwide (in both sexes) 3.
Although primary liver cancers including HCC show a differential variability worldwide, China makes up for the 55% of all primary liver cancer types due to its enormous population and very high age-standardized incidence rates. China is followed by the sub-Saharan countries Cameroon and Mozambique 4. Mediterranean countries including Italy and Greece show intermediate incidence ratios with 20 per 100.000 people (2%) 5. In Turkey, HBV incidence rate is 5-10% and HCV carrier rate is 1.5%. HCC incidence rate on the other hand is 1.9% in men, but 1.1% in women 6.
1.1.2 Etiologies and Risk Factors of Hepatocellular Carcinoma
HCC establishment comprises a lengthy, complicated, multi-step condition and exposure to numerous factors has a significant contribution in progression of HCC. These risk factors include but not limited to viral causes, in case of Hepatitis B or C infections (HBV and HCV hereafter), excessive alcohol consumption, frequent exposure to toxic substances like Aflatoxin B1 diabetes and chronic liver inflammation. The effects of risk factors are expectedly variable, while HBV is the leading cause of HCC in Africa, both HBV and HCV accounts for the prime risk factors in Asia, although HCV is the most risky factor in the US 7. Through triggering a set of mechanisms generally starting with inflammation due to damage to resident hepatocytes, combined effects of these risk factors finally result in chronic liver disease and fibrosis8. Additional factors including alcohol consumption, diabetes, exposure to toxic compounds such as aflatoxins or pesticides, reactive oxygen species (ROS) production, all has contribution in the progression of HCC and counted as significant risk factors 9,10.
1.1.2.1 Virus Induced Hepatocellular Carcinoma
Viral hepato-carcinogenesis is mostly attributable to two distinct viral infections, one of which is HBV infection and the second one is HCV infection. Each year around 320.000 people die because of HBV related diseases, and HCC constitutes the 40-50% of HBV related deaths 8. Some of these infections might be acquired from child-birth but among the ones that get the disease during adulthood, 30% develops
chronic liver disease, which is followed by fibrosis, cirrhosis leading to hepatocellular carcinoma at a later stage 7. More than 60% of HCC cases are caused by HCV and around 20% by HBV in the US, Egypt and Europe. In Asia and Africa, the reciprocal scenario applies, however, 60% of all HCC cases is related to HBV and 20% is related with HCV infections. There are multiple factors, though, determining the rate for fibrotic progression, and there seems to be a variability among patients to enter fibrosis, yet the mean progression time is within one or two decades 11.
HCV is a positive-sense single stranded RNA virus, the virus genome itself possess an open reading frame that encodes a polyprotein. The genes that form the structural parts are encoded from the regions close by to 5’, the rest of the genes are encoded nearby 3’ region 12
. HBV, on the contrary, possess a partially double stranded and circular DNA genome, which will eventually give rise to 4 totally different proteins that are Surface, Precore, X protein and DNA polymerase 13.
With the further contribution of excessive alcohol consumption, or additional infections such as HIV, the disease progression in HCV and HBV related cases becomes prevalent to acceleration.
1.1.2.3 Alcohol and Hepatocellular Carcinoma
Alcohol abuse is pointed as being one of the primary or else cofactor causing HCC. This variability is dependent on the circumstances that a patient bears with, in the first case scenario intensive consumption of alcohol may directly trigger HCC or through alcohol-induced cirrhosis. In the latter case, this being the cofactor, alcohol may act this time as an interplay for a patient, who was diagnosed with HBV or HCV
14
. The significant matter at this stage is to determine the amount of alcohol that falls between the danger limit and this range is 60-80g of alcohol on a daily basis 15. With this definition, statistical data verified that around 7% of the people in US are within the alcohol abuse limits 16. In a study with 464 Italian patients, it was shown that people consuming 40-80g of alcohol on a daily basis had a possibility of progressing into HCC with an odds ratio of 1.5 compared to the ones, whose alcohol intake is
0-40g. More catastrophically, this ratio climbs up to 7.3 fold when the alcohol intake passes over 80g per day 17. There are various mechanisms relating alcohol to HCC, some of which can be listed as the genototoxic effects 18, non-genototoxic effects, such as the activity of metabolized intermediate forms of alcohol on liver 19, alcohol leading to methylation abnormalities 20, and finally immune surveillance prevention effect of alcohol in tumors 21. Some of the mechanisms will be covered in the following sections.
1.1.2.4 Aflotoxin Exposure Induced Hepatocarcinogenesis
Aflatoxins (Aspergillus flavus toxins) are in essence the metabolites of Aspergillus
parasiticus and A. flavus. Upon infection of plants, which could be crops, these
mycotoxins are also produced within the crops upon preservation in moisture areas
22
. Since coming with an edible food, these toxins potentially exert cumulative effects on people, who are frequently consuming them, these effects include hepatotoxicity and immunotoxicity. Aflatoxin B1 is the most abundant and extremely toxic type of aflatoxins 23. Aflatoxin B1-rich areas in Africa seem to be the ones with high rates of HCC. Moreover, research suggests that with an additional HBV infection Aflatoxin exposure increases the possibility of progression into HCC 24–26. Therefore the research has suggested that, in majority of the regions that has a mutation in p53 gene coincides with the region that possess the highest Aflatoxin B1 exposure and further data shows Aflatoxin B1 is the responsible factor 27,28.
1.1.2.5 Additional Factors Inducing Hepatocarcinogenesis
Along with all the risk factors listed and discussed in previous sections, there are additional factors with a lower frequency triggering a step forward hepatocellular carcinoma.
To begin with a high-incidence factor, diabetes is an important factor for HCC development, it may work as an independent factor, and data suggest that HCC development was seen in HCC patients with no other liver disease related factors 16. Such a tendency may stem from the accumulation of free-fatty acids in the liver following insulin resistance in diabetic patients. Build-up of tremendous amount of
lipid in the liver starts up a cascade of events leading to hepatocellular injury, oxidative stress through radical production by excess lipid metabolism, all of which may eventually end up with fibrosis 2,29.
Non-alcoholic liver disorders such as Non-alcoholic fatty liver disorder (NAFLD) or non-alcoholic steatohepatitis are also risk factors that by inducing liver damage they lead to fibrosis and cirrhosis, which will progressively fire HCC. 30.
HCC can be connected with metabolic disorders, as well, and one of these disorders is hereditary haemochromatosis. This disorder is originated from excess iron absorption of liver cells that will cause hepatocellular damage in return 31. Moreover, porphyria cutanea tarda, which is again associated with extreme iron absorption leads to fibrosis and cirrhosis 32.
1.1.3 Molecular Pathogenesis of Hepatocellular carcinoma
Hepatocellular carcinogenesis can be triggered through different risk factors as mentioned in previous sections, and these primary factors are known to be HCV and HBV infections, alcohol abuse, exposure to toxic factors like Aflatoxin B1 and metabolic abnormalities such as diabetes.
Either cumulative or individual effects of these risk factors on liver cause damage to hepatocytes which will induce necrosis, following excessive cell death, an increase in proliferation of hepatocytes is observed.
This cycle of necrosis-proliferation is known to be progressing in to Chronic liver disease 2. Continuum of such intensive scarring foster a cirrhosis condition which is characterized by nodule formation covered by collagen fibers, during that process hepatocytes go under proliferative arrest due to telomere shortening 33 (Figure 1.1)
Figure 1.1: Multistep pathogenesis of hepatocellular carcinoma (adapted from
Farazi & DePinho, 2006 2).
With the presence of HBV or HCV, liver enters into a state of inflammation, although HCV is cytopathic to the hepatocytes, HBV seems to be non-cytopathic to the cells in cell culture 34,35. This viral-persistency creates an inflammatory environment that renders chronic liver disease continuous with no viral clearance, and even presence of virus-specific lymphocytes and natural-killer cells (NK cells) are detected at the inflammation sites, activity of those still is not effective enough to clear the virus 36. HBV and HCV coded proteins affect and change the host gene expression, even HBV genome integrates itself into the host genome through which it can cause the activation of oncogenes or telomerase activation 37. Moreover, the oxidative stress and environment created by immune activity is made use of by these viruses to activate different signaling pathway to escape apoptosis, cellular senescence, and sustain viral-persistence 38.
Following cirrhosis, continuously regenerating hepatocytes turn into hyperplastic nodules. The nodules are formed by rather normal cells, yet piled-up genetic mutations further develops these hyperplastic nodules into pre-malignant dysplactic nodules. With the increased mutations in TP53, MET or E-cadherin genes, these dysplatic nodules may progress into hepatocellular carcinoma 2.
1.1.4 Genetics of Hepatocellular Carcinoma
Genetic aberrations, although not being completely universal, are very critical components that regulate the progression into HCC. Having been discussed, the blueprint of HCC formation with rounds of necrosis, inflammation and regeneration render the cells to make mistakes during cell division and cell metabolism, as results of these defects, tumor suppressor genes may become inactivated and oncogenes may get activated 39.
With developing sequencing techniques like exome-sequencing, next-generation sequencing and parallel sequencing, previously unknown genetic mutations, gene fusions or intra-chromosomal rearrangements are much easier to follow up with. Since HCC tumors show a heterogeneity in their genomic sequences, a rather targeted therapy should be a possible way to interfere with this mechanism 40. Accumulating data collected from genomics and transcriptomics studies present intermingled subgroups of HCC in terms of genetic mutation tendency. One of the highly-mutated pathway seems to be Wnt-signaling pathway elements including CTNN1, AXIN1 and AXIN2 with around 50% mutation rate in collected samples, whereas TP53 turns out to be a frequently mutating tumor suppressor gene with mutations in 20% of tumors 41. Just as loss of functions mutations, there are also gain-of-function mutations, two of which take place at Chromosome 1p and 8q, which leads to the activation of oncogenic genes MYC, SHC1 and MLC1, respectively.
A different study suggests the alteration of genes involved in SWI/SNF complex and the genes that are members of interferon and oxidative stress pathways 42. Furthermore, integrated expression profiling analyses revealed the effects of HBV integration into the genome in HCC. First of these is that HBV integrates itself in the promoter region of TERT gene, FAR2, IRAK2, MAPK1, MLL2 and MLL4 43 . Moreover, HBV integration breakpoints are found to be showing a tendency towards copy-number-variations, which implies a role for HBV integration in genomic instability of HCC 44.
1.2 Cancer stem cells (CSCs)
Tumors are embodied from elaborately combined but differentially functioning subpopulations of cells. Some of the members of the subpopulations are rapidly dividing cells, differentiated cells or the ones that are post-mitotic. Within such diversity, a group of cells has been drawing the utmost attention, these are known as cancer stem cells (CSCs hereafter). According to the concept of cancer stem cells, these cells shelter some of the characteristics of tissue resident stem cells, which possess the self-renewal ability and potential to differentiate into more determined cell types, which will be investigated in detail in the following sections 45.
1.2.1 Biology of Cancer Stem Cells
Presence of heterogeneity in tumors was long known, yet with the revisiting of this heterogeneity in leukemia fired back the attention on these cells. Engraftment studies on acute myeloid leukemia (AML) have shown that grafts could be established only in the presence of CD34+CD38- cells, even more fascinating result was the determination of the responsible fraction which was calculated to be one in a million of tumor cells 46. Application and translation into the solid tumor has come a bit later with the study in solid breast cancer tumors. This work has enlightened the case for bulk tumors, and a few CD44+CD24-/low cells were sufficient to form tumors in transplanted xenografts, although thousands of other types were not able to drive the same effect 47. There are two commonly proposed theories on CSCs, one is `stochastic model` and the other one is `hierarchy model`. In stochastic model, all the cells in a tumors are assumed to be "biologically equivalent", meaning they all hold the same potential to form a tumor and only differentiate in the on-time transcriptional factor levels, epigenetic regulations active within the present time and this state is not temporary, giving rise to an unpredictable state of cells in a tumor. Whereas the hierarchy model suggest that a tumor mass has certain stem cells of its own which will both give rise to its own clones, along with it a fraction will differentiate into less-potent cell types 48.
The most prominent and suggested aspect of CSCs is their resistance against multiple therapeutic approaches, including radiotherapy and chemotherapy and studies show
their resistance is owed to having ABC drug pump expression, anti-apoptotic protein expression and resistance to DNA damage 49. As expected it should be noted that this state of resistance to chemo and/or radiotherapy is not universal for all cancer types
50
.
Another suspect against CSCs is on their responsibility for tumor relapse upon surgical removal, or assumed clearance after chemo-or-radiotherapy. Even recurrences at different locations were detected, which opens the next characteristic; their role in metastasis. In pancreatic tumors, a subpopulation of CSCs, which were identified by the markers CD133+CXCR4+ , were shown to be responsible for the type of tumors, it was the same study, which offered that upon ablation of CD133+CXCR4+ subpopulation metastasis ability in the cell lines were halted, although tumorigenesis was maintained 51.
1.2.2 Selected Markers of Cancer Stem Cells
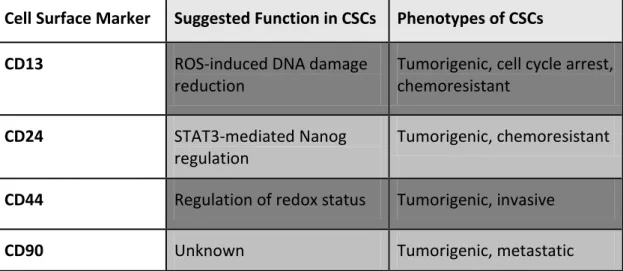
Marker selection in determination of CSCs is one of the essential steps in pursuit of their presence and metabolism. Along with having various markers, marker definition is still a controversy between scientific communities. The markers for CSCs, in its essence, are also the markers used in the detection of tissue resident adult stem cells. CD34 and CD38, as examples, are very well-established hematopoietic stem cell markers, and are the most trusted markers of leukemia 46. CD133 (Prominin-1) is a widely accepted CSC marker found in the stem cells of different tissues and organs, such as colon and brain 52. Figure 1.3. summarizes the percentage of potential CSCs and Table 1.1 describe function and phenotypes of commonly used cancer stem cell markers for hepatocellular carcinoma.
Figure 1.2: CSC marker preference percentage by the scientific communities (adapted
from Razvi, 2014 53).
Among these markers, CD133 and EpCAM are the most frequently preferred and the most trusted markers for HCC 54–58. CD133, within its origin, is a pentaspan membrane protein and is the first member to be identified in the prominin family of proteins, which specifically gives the name for it, Prominin-1 59. Although its exact association with a certain pathway is not established yet, expression in specific type of cells was observed, as an instance, CD133 expression was considered to be the co-expressed marker for CD34+ hematopoietic stem cells 60.
Table 1.1: Commonly used cancer stem cell markers for hepatocellular carcinoma54.
Cell Surface Marker Suggested Function in CSCs Phenotypes of CSCs
CD13 ROS-induced DNA damage
reduction
Tumorigenic, cell cycle arrest, chemoresistant
CD24 STAT3-mediated Nanog
regulation
Tumorigenic, chemoresistant
CD44 Regulation of redox status Tumorigenic, invasive
CD133 Neurotensin/IL-8/CXCL1 signaling
Tumorigenic, chemoresistant
DLK1 Unknown Tumorigenic, chemoresistant
EpCAM Activation of Wnt signaling Tumorigenic, invasive,
chemoresistant
OV6 Unknown Tumorigenic, invasive,
chemoresistant,
There has been several studies indicating involvement of CD133 expression in CSCs, in one of which CD133+/CD34+ cells has shown to be responsible for a rather improved clonogenic capacity when engrafted 61 .
An alternative study suggested that CD133+/CD44+ double positive cells were more resistant to chemotherapy due to increased ABC super family transporters in HCC 55. EpCAM (CD326), an epithelial cell adhesion molecule, is initially identified as a liver stem/progenitor cell marker, found in oval cells 62. EpCAM association with CSCs is described with numerous studies, one of which states the concentrated presence of EpCAM+/AFP+ cell population at the tumor invasion border in HCC, and HCCs with such phenotype exhibit poorer survival. Moreover, EpCAM is shown to be a target for Wnt signaling pathway, and the study has shown that activation of beta-catenin has increased the spheroids formed in soft agar in HCC cell lines 63. 1.2.3 Cancer Stem Cells and Hepatocellular Carcinoma
As seen in other cancer types, CSC markers were also detected in HCC samples and cell lines (Table 1.1). Cancer-stem-cells of the liver and/or HCC may expresses markers in different combinations depending of the cell lines or the sample. Yet, the most common feature of this population is to have the ability to form engrafted tumors upon injection in mice 64. One of the clearest ways to point out the existence of CSC in HCC is through markers
Normally, hepatoblasts, the progenitor cells of hepatocytes and cholangiocytes, express cytokeratin-19 (CK19), EpCAM and AFP 65. CSCs and liver stem cells also share a set of markers, for instance although EpCAM and CD133 are normal liver
stem cell markers, their double positivity in HCC correlates with the differentiation ability of the cells, colony formation ability and resistance to chemo-therapy 56. Another study has shown the increase in tumorigenicity in vivo upon transplantation of CD133+/ALDH+ cells compared to their CD133-/ALDH+ or CD133-/ALDH- counterparts 58. Several models were proposed to describe tumor initiation model for HCC. Following scheme encompasses these models (Figure 1.4)
Figure 1.3: CSC based tumor initiation model in HCC (adapted from Ji & Wang
201366)
1.2.4 Signaling Pathways in CSCs and HCC
Multiple efforts were consumed on defining the signaling pathways that differentially regulated during CSC reprogramming. The need for plenty of additional studies to separate mingled pathways is inevitable, yet existence of a complex cross-talk of pathways was observed in the process of CSC formation 67. Numerous signaling pathways involving i)Wnt, ii)Notch, iii)AKT, iv)transforming growth factor beta (TGF-beta) and v)STAT3, were shown to be altered compared to their natural states. Such a diverse variety may be linked to the alternative origins of CSCs 66.
Wnt/β-catenin pathway has significant roles during development, stem cell maintenance and its involvement in CSC metabolism, and currently under the lights
of new findings, it is gaining more and more importance. There are studies showing the activity of Wnt/β-catenin signaling in hepatic CSCs maintenance 54
. What's more, is activation of Wnt signaling was detected to be increasing EpCAM+CSC levels in HCC 68,69.
Altered TGF-β signaling through activation of IL-6/STAT3 system in hepatic progenitor cells lead to misguided differentiation and progress into HCC 70. In terms of CSC population, TGF-β pathway was indicated to control CD133+ cell population in HCC, additionally, chemo-resistant character of EpCAM+ CSCs was affected by IL-6/STAT3 activity 71,72.
AKT signaling activation was found to be attributing to the chemo-resistant nature of CSCs. Hypoxia-inducible factor1-α (HIF1α) production was observed under hypoxia conditions by the activity of Akt signaling, which later forms a positive feedback mechanism. Following HIF1α expression, platelet-derived growth factor (PDGF) and vascular endothelial growth factor (VEGF) upregulation, both of which are known to be effective in chemo-resistance, in addition, Akt signaling trigger a set of mechanisms which eventually lead to increased expression of ABCG2 (a drug efflux transporter) 71,73. Interaction between AKT, TGFB, IL6/STAT3 and WNT/B-Catenin axis is summarized in Figure 1.5. Combined intricate actions of these pathways leads to i) self-renewal, ii) differentiation, iii) tumorigenicity, iv) chemo-resistance thereby culminating into increased v) cell survival.
Figure 1.4: Signaling pathways involved in hepatic cancer stem cells (adapted from
Ji & Wang 2013 66).
1.3 Notch signaling pathway
Knowledge on Notch signaling pathway lay down its roots back in 1900s. Although having been worked on almost a century now, there is plenty of questions yet to be answered on involvement of Notch signaling in multiple biological events. Notch gene was discovered, originally, in fruit fly, Drosophila melanogaster, in a mutated form it leads to a nicked wing margin phenotype, and inherited as a sex-linked mutation 74,75. Notch receptor family involves 4 members (Notch1-4) in mammalians, all of which are produced in precursor form and cleaved through furin-like convertase, also known as, S1 cleavage, to become mature receptor 76. Mature form of the receptor is a combination of its two subunits, one is facing the extracellular domain (ECD), and the other has a trans-membrane, as well as an intracellular domain (ICD, later will be referred as Notch ICD (NICD)). ECD possess several repetitive regions including epidermal growth factor (EGF) -like repeats and LIN2 and Notch repeats (LNRs), enables signaling only in the presence of the ligand, NICD has PEST domain and is the activated form 77, (Figure 1.6).
Figure 1.5: Notch signaling pathway (adapted from Guruharsha et al., 2012 78)
A specific feature of Notch signaling is its activation only in the presence of a physical cell-to-cell contact through the ligands of the neighboring cell. These ligands are known as DSL (Delta-Serrate-LAG2) proteins and the members of DSL family of proteins in mammalian cells are jagged-1(JAG1), jagged-2(JAG2), Delta-like-1(DLL1), DLL2 and DLL3 76. Binding of the receptor to the ligand ends up with a conformational twist, which makes the ECD susceptible to metalloproteinase tumor necrosis factor alpha converting enzyme (TACE or ADAM17) and results in S2 cleavage. This cleavage triggers the next cleavage and subsequent release of NICD into the cytoplasm. S3 cleavage is mediated by presenilin-γ-secretase complex sheltering nicastrin (NCSTN), presenilin 1 and 2 (PSEN1, PSEN2), anterior pharynx defective 1 (APH1) and presenilin enhancer 2 (PEN2) 77,78.
Following S3 cleavage NICD translocates to nucleus and form a complex with CBF1-Su(H)-LAG1 (CSL) and replaces its repressor activity into a transcriptional activator by recruiting Mastermind-like 1 (MAML1). This activation leads to sequential events leading to expression of cyclin D1, Notch ligands and receptors and many more 79. In case of a turnover of the Notch receptor, it is phosphorylated at its PEST domain by ubiquitin E3 ligases such as SEL10 (FBXW7) to be directed to proteasomal degradation 80.
Notch signaling has pivotal roles during development, such as; i) cell-fate determination, ii) proliferation and iii) apoptosis, studies has shown the context dependent nature of Notch signaling 77. Along with controlling stem cell maintenance, it directs neurogenesis by contact-inhibition, additionally has a crucial role during angiogenesis 81,82. Involvement of Notch signaling in CSC reprogramming and HCC is also an essential part and will be touched upon in the following sections.
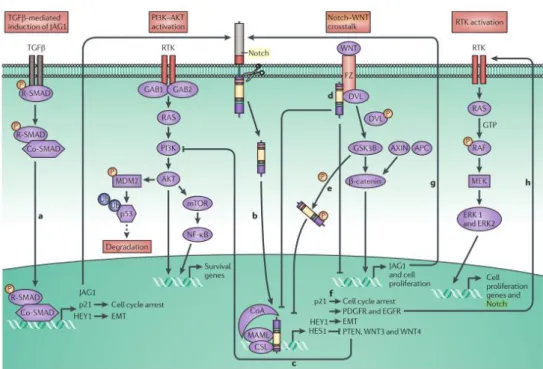
1.3.1 Notch signaling in CSCs and HCC
Integrative role of Notch signaling in the maintenance of the stemness state of the stem cells has been known from earlier studies (Figure 1.7). One of such kind of regulation is seen in neural cells, in control of HIF1-alpha Notch acts as a guard for the precursor form of the neural stem cells, keeping them at an undifferentiated state, in case of Notch loss medullablastoma tendency was observed 79. Expectedly, upon halting of Notch signaling in these cells, precursor cells were observed to be differentiating, supporting the action of Notch in the maintenance of stemness 80. An alternative study has shown the role for the stem cell programming ability of Notch in which activation of Notch signaling by various ligands exerted its effects as an increase in mammary stem cells and a ten-fold boost mammosphere formation 81. These different illustrations of Notch activity in potential CSC like ability formation strengthens the view of involvement of Notch signaling in cancer stem cell reprogramming. There are some studies showing the aberration or in some cases inhibition of Notch signaling in HCC and other cancer types but not much is still known to discover the role of Notch in HCC 82.
Figure 1.6: Notch signaling crosstalk with other signaling pathways in
carcinogenesis (adapted from Ranganathan et al., 2011 83).
1.4 Involvement of Toll-like receptors in HCC
In consideration of humans, there are known ten types of toll-like receptors(TLR), which are known to be involved in the identification of pathogen associated molecular patterns (PAMPs), and this renders them to possess the name pathogen recognition receptors (PRRs) 84. TLRs can be simply categorized into two, one is formed by the cell-membrane located receptors that recognize modified lipids or protein based ligands (TLR1,2,4,5,6,10,11 and 12), and the second type is located at the endosomal compartments (TLR3, 7/8 and 9) and recognize mostly foreign nucleic acids 85. TLRs contain three major domains one is required for ligand binding another is for single membrane-passing and the third domain is cytosolic Toll/IL-1R (TIR) domain. Signal transfer occurs through two main downstream ways, first is called a Myddosome, which involves an adaptor protein dimerization with the receptor and is called myeloid differentiation primary response protein 88 (MyD88) that activates nuclear factor-kappa B(NF-κB). Another complex is Triffosome that involves interferon(IFN)-regulatory factors(IRFs) which bind to TIR domain containing adaptor protein inducing IFN-beta (TRIF) 85. Each TLR is induced by a
different agent, TLR2 heterodimerizes with TLR1 and TLR6 and recognizes triacyl or diacyllipoproteins 86,87. TLR5 homodimerize upon bacterial flagellin presence 88 and TLR4 is activated by lipopolysaccharide (LPS) 89. TLR7 TLR8 and TLR9 are located on endosomes, and although TLR7 and TLR8 are activated by single-stranded RNAs (ssRNAs), TLR9 responds to unmethylated CpG oligonucleotides and finally TLR3 respond to double-stranded RNA 90–93. Although there are not many studies involving TLRs and hepatocellular carcinoma, some studies suggest that TLR4 induction, for instance, in HCV bearing mice, upon alcohol exposure led to HCC, in which the stemness have found to be increased when CD133 levels were investigated 54. A very recent study shows the potential involvement of TLR7 and TLR9 on their ability of HCC tumor formation in mice 94. Yet, the effects of TLRs on cancer microenvironment in HCC or tumor therapy is yet to be investigated.
1.5 Cancer-immunotherapy
Molecular and individual identity of a tumor is unique, and through making use of this concept immuno-therapies are trying to be developed against multiple cancer types. These so-called "cancer vaccines" are aimed to direct the fighters of the immune system to prevent tumors from expanding and growing. There are several advantages of the usage of cancer vaccines, accumulating knowledge on viral based vaccines showed the world how immune system works to treat the malignancies within itself, and this strategy supplied a blueprint for the immunization for cancer antigens 95. There are challenges, of course, within this strategy, antigen promoting must be achieved by dendritic cells, immune suppression by the tumor microenvironment must be overcome with, and protective T cell responses should be activated 96 along with NK cell activity in cases missing self is an issue.
TLR agonist usage in cancer immunotherapy is recently becoming a preferred topic. TLR agonists lead to immunostimulatory effects, which could be activation of co-stimulatory molecules (CD86, CD40 and CD80) that are located on dendritic cells (DCs). Moreover, they induce the inflammatory cytokine (TNFα and IL-12) secretion and polarize T cells to assume Th1 fate 97. By using these immunostimulatory effects of vaccines can be developed with the addition of desired
cocktails to treat the tumor masses. This technique is called "Combination immunotherapy" and it makes use of gathering different agents such a signaling pathway inhibitors, immunostimulatory molecules, or cell based therapies together. By making use of the immunostimulatory potential of small molecules in combination with TLR ligands, a better approach to overcome the immunosuppressive environment existing at the tumor niche could be made possible
98
.
1.6 Aim of the Study
Cancer stem cells are shown to be present in solid tumors of various cancer types 99. Although forming only a small subpopulation in a tumor, cancer stem cells are known to be responsible for chemo-and-radio-therapy resistant disposition of cancer, along with being in charge of the recurrences upon surgical removal of a tumor mass
100
. Existence of CSCs in HCC is also known, which can be explanatory for the chemotherapy and radiotherapy resistant nature of HCC tumors 66.
Notch signaling aberrations are detected to be present in HCC. Involvement of Notch signaling in stem cell regulation, mostly in favor of the maintenance of stemness during embryogenesis and also abnormal deregulation of Notch activity in CSCs of several cancer types, directed us to interrogate the activity of Notch signaling in HCC cancer stem cells 78.
Importance of TLRs in the therapy of solid tumors are gaining more attention with the piled up evidence of recent studies 97. Immunostimulatory effects of TLR ligands will be analyzed to eradicate large tumor mass. In this study, expression levels of TLRs in HCC cell lines were investigated to decide on the potential applicability of TLR ligand therapy in vivo by checking the effects of TLR ligands on expression levels of TLRs in cell lines.
Upon completion of this work, existence of the CSCs in certain HCC cell lines and the role of Notch signaling on cancer stem cell population will be characterized in order to propose a solution to treat HCC. The ultimate goal in this study was to establish a cancer immunotherapy method, depending on the in vitro data acquired from Notch experiments on cancer stem cells and the data showing the possible
candidate TLRs to be upregulated in cell lines upon stimulation, to achieve tumor shrinkage or even eradication.
Chapter 2
2.
Materials and Methods
2.1. Materials
2.1.1. General Laboratory Reagents
The reagents highly used in the experiments including Ethanol, Bradford reagent and methanol, haematoxylin were analytical grade and were purchased from Merck (Darmstadt, Germany) or Sigma-Aldrich (St. Louis, MO, USA). ECL Prime western blotting detection kit and Hybond nitrocellulose western blot membranes were purchased from Amersham Pharmacia Biotech Company. DMSO and Ponceau S were bought from Applied Biochemia (Darmstadt, Germany). Fixative Medium A was purchased from Invitrogen (GAS003, Carlsbad, CA, USA).
2.1.2. Tissue Culture Reagents and Materials
Media used in cell culture including Dulbecco’s modified Eagle’s medium (DMEM) and Roswell Park Memorial Institute (RPMI) 1640 medium and OptiMEM were purchased from GIBCO (Invitrogen, Carlsbad, CA, USA). Supplemental reagents such as Penicillin/streptomycin antibiotics, L-glutamine, Non essential amino acids (NEAA), fetal calf serum (FCS) and Trypsin-EDTA were also purchased from GIBCO. All of the plastic materials used in cell culture like flasks, Petri dishes, multi-well-plates, cryotubes were purchased from Corning Life Sciences Inc. (USA). All sterile serological pipettes were purchased from Costar Corporation (Cambridge, UK).
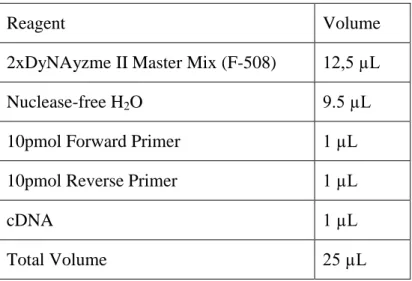
2.1.3. Polymerase Chain Reaction (PCR)
OneTaqMM Quick-Load 2XMM w/Std buffer was used as a ready-to-load master mix.
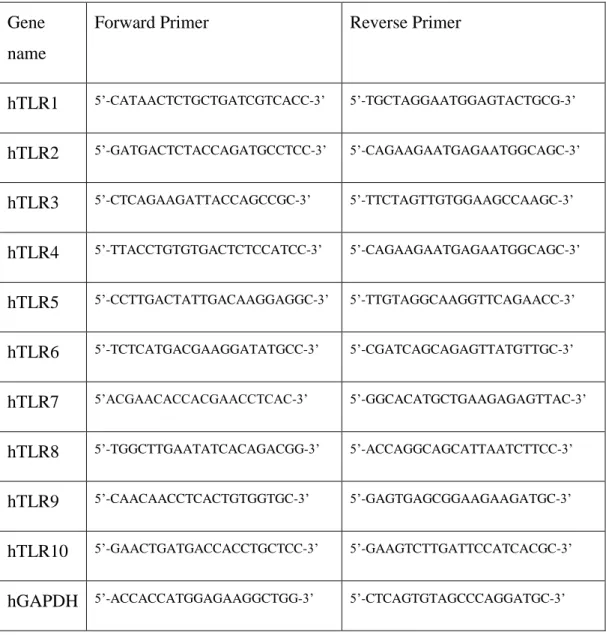
2.1.4. Primers
Primers used throughout this study were designed by using Primer Designer 3.0 Program (http://frodo.wi.mit.edu/primer3/input.htm). All the primer pairs were blasted against the human genome (http://www.ncbi.nlm.nih.gov/BLAST/)
Table 2.1.: Primers pairs involved in this study are enlisted as depicted below.
Gene name
Forward Primer Reverse Primer
hTLR1 5’-CATAACTCTGCTGATCGTCACC-3’ 5’-TGCTAGGAATGGAGTACTGCG-3’ hTLR2 5’-GATGACTCTACCAGATGCCTCC-3’ 5’-CAGAAGAATGAGAATGGCAGC-3’ hTLR3 5’-CTCAGAAGATTACCAGCCGC-3’ 5’-TTCTAGTTGTGGAAGCCAAGC-3’ hTLR4 5’-TTACCTGTGTGACTCTCCATCC-3’ 5’-CAGAAGAATGAGAATGGCAGC-3’ hTLR5 5’-CCTTGACTATTGACAAGGAGGC-3’ 5’-TTGTAGGCAAGGTTCAGAACC-3’ hTLR6 5’-TCTCATGACGAAGGATATGCC-3’ 5’-CGATCAGCAGAGTTATGTTGC-3’ hTLR7 5’ACGAACACCACGAACCTCAC-3’ 5’-GGCACATGCTGAAGAGAGTTAC-3’ hTLR8 5’-TGGCTTGAATATCACAGACGG-3’ 5’-ACCAGGCAGCATTAATCTTCC-3’ hTLR9 5’-CAACAACCTCACTGTGGTGC-3’ 5’-GAGTGAGCGGAAGAAGATGC-3’ hTLR10 5’-GAACTGATGACCACCTGCTCC-3’ 5’-GAAGTCTTGATTCCATCACGC-3’ hGAPDH 5’-ACCACCATGGAGAAGGCTGG-3’ 5’-CTCAGTGTAGCCCAGGATGC-3’
2.1.5. Agarose Gel Electrophoresis
Horizontal gel electrophoresis apparatus was Thermo EC Midicell Primo EC330. The power supply and eletrophoresis gel system were EC250-90, they were both from Thermo Scientific (MA, USA). Alternative power supplies used in experiments were Power-PAC300 and Power-PAC200, both from Bio-Rad Laboratories (CA, USA).
2.1.6. Spectrophotometry
Protein concentration measurements of Bradford assay were done by using Beckman Du640 spectrophotometer from Beckman Instruments Inc. (CA, USA).
2.1.7. Determination of Gene Expression
2.1.7.1. Total RNA Isolation
Phenol-Chloroform extraction method was followed for RNA isolation from cultured-cells.
2.1.7.2. First Strand cDNA Synthesis
ProtoScript M-MuLV First Strand cDNA synthesis kit from New England Bioloabs, Inc. (MA, USA) was used for the first strand cDNA synthesis.
2.1.8. Antibodies
Antibodies, both primary and secondary, were purchased from a variety of incorporations. Information denoting the catalog number, working conditions, and company name were listed in Table 3.
Table 2.2: Listed version of the antibodies used in this study
Antibody Name Company and
catalog number Western Blot Dilution Immunostaining Working Dilution Calnexin Sigma-Aldrich, C4731 1:5000
α-tubulin Calbiochem, CP06 1:5000
Anti-mouse-HRP Sigma-Aldrich, A0168 1:5000
Anti-goat-HRP Abcam, Ab6741 1:5000
Anti-rabbit-HRP Sigma-Aldrich,6154 1:5000
β - Actin Sigma, A5441 1:10000
Anti-mouse/rabbit Alexa Fluor 488
Invitrogen, A11034 1:750 (IF)
Anti-mouse/rabbit Alexa Fluor 586
Invitrogen, A11034 1:750 (IF)
Sox9 Millipore, AB5535 1:1000 1:1500 (IF)
HNF4α Santa Cruz
Biotechnologies, sc6556
1:300 1:150 (IF)
CD133 (pure) Miltenyi, 130-090-422 1:100 (IF/IP)
CD133-APC Miltenyi, 130-090-826 1:30 (Flow
Cytometry)
EpCAM-FITC Miltenyi, 130-080-301 1:30 (Flow
Cytometry)
Annexin V - FITC BD Pharmingen, 556419 1:20 (Flow
Cytometry)
Propidium Iodide Solution
BioLegend, 421301 1:10 (Flow
2.1.9 Immunoperoxidase Assay Reagents
DAKO Envision + system was purchased from DAKO (Glostrup, Denmark). 2.1.10 TLR Ligands
TLR ligands used in this study were supplied from several companies. Lipopolysaccharide (LPS) (isolated from E.coli; Sigma, USA), peptidoglycan (PGN) (isolated from B.subtilis; Fluka, Switzerland), pI:C (Amersham, UK), R848 (Invivogen, USA), LTA (Invivogen, USA), Resiquimod (Invivogen), K23 (Alpha DNA, Canada), Flagellin (Sigma, USA).
Sequence for K23 is as follows:
K23 (12mer) : 5’-TCGAGCGTTCTC-3’, phosphoryl(thio) manufactured.
2.2. Solutions and Media
2.2.1. General solutions
50X Tris-Acetate-EDTA Buffer 242 g Trisma base, plus 100 mL of 0.5 M EDTA (pH: 8.0), plus 28.55 mL of Glacial Acetic Acid were combined and overall completed to 1L with ddH2O. Working
dilution: 1X
10X Tris buffered saline (TBS) 12.9g Trisma base and 87.76g NaCl combined in 1 L ddH2O.
pH adjustment : 8.0. Working dilution: 1X.
12.1 g of Trisma was dissolved in 100mL of ddH2O.
1,5M Tris HCl 18.1 g Trisma base was dissolved in 100 mL of ddH2O.
pH adjustment: 8.8. 10X Phosphate Buffered Saline
(PBS)
80g NaCl, 14.4g Na2HPO4, 2g KCl, 2.4g
KH2PO4 were combined in 1 liter of ddH2O.
Working dilution: 1X.
2.2.2. Tissue culture solutions
DMEM/RPMI media In order to prepare complete medium 1% Non-essential amino acids (NEAA), 1% Penicillin/Streptomycin, 10% Fetal Calf Serum (FCS) all added to supplied commercial medium. Keep at 4°C.
10X Phosphate buffered saline (PBS) 80g NaCL, 14.4g Na2HPO4, 2.4g KH2PO4,
2g KCl were all dissolved in 1 L ddH2O.
Working dilution: 1X. Storage Temperature: 4°C.
2.2.3. Immunofluorescence Staining Solutions
4% Paraformaldehyde 4g paraformaldehyde was dissolved in 100mL ddH2O, solution heated at 130°C for
1 hour. Let cool down before use.
4% Formaldehyde 100mL of 40% Formaldehyde was
dissolved in 1L ddH2O.
Blocking solution 0.2% PBS Tween-20 with 10% FCS
DAPI (4’,6-diamidino-2-phenylindole) Stain
Prepared as 1μg/ml solution in ddH2O.
2.2.4. Immunoperoxidase Staining Solutions
Fixation solution 1:1 ratio solution of Acetone: Methanol, mixed and stored at -20°C
Blocking solution 10%FCS and 0.3% TritonX-100 solution prepared in 1XPBS.
Washing solution 0.3% TritonX-100 dissolved in 1XPBS 3% H2O2 solution Prepared as 6mL 30% H2O2 added to 20mL
methanol and 34mL ddH2O solution.
DAB reagent Chromogen and substrate were mixed as described in DAKO Envision + Dual Link System-HRP kit.
2.2.5. Sodium Deodecyl Sulphate (SDS)-Polyacrylamide Gel Electrophoresis (PAGE) and Immunoblotting Solutions
10X Tris buffered saline (TBS) 12.9g Trisma base + 87.76g NaCl in 1L of ddH2O.
pH adjustment: 8.0 Working dilution: 1X.
10X SDS Running buffer 144g Glycine + 30g Trisma base and 50mL of 10% SDS were mixed in 1L ddH2O.
10X Transfer buffer 72g Glycine + 58g Trisma base + 2mL of 10% SDS dissolved in 1L ddH2O.
Working dilution is 1X, and this solution includes 10-20% Methanol (depending on the experiment setup).
TBS-Tween 20 0.2% Tween 20 dissolved in 1X TBS.
Ponceau S 0.1% (w/v) Ponceau S and 5% (v/v) acetic acid prepared in ddH2O.
Blocking solution 0.2% TBS-Tween 20 was prepared. Non-fat dry milk or bovine serum albumin (BSA) was added to the solution to get 5% (w/v) final ratio. (Usage of dry milk or bovine serum is determined according to the antibodies.)
2.2.6. Preparation of DAPT and rhJagged-1
DAPT was purchased from Sigma-Aldrich Chemie GmbH (MO, USA). Recombinant human Jagged-1 Fc Chimera was purchased from R&D Systems (MN, USA) Recombinant human Jagged-1 was reconstituted at 200μg/mL in sterile PBS as described in manufacturer’s protocol. Working concentration for rhJagged-1 was 50ng/ml. DAPT was reconstituted at 18mg/mL in sterile DMSO. Working concentration was 50uM.
2.3. Methods
2.3.1 Tissue Culture Methods
2.3.1.1 Cell Lines and Growth Conditions of Cells
Various hepatocellular carcinoma cell lines were studied throughout this work. Some of these cell lines including FLC4, FOCUS, Hep3B, Hep40, HepG2, Huh7,
PLC/PRF/5, Mahlavu, and SK-HEP-1 were cultured in DMEM. Rest of the cell lines SNU182, SNU387, SNU398, SNU423, SNU449, and SNU475 were kept in RPMI medium. Supplemental media including 10% fetal calf serum, 1XNEAA, 2mM L-Glutamine and 100 units of Penicillin/Streptomycin were added to DMEM and RPMI to acquire their complete forms. Cultured cells were incubated at 37°C with 5% CO2 maintenance. Before usage, all media were pre-heated to warm up until
37°C.
2.3.1.2 Passaging Cells
Adherent HCC cell lines were passaged before reaching complete confluency. Following the transfer of plates from incubator to hood, the old media was aspirated and washed once with sterile 1XPBS. Having been washed with PBS, and the consequent aspiration of PBS, Trypsin-EDTA was dropped equally over the cells to make them detach from the surface. With the addition of Trypsin-EDTA plates were put back into the incubator, which was set for 37°C with 5% CO2 maintenance. Upon
detachment of the cells from the bottom of the plates, fresh sterile media was added onto the cells to halt the action of trypsin (meanwhile, it is important to keep cells in Trypsin as short as possible to prevent any damaging to cell surface). With pipetting, cells were distributed as single cells and divided into different dilutions according to the experimental requirements.
2.3.1.3 Thawing and Cryopreservation of Cells
Thawing of cells required important amount of caution, upon removal of cells from liquid nitrogen, cells were placed on ice to prevent their contact from warm air. Cryotubes were immediately put in water bath, which was pre-heated to 37°C. After the ice in the vials melted, cells were transferred into a 15mL falcon tube having 5mL of the preferred media. By pipetting the cells were carefully gotten rid of DMSO, which is toxic to cells. Then, the falcon was centrifuged at 1600rpm for 4 minutes. After centrifuge supernatant was aspirated and the pellet was re-suspended with fresh complete media, and put in petri dish. The dish was then placed into the incubator, which was set for 37°C with 5% CO2 maintenance.