Copyedited by: PSB MANUSCRIPT CATEGORY: APPLICATIONS NOTE
[15:18 8/1/2010 Bioinformatics-btp665.tex] Page: 429 429–431
BIOINFORMATICS
APPLICATIONS NOTE
Vol. 26 no. 3 2010, pages 429–431doi:10.1093/bioinformatics/btp665Systems biology
ChiBE: interactive visualization and manipulation of BioPAX
pathway models
Ozgun Babur
1
,2,3
, Ugur Dogrusoz
1
,2,∗
, Emek Demir
3
and Chris Sander
3
1
Center for Bioinformatics,
2Computer Engineering Dept., Bilkent University, Ankara, Turkey and
3
Computational Biology Center, Memorial Sloan-Kettering Cancer Center, New York, NY, USA
Received on September 2, 2009; revised on November 11, 2009; accepted on November 27, 2009 Advance Access publication December 9, 2009
Associate Editor: Trey Ideker
ABSTRACT
Summary: Representing models of cellular processes or pathways
in a graphically rich form facilitates interpretation of biological observations and generation of new hypotheses. Solving biological problems using large pathway datasets requires software that can combine data mapping, querying and visualization as well as providing access to diverse data resources on the Internet. ChiBE is an open source software application that features user-friendly multi-view display, navigation and manipulation of pathway models in BioPAX format. Pathway views are rendered in a feature-rich format, and may be laid out and edited with state-of-the-art visualization methods, including compound or nested structures for visualizing cellular compartments and molecular complexes. Users can easily query and visualize pathways through an integrated Pathway Commons query tool and analyze molecular profiles in pathway context.
Availability: http://www.bilkent.edu.tr/%7Ebcbi/chibe.html Contact: [email protected]
Supplementary information: Supplementary data are available at
Bioinformatics online.
1
INTRODUCTION
Our knowledge of cellular processes has been increasing at a
dramatic rate. Efficient construction and use of a knowledge base
of cellular pathways depends highly on a strong representation (i.e.
a structured semantic encoding of knowledge). Such a knowledge
base can then act as a blueprint for simulations and other analysis
methods, improving our ability to understand and predict the
behavior of cells (Demir et al., 2004).
Computational biologists have advanced pathway knowledge
representation, created standards and formats (http://www.biopax
.org; http://sbml.org; Caspi et al., 2008; Demir et al., 2004; Kanehisa
et al., 2007; Matthews et al., 2009), and built more than 300
pathway and interaction databases (Bader et al., 2006) in recent
years. However, current bioinformatics infrastructure is still lacking
in software tools for visualizing and analyzing pathways. A main
obstacle in this direction has been the fragmented, incomplete and
∗To whom correspondence should be addressed.
incompatible nature of pathway knowledge, making representation
and integration of pathways extremely difficult.
A number of interesting pathway visualization tools (Elliott et al.,
2008; Funahashi et al., 2008; Hu et al., 2008; Yeung et al., 2008)
have been developed over the past decade, with diverse analysis
focus, from analyzing gene expression profiles to effective database
querying, to discovering graph-theoretic properties in biological
networks. Such tools can benefit substantially from standardization
of knowledge representation, pathway-specific layout algorithms
and representation of compound graphs.
Knowledge representation:
BioPAX has made great progress in
developing a standard exchange format for biological pathway data,
as a result of several years of community effort. Pathway Commons
(PC), based on BioPAX, was developed as an integrated single point
of access to publicly available pathway information. PC covers
major pathway databases (http://www.pathwaycommons.org) and
already provides integration at the level of molecular identifiers.
Therefore, the community now has an emerging platform for
building software tools and services without worrying about
compatibility and fragmentation issues.
Pathway layout: general graph layout algorithms do not address the
specific needs and established conventions of pathway graphs. So
far, work on pathway layout algorithms (Becker and Rojas, 2001;
Genc and Dogrusoz, 2006; Karp and Paley, 1994; Schreiber, 2002;
Wegner and Kummer, 2005) has primarily focused on biochemical
pathways. Thus, the need for layout of complex pathways, such as
signal transduction, remains to be addressed.
Compound graphs:
an extension of graph-based representation,
namely hierarchically structured or compound graphs, in which
a member of a biological network may recursively contain
a sub-network of other pathway elements, can be used for
representing subpathways, molecular complexes and subcellular
location. Compound graphs also help in managing complexity by
interactively decomposing a pathway into distinct components or
modules (Demir et al., 2004; Fukuda and Takagi, 2001). The recently
introduced visualization standard SBGN (Le Novere et al., 2009)
also uses compound graphs extensively.
ChiBE is an open source visualization tool, which for
the first time, brings together compound graph-based BioPAX
visualization, seamless PC access, pathway-specific layout and
strong visualization and data analysis capabilities. A comparison
Copyedited by: PSB MANUSCRIPT CATEGORY: APPLICATIONS NOTE
[15:18 8/1/2010 Bioinformatics-btp665.tex] Page: 430 429–431
O.Babur et al.
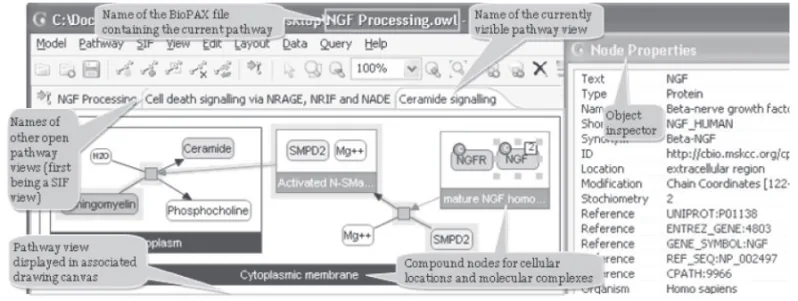
Fig. 1. ChiBE views are organized in canvasses, each displaying one or more BioPAX pathways.
of ChiBE with similar visualization tools can be found in Section 3
of Supplementary Material.
2
DESCRIPTION
ChiBE accepts data in BioPAX Level 2 format. Section 1 of Supplementary Material summarizes how BioPAX models are interpreted by ChiBE. We call the entire set of biological information loaded from a BioPAX file a pathway
model. As defined by BioPAX, a pathway is a set or series of interactions,
often forming a network, which biologists have assembled for organizational, historic, biophysical or other reasons. We use pathways to determine the boundaries of a coherent view. Each loaded pathway is displayed in a separate canvas, organized with tabs (Fig. 1). A pathway model may be expanded by merging it with another BioPAX file or PC query.
A pathway view is composed of pathway objects and their interactions. Compound nodes are exclusively used to represent molecular complexes and
cellular compartments (Fig. 1). Our notation is similar to that of PATIKA
(Demir et al., 2004). ChiBE has context-sensitive pop-up menus associated with pathway objects, providing fast access to popular operations for the associated pathway object. All kinds of nodes and edges in a pathway view have distinct properties and UIs (User Interfaces). These properties can be changed by using inspectors for each pathway object.
Viewing and editing pathways: the user has various mechanisms for navigating and editing the topology as well as the geometry of pathway views. These mechanisms range from standard zoom/scroll and highlight operations to modifying the UI associated with each pathway object and to automatic layout of the pathway view.
Pathway operations: any subset of available pathways in a model may be
displayed as a separate view, and may be saved as an image or printed. Each subset may then be modified as desired. Also, new pathway views may be created by duplicating, cropping or capturing a neighborhood of a view.
Querying PC: PC is a convenient point of access to biological pathway information collected from public pathway databases, which one can browse or search. ChiBE provides a graphical user interface to search this knowledge base to find pathways that contain a specified molecule (using its UniProt or Entrez Gene ID), and present the results in a visual form. The resulting view may contain either the whole pathway or only the immediate neighborhood of the specified molecule in all the pathways in which it appears.
SIF operations: SIF (simple interaction format) is a format introduced by
Cytoscape (Yeung et al., 2008) for describing interactions in a biological network. ChiBE can reduce BioPAX pathways to SIF using a customizable set of rules to obtain a simpler view. Pathways can also be saved in SIF.
Visualizing high-throughput data: multiple types of high-throughput data,
such as gene expression or proteomics profiles, copy number variation and mutation data, can be loaded into ChiBE, and overlaid onto pathway views using color coding or displayed in tables that can be searched and filtered (Section 2 of Supplementary Material).
Availability and components: ChiBE is a free (EPL v1.0) Java application that runs on Windows, Mac OS and Linux. It was built using Chisio 1.0 (http://www.cs.bilkent.edu.tr/%7Eivis/chisio.html) and Eclipse GEF 3.1 (http://www.eclipse.org/gef) for graph visualization, Paxtools (http://www.biopax.org/paxtools) for accessing and manipulating BioPAX files and PATIKAmad (Babur et al., 2008) for high-throughput data visualization.
3
CONCLUSIONS
ChiBE can be a valuable tool for visualizing BioPAX models and
high-throughput data in the context of pathways, and as a front-end
for PC, making pathway knowledge more accessible and usable for
biologists. We aim to enrich editing and querying support in ChiBE,
provide support for the recently released BioPAX Level 3 ontology
and format, and for the graphical notation standard SBGN.
Funding: The Scientific and Technological Research Council of
Turkey (grant 104E049); US National Institutes of Health (grant
P41HG004118).
Conflict of Interest: none declared.
REFERENCES
Babur,O. et al. (2008) PATIKAmad: putting microarray data into pathway context.
Proteomics, 8, 2196–2198.
Bader,G.D. et al. (2006) Pathguide: a pathway resource list. Nucleic Acids Res., 34, D504–D506.
Becker,M.Y. and Rojas,I. (2001) A graph layout algorithm for drawing metabolic pathways. Bioinformatics, 17, 461–467.
Caspi,R. et al. (2008) The MetaCyc Database of metabolic pathways and enzymes and the BioCyc collection of Pathway/Genome Databases. Nucleic Acids Res., 36, D623–D631.
Demir,E. et al. (2004) An ontology for collaborative construction and analysis of cellular pathways. Bioinformatics, 20, 349–356.
Elliott,B. et al. (2008) PathCase: pathways database system. Bioinformatics, 24, 2526–2533.
Copyedited by: PSB MANUSCRIPT CATEGORY: APPLICATIONS NOTE
[15:18 8/1/2010 Bioinformatics-btp665.tex] Page: 431 429–431
ChiBE
Fukuda,K. and Takagi,T. (2001) Knowledge representation of signal transduction pathways. Bioinformatics, 17, 829–837.
Funahashi,A. et al. (2008) CellDesigner 3.5: a versatile modeling tool for biochemical networks. Proc. IEEE, 96, 1254–1265.
Genc,B. and Dogrusoz,U. (2006) A layout algorithm for signaling pathways. Inf. Sci.,
176, 135–149.
Hu,Z. et al. (2008) VisANT: an integrative framework for networks in systems biology.
Brief. Bioinform., 9, 317–325.
Kanehisa,M. et al. (2007) KEGG for linking genomes to life and the environment.
Nucleic Acids Res., 36, D480–D484.
Karp,P.D. and Paley,S. (1994) Automated drawing of metabolic pathways. In Third
International Conference on Bioinformatics and Genome Research, Tallahassee,
Florida, pp. 225–238.
Le Novere,N. et al. (2009) The systems biology graphical notation. Nat. Biotechnol.,
27, 735–741.
Matthews,L. et al. (2009) Reactome knowledgebase of human biological pathways and processes. Nucleic Acids Res., 37, D619–D622.
Schreiber,F. (2002) High quality visualization of biochemical pathways in BioPath.
In Silico Biol., 2, 59–73.
Wegner,K. and Kummer,U. (2005) A new dynamical layout algorithm for complex biochemical reaction networks. BMC Bioinformatics, 6, 212.
Yeung,N. et al. (2008) Exploring biological networks with Cytoscape software. Curr.
Protoc. Bioinformatics, Chapter 8, Unit 8.13.