CHARACTERIZATION AND IMAGING WITH
LAMB WAVE LENS AT GIGAHERTZ FREQUENCIES
A.
Bozkurt,G . Yaralloglu,
A.
Atalar,H.
Koymen, K.Kramer
t
Electrical a n d Electronics Engineering Department Bilkent University, Ankara,
TURKEY
06533
t K r a m e r Scientific Instruments, Herborn, GERMANY
35745
ABSTRACT
Lamb wave lenses with conical refracting surfaces are fabricated for use at 400 MHz and 1 GHz. The coni- cal surfaces are ground and polished with mechanical means and they are sufficiently smooth for the frequen- cies of interest. T h e wide bandwidth of transducers allow frequency tuning necessary for Lamb wave lenses. The fabricated lenses show the expected V ( 2 ) perfor- mance. At high frequencies the attenuation in the cou- pling medium can be very high, but due to the smaller wavelength the resolution is better and defocus distance can be reduced. Inherently higher leaky wave sensitivity of Lamb wave lens enables a good V ( 2 ) characteriza- tion ability a t higher frequencies as compared to the conventional spherical lens.
Subsurface imaging with these Lamb wave lenses gives satisfactory results for layered structures. Cho- sen object has leaky wave modes within the angular coverage of the lens. The images exhibit a resolution close to the diffraction limit.
Experimental V ( 2 ) curves obtained with these lenses along with images are presented
INTRODUCTION
The Lamb wave lens (LWL) 111 was proposed for imag- ing and characterization of layered structures. It differs from a conventional acoustic microscope lens in that it has a conical refracting element, which is able to selectively excite surface wave modes. This implies a higher subsurface wave excitation efficiency compared to the spherical lens. The LWL images obtained are easy to interpret since only one mode is involved. Due t o higher efficiency of leaky wave excitation, a higher accuracy in characterization is expected. Previously we have demonstrated the LWL a t relatively low fre- quencies. In this paper we report LWLs operating a t
400 MHz and 1 GHz. We present images obtained with this lens.
LENS GEOMETRY
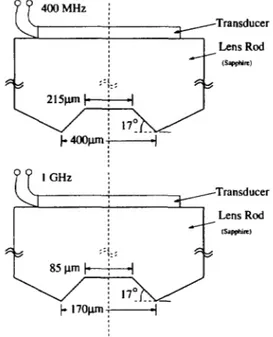
LWLs have been designed to operate at 400 Mllz and 1 GHz with the dimensions depicted in Fig. 1. The
1051-0117/94/0000-1417
$4.00
0
1994
IEEE
Figure 1: Dimensions of the Lamb wave lenses
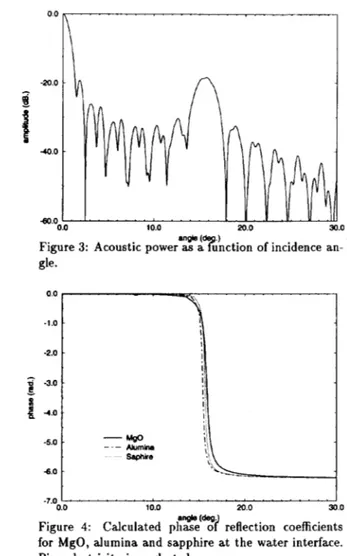
lenses are fabricated on sapphire rods with a transducer geometry very similar t o the conventional lens. The conical LWL cavities are ground on the opposite end of sapphire rods using mechanical means. An optical microscope image of the lens is given in Fig. 2. The lens surface is sufficiently smooth and conical surfaces are flat within one wavelength. The lens surfaces are coated with a quarter wavelength glass layers to act as matching medium between sapphire and water. The as- sociated angular spectrum a t the front focal plane is in Fig. 3. The cone angle of the LWLs are chosen to be small one suitable t o use with high velocity ma.terials such as sapphire, alumina and MgO. These materials are particularly difficult t o penetrate with conventional lenses due to their high impedances and narrow angu- lar width for surface wave excitation. In particular, for MgO,
K
= 8852m/sec andK
= 6368m/sec [2]. LWL is suitable for penetration into high impedance materialsFigure 2: Optical micrograph of Lamb wave lens oper- ating a t 400 MHz
with good efficiency [3]. The calculated reflection coef- ficients [4] for sapphire, MgO and alumina are provided in Fig. 4. The phase transitions for these materials co- incide with the peak in the angular spectrum of the LWL, indicating a proper combination. This particular lens can be used for materials with leaky wave velocities in the range 5100 t o 6100 m/sec.
Overlapping and hence interfering specular and leaky wave signals are desirable for characterization purposes, such a combination results in periodic variations in the
V(2)
curve. To achieve this RF-pulse width must be sufficiently long. On the other hand, when the LWL is used for imaging purposes, poor resolution of the unfo- cused central beam is a problem. To improve resolution, the effect of the central beam can be eliminated by using sufficiently short pulses and time gating. It is possible to choose only the leaky wave echo amplitude for image generation. When the defocus distance is sufficient, the specular and leaky parts can be separated in time.EXPERIMENTS
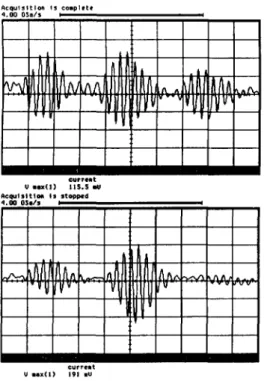
We have performed experiments with the 400 MIIz LWL. In Fig. 5, two oscilloscope traces are provided for the lens operating a t 380
MHz.
Referring t o Fig. 6, the first pulse is the spurious signal generated from the front surface of the lens. The second pulse is the specular central beam echo and the third pulse, if exists, is the leaky wave echo. In the first oscilloscope trace, the specular and leaky wave echoes can be seen well separated using a pulse width of 25 nsec. The second trace depicts the return signal for a material on which no leaky wave modes can be excited. About 30 nsec sep- aration between the pulses is consistent with the path differences of the rays depicted in Fig. 6. Fig. 7 depicts experimentally measured amplitude variations of spec- ular and leaky wave echos as a function of parameter0 Figure 3: Acoustic powe:$A%)nction of incidence an- gle. -2.0 -“O
I
-
F1 -3.0 - e 4-
g
4.0 -5.0 - 6 . 0 - 0.0 10.0 20.0 30.0 angle (degFigure 4: Calculated phase oi’ reflection coefficients for MgO, alumina and sapphire at the water interface. Piezoelectricity is neglected.
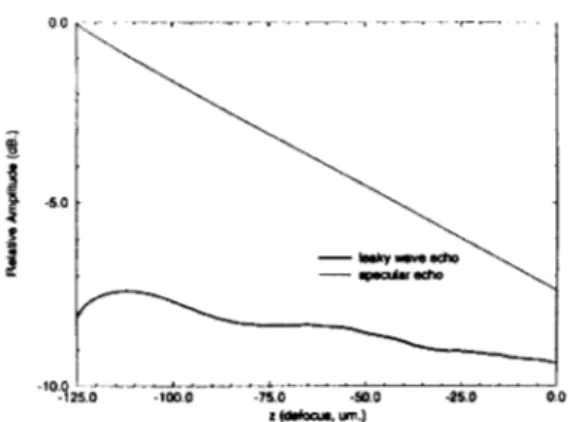
z. These curves are also in agreement with expecta- tions [5]. The leaky wave part,
VL(Z),
increases as z gets close t o zero, i.e., when the subsurface propaga- tion distance is minimum. The specular or geometric part,VG(Z),
on the other hand, grows when the object lens spacing is reduced. Fig. 8 is a calculated plot of the same quantities. These curves are obtained using a simulation program which uses ray theory arguments to include the effect of the refracting element and angular spectrum approach elsewhere t o take care of diffraction.To obtain the
VL(Z)
curve, no central beam is assumed t o originate from the lens, which is, in effect, equiva- lent to blocking the center. Similarly, t o get the V c ( z )curve, the conical beam is suppressed. The agreement between the theoretical and experimental V , ( z ) curves is excellent. However, a good match between the V L ( Z ) curves can be achieved only when the surface wave at- tenuation in the object material is included.
For imaging purposes, a high frequency measure- ment electronics has been integrated with a commer-
Figure 5: Two oscilloscope traces of reflected signals from a 380 MHz Lamb wave lens for two different ob- jects. The leaky wave echo can be seen in the first one since the cone angle matches the critical angle while for the second image no leaky wave contribution exists and hence the third pulse is not visible.
cia1 acoustic microscope' which normally operates be- low 100 MHz. T h e high frequency electronics provides synthesizer generated tone bursts where the synthesizer is synchronized with the pulse repetition rate. The com- mercial acoustic microscope controls the mechanical x-y scan system, provides the pulse repetition rate and is able t o read the detected signal level in digital form. Data are interpreted by a computer, which provides a easy-to-use interface for viewing, image format conver- sion and archiving purposes. T h e system enables the imaging with a minimum pixel spacing of 4 pm.
There are two alignment requirements on the scanner-lens system for images of satisfactory quality. First of all, the lens axis should be perpendicular to the specimen surface for maximum signal reception. llow- ever, this adjustment does not need not t o be perfect while the conical beam has a finite angular width. There will be negligible reduction in the leaky signal echo with a slight misalignment. Secondly, the scan plane needs t o be aligned with the sample. This assures that the lens-specimen spacing remains unaltered as the lens is moved back and forth during scanning. IIence, the re-
'Krirner Scientific Instrurnenls SAM 100 Acoustic Microscope
Figure 6: Rays indicating different pulses seen on the oscilloscope traces.
-r_, .
Figure 7: Measured amplitude variations of specular and leaky wave echoes as a function of distance between the lens and the MgO surface. Operating frequency is
380 MIIz.
turn signals stay within a certain time interval, enabling time gating for measurement purposes.
Fig. 9 and Fig. 10 are acoustic images of unpolished surface of a MgO crystal sample obtained with this sys- tem a t 380 MIIz. The first image uses the specular echo for comparison purposes while the second uses the leaky wave echo. The first image has a poor resolution due to the unfocused nature of tlie central beam. Image shows a resolution of about 150 pin. Since the flat portion at the centpr of tlie lens has a diameter of 200 p m , the reso- lution is in that order. Obviously, the second image has a better resolution. The wavelength of leaky wave a t the operation frequency is about 16 p m , and the expected resolution is in the same order [SI. T h e observed sub- surface resolution on the image is about 30 pm. Since MgO is a high velocity material, resolution is poorer compared t o that in lower velocity materials.
If the object under investigation has layers, fre- quency tuning may be necessary to match a leaky mode t o the fixed incidence angle of the lens.
0 0
Figure 8: Calculated amplitude variations of specular and leaky wave echoes as a function of distance between the lens and the MgO surface. The surface wave atten- uation in MgO is neglected. Operating frequency is 380 MHz.
Figure 10: Image of MgO surface using the leaky wave echo. Image dimensions are 3 mm by 3 mm.
References
[l] A. Atalar and
H.
Koymen “A high efficiency Lamb wave lens for subsurface imaging,” inP m .
of IEEE1989 Ultrasonics Symposium, pp. 813-816, 1989. [2] A. Briggs. Acoustic Microscopy. Oxford University
Press, Oxford, 1992.
[3] A. Atalar, L. Degertekin, and H. Koymen “Recent Advances in Acoustic Microscopy,” in IEEE Ultra-
sonic Proceedings, pp. 719-726, 1991.
(41 L.M. Brekhovskikh. Waues in Layered Media. Aca- demic Press, New York, 1980.
[5]
1I.L.
Bertoni “Ray-optical evaluation of V(Z) in the reflection acoustic niicroscope,”IEEE
Trans. Son.Ulfrason., vol. 31, pp. 105-116, 1984.
[6] N. Gunalp and A. Atalar “Response of acoustic imaging systems using convergent leaky waves t o cylindrical flaws,”
IEEE
Trans. on Ultrason. Ferro.and Fmq. Cont., vol. 36, pp. 507-516, 1989. Figure 9: Image of MgO surface using specular echo.
Image dimensions are 3 mm by 3 mm.
CONCLUSION
We have demonstrated the feasibility of manufacturing Lamb wave lenses at high frequencies. The Lamb wave lens is adapted for use in a commercial acoustic micro- scope. We have presented subsurface images of high velocity materials which are hard t o penetrate. If suffi-
ciently short RF-pulses are used it is possible to separate leaky wave and specular echos in the time domain, and there is no need t o block the central beam for imaging purposes. T h e separation of pulses also permits the de- termination of V L ( Z ) and