Ι· 0
t:
6
6/
1L εy ^■ J. O У ' л : r J'C » ; ■ CJ * Г " P v / i < ^ i u tu ^ ! it' ^ c: . • і ; . . І İÎ '-yà l к. L ä 1 . ■ ü i. \ :Г J я f ·. ' ■ ¿· и .h lí. г ; й i , g ^ ^ Π ^ ^ i '^ • ’ \ * ■ r *^ ' l, ■ * '■ / Î* ' · ' *■ ' . ' ' ■* ' * ■ Î {· ^1 * í* . r^ ¿ [ A V ■ 5 j, Й t · ·. ¿ ¿J, ; ^·. · ', ... i ... U · ?Ы J ;·;. L cx V W - /WV . * - · '/■. ' .(*DIGITAL BEAMFORMING TECHNIQUES AND VLSI
A I.'iSSICRTATrON
SUBMITTED TO THE DEPAlEFM ION']' OF lOLEC'nUCAL AND ELECmiONICFS ENGINEERING
AND THE JNS'I'ÍTUTE OF 10NGÍN EER ÍNCJ AND SCIENCI·: OF BILK ENT UNI VERS ÍTY
IN PARTIAL FULFILLMENT OF THE REQUIREMENTS FOR THE DEGREE OF
DOCTOR OF PHILOSOPHY
tarafindon Lc";;lcnn;ii5tir.
By
M ustafa K aranian
Deceinlxu 1992
Й 3 3 8 6 [ Т 3 i ( ■ к з ѵ m ı ί · Ι
I certify that I have read this thesis and that in iny opinion it is fully adequate, in scope and in quality, as a dissertation for the degree of Doctor of Philosophy.
liayi/ettin Koymen/Ph. D. (Supervisor)
I certify that I have read this thesis and that in my opinion it is fully cidequate, in scope and in quality, as a dissertation for the degree of Doctor of Philosophy.
AlKlullah Atalar, Ph. D. (Supervisor)
I certify that I have read this thesis and that in niy opinion it is fully adequate, in scope and in quality, as a dissertation for the degree of Doctor of Philosophy.
/ D ima/
I certify that I have recid this thesis and that in my opinion it is fvdly cidequate, in scope and in quality, as a dissertation for the degree of Doctor of Philosophy.
Levent Onural, Ph. D.
I certify that I have read this thesis and that in my opinion it is fully adequate, in scope and in quality, as a dissertcition for the degree of Doctor of Philosophy.
'\AAf İ . Â 7 ^
Mehmet Ali Tan, Ph. D.
I certify that I have read this thesis and that in my opinion it is fully adequate, in scope and in quality, as a dissertation for the degree of Doctor of Philosophy.
Approved for the Institute of Engineering and Science:
, Ph. I ^ / Mehmet Baray,
A b str a c t
DIGITAL BEAMFORMING TEGHNIQUES AND VLSI
CIRCUITS FOB, MEDICAL ULTR.ASOUND IMAGING
Muataia Kararnaii
Pli. D. in Electrical and Electronics Engineering
Supervisors:
Hayrettin Koyinen, Pli. I). and Alnlullali Atalar, Pli. D.
Dec ember 1992
I'oi ])]icLSccl fU 1 a.y niedicci.1 u]ira.;-iouiu.l imaging, digital bcamlorming technic|ues and VLSI circuits are studied to form a full}' digital receive front-end hardware. To increase the timing accuracy in lieamiorming, a computationally efRcient ui)sam|ding scheme is e.xa.mined. A digital heainforming method ,ba.sed on leceive locusing at the raster focal points is proposed. The sector images oi the resolution pliantom, reconstructed frcmi the j)hased array ex])eriinental data by beamforming at the radial and raster local points, are presented for com|)a.rison of th(' image resolution performance of the two beamforming schemes, hor adaptive beamiormihg, a pha.se aJic'rration correction techni(|iie with very low computational complexity is described. Image quality performance of the technique is examined by digitally processing the non-aberrated and aberrated phased array experimental data sets of an ultrasound resolution phantom. VLSI circuits and their implementations for the proposed techniques are |)resented. K eyw ords: Medical ultrasound imaging, digital beamformiiig, phased arra.y beamlormiug, jihase aberration correction, VLSI circuit.
ö z e t
TIBBİ ULTRASONİK GÖRÜNTÜLEME İÇİN SAYISAL
DEMETLEME YÖNTEMLERİ VE TÜMDEVRELER
MiLs t afa K araman
Elektrik ve Elektronik Mühendisliği Doktora
Tez Yöneticileri:
Prof. Dr. Ha
3n'ettin Köynıen ve Prof. Dr. Abdullah Atalar
Aralık 1992
Evreli dizilerle gerçekle,ştirilen tıbld uUra,souik görüntülemede, sayrsal bir ön elektronik donanım olırçturmak için .sa.yısci.l demetleme yöntemleri ve tümle,şik devreler önerilmi.§tir. Zamanlama doğruluğunu arttırm ak için verimli bir örnekleme arttırm a yöntemi incele ımiijtir. Ra,ster noktalara odaklamaya dayalı bir sayısal demetleme yöntemi sunıılımı,ştur. Raster ve radyal noktalara odakla yarak gerçekle.ştilülen demetleme yöntemlerini karşılaştırmak için, bir ultrasonik fantomdan elde edilen deneysel veriler kullanılarak oluşturulan ultrasonik sektör görüntüler sunulmuştur. Evre bozukluklarını gerçek zamanda düzeltmek için verimli l)ir yöntem önerilmiştir. Yöntemin verimliliği, fantomdan deneysel olarak alınan normal ve bozuk evreli veriler kullanılarak incelenmiştir. Önerilen bütün yöntemler için tüm devre yapıları ve bunların yüksek ölçekli tümdevre tasarım teknikleri ile gerçekleştirilmesi sunulmuştur.
Anahtar
sözcükler: Tibbi ultra.sonik görüntüleme, sayısal demetleme, evreli dizi lerle demetleme, evre bozukluklarının düzeltilmesi, tümdevre.
A ck n o w led g em en t
I would like to express my deepest gratitude; to Pro!. Dr. Hayrettin Köynıen and Prof. Dr. Abdullali Atalar for their supervi.sion, encourageiTient, and invaluable advice in all step,s of the development of this work. It is my extraordinary chance to work with tliem throughout my graduate study, to be instructed and trained in all as])ects of the research.
I would hke to thank to Prof. Dr. Matthew O'Donnell of Michigan University for his collaboration. He kindi}' pi'ovided the ultrasound phase array experimental data sets of the phantom, advised in ¡n’oeessing of the data, and given valuable commands and revisions on the phase aberration correction part of this work.
I would like to acknowledge the cooperations of Cengiz Aydın, A: Ertugrul Kolağasioğlu, M. Şenol Toygar, İ. Adil Baktır, Radwan Ta,hboııb, Engin Erzin, Fırat Kılıç., and M. Hakan Asyalı, in VLSI implementation of the beamformer chip through a VLSI course iiroject.
I would like to thank to Prof. Dr. Murat Aşkar of Middle East Technical University (METU), for his collaboration through NATO SFS Project (TV- Microdesign) and VLSI Design Center of Turkish Scientific and Research Council (TÜBİTAK) in METU. The data files of layout design rules and simulation parameters for CMOS technology of IMEC-MIETEC of Belgium were provided by this ])roject. He was a member of my l^h. D. proposal jury, and oifered his motivating and directive commaiuis on my research. I would like to acknowledge the cooperations of his graduate SMidents and research staff in the VLSI Design Center, in particular İ. Enis Unga.n and İlharni H. Torunoglii, in installation of the la,yout technology files.
I appreciate Assoc. Prof. Dr. Cevdet Aykaiiat of GELS Department, a member of my Ph. I), proposal jury, lor his valuable discussions on the development of hardware architectures, and for his motivating advises on my research. I would like to thank to Assoc. Prof. Dr. Levent Onural and Assoc. Prof. Dr. Mehmet Ali Ian, the mcml.)ers ol my Ph. D. proposal jury, for their motivating and directive commands on mv research.
I am gratelul to f . Levent Degertekin and Sa.tdmış dbj^cu for their continuous encouragements in all stages of this study, to Cozch'. Bozdagi and M. Ogan Occih for their helps in producing the photogrcaphs of ultrasound images, and to Mürüvvet Parlaka}^, secretary of EEE Department, for her logistical support, and to all members of h^EE Depaidment for their contributions in one way or the other through formal and informal discussions.
I like to acknowledge the financial supports of TÜBİTAK through Acoustic Imaging (Eureka 525) Project and Programme of Support for International Meetings, and the financial support of IEEE Turkey Section, for presentation of this work in the national and international conlerences.
finally, my sincere thanks are due to my (amily for their continuous moral support throughout my graduate study.
C o n te n ts
A bstract
Ozet 11
A cknow ledgem ent 111
Contents
List of Figures Vll
List of Tables X
1 Introduction
2 Basics of Ultrasound Imaging 2.1 Phased Array Beainforrniiig 2.2 B-Modc Sccl.or Imaging 2.3 Ultrasound Image Resolution 3 D igital Beam form ing
3.1 Front-End A rchitecture... 3.2 Riiduction o( Dela.y (Jiia.iiti/,atioii Ihi'O!'
3.2.1 Interpolation .Scheme . . .
3.2.2 Hardware StriictuK' lor Interpolator 3.3 Beamforming at Raster Focal Points
5 G 8 10 11 11 12 13 M 14
3.3.1 PerfoniuuK'.e .Aoalysi.s . . . 17
3.3.2 Ha.rdwaroi Structure, for Digital Beamfornicr 25 3.4 („Concluding Remarks 27 4 Phase A berration Correction 29 4.1 In tro d u ctio n ... 29
4.2 'r<'clmi(|U(i 22 4.2.1 Approach 32 4.2.2 Averaging of Phase E.stim ate.s... 33
4.2.3 Reduction of VVordlengtli... 37
4.2.4 Performance Analy.sis... 38
4.3 VLSI Architectures for Phase E stim a tio n ... 48
4.3.1 Fullword SAD . . 48
4.3.2 One Bit SAD 48 4.4 Concluding R e m a r k s ... 52
5 VLSI Circuits 53 5.1 Im plem entation... 53
5.2 In te rp o la to r... 54
5.3 B eam form er... 55
5.4 Phase Estimator 55 5.5 Concluding R e m a r k s ... 59
6 R esults and Conclusions 60
A ppend ix A 65 A ppend ix B 68 A ppend ix C 70 A ppendix D 75 V ita 90 VI
L ist o f F ig u res
1.1 Block diagram ol a ultrasound imaging system... 2 2.1 Symbolic representations of analog and digital receive beamform
ing schemes... 7 2.2 Scanning technicpKis in ultrasound imaging. 8
2.3 Phased array sector scanning. 9
3.1 Digital receive front-end architecture... 12 3.2 Hardware structure of the linear interpolator. 15 3.3 Radial and raster focal points... 16 3.4 Geometrical configuration for the simulation ])araineters... 18 3.5 Normalized PSF magnitude. The PSF’s in the first and second
rows are obtained l)y beamforming at radial and raster focal points, respectively. The PSF at. the first, second and third columns correspond to the |)oint reflectors located at 2/2, 4/2, and 6/2 away from the arraj^, respective!}'... 19 3.6 Received experimental R,F wavefronts across the array. The
vertical and horizontal widths of each row corres])ond to the aperture size and time interval of 512 sa.mples, respectively. The first, second, third and fourth rows show the samples between 1-512, 513-1024, 1025-1536, 1537-2048, respectively... 20 3.7 Digital processing steps for beamforming at radial and raster points. 21 3.8 Interpolation scheme used in the scan-conversion. 23
3.9 Ultrasound sector images of the standard graphite-gel AIUM resolution ])hantoin. The toj) and l)ottom images are reconstructed by receive beamforming at radial and raster points, respectively, through the digital processing stops depicted in Fig. 3.7. 24 3.10 Architecture of the beamformer... 26 3.11 Functional structure of the processing unit... 27 4.1 Symbolic representation of the phase al)erration in recoiive
beam-forming... 30 4.2 Effect of the phase ¿rberration on PSF... 31 4.3 SAD and cross correlation of two sampled RF signals... 33 4.4 Window configuration used for two dimensional SAD minimization. 34 4.5 Control, aberrated and corrected PSF’s. 36 4.6 One bit representation of the RF signal... 37 4.7 Received RF wavefronts across the arra.y for the control and
aberrated RF data sets. The first, second and third rows show the portions of data sets associated with Plate 0, Plate 1, and Plate 2, respectively. The vertical and liorizontal widths of each row correspond to the aperture size and time interval of 512 samples. 39 4.8 Phase ciberra.tion patterns of tlie plates... 40 4.9 Convergence and accuracy performance of phase, correction schemes
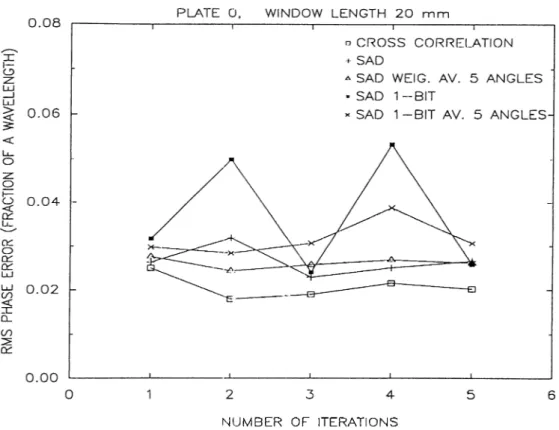
for Plate 0. '\\
4.10 Convergence and accurcicy performance of phase correction scliemes for Plate 1... 42 4.11 Convergence and accuracy performance of phase correction schemes
for Plate 2...' ... 43 4.12 Effect of window size on the accuracy of ])hase estimation
techniques for Plate 1. 44
4.13 Effect of the number of scan angles used for the averaging ol phase, estimates on tlie accuracy performance the SAD with full word
and one bit word length. 45
4.14 Images of a section of the phantom. Control and aberrated images (row 1). The corrected images using full word cross correlation (row 2), full word SAD with weighted average of phase estimates over five scan angles (row 3), and SAD with one bit word length and average of ])liase estimates over five scan angles (row 4). Tlie images in the first, second and tlurcl columns correspond to the data sets associated with Plate 0, Plate 1, and Plate 2, respectively. 46
4.15 Ain¡)litude distortions of tlui phites across the array... 47
4.16 Full word SAD architecture... 49
4.17 Processing unit for the 1-bit SAD architecture... 50
4.18 The high throughput architecture for 1-bit SAD... 51
5.1 Layout of the. designed interpolator chip... 54
5.2 Layout of the. designed beamformer chip... 55
5.3 Connections of tlie beamformer chips for 256 and 128 channels. 56 5.4 Layout of the designed 1-bit SAD chip... 57
5.5 Pipelined data flow scheme of the 1-bit SAD chip... 58
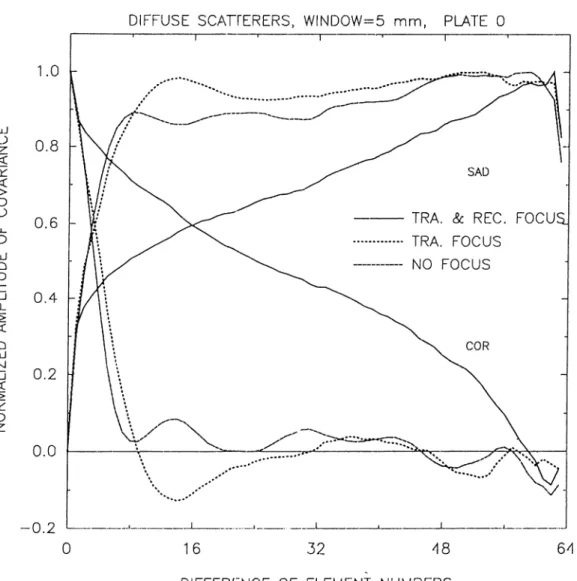
B . l Numerical sirnvdation results showing the. mean and standard deviation of time dehiy estima.te using cross correlation and,SAD. 69 C. l Spatial covariance across the arra.y using correlatioii (COR) and sum of absolute, difference (SAD) for non-focused and focused cases. 72 C.2 Spatial covariance across the anuy using correlation (COR.) and sum of absolute, diflhrence (SAD) for non-aberrated and aberrated data... 73
C. 3 Spatial covariance across the array using fullword SAD and one-bit SAD... ... 74
D. l Beamforming scheme employing parallel phase delay adjustment in subbands of Rl·^ signals... 76
D.2 RF Subbands... 77
List o f T ables
2.1 3.1 3.2
4.1
Sound pcirameter.s in dilFerouit ti,ssues... (j Powers of 2 for 1\ and 8 - 1 \ ... 14 PSl' beainwidtlis normalized Ity (,he ultrasound wavelength. hWHM beiunwidth corresponds to -6 dB beamwidtli... 19 RMS error between the estimated and actual aberration patterns
(unit: fraction of a wavehuigtli). 35
C h a p ter 1
In tr o d u c tio n
Phased-array ultrasound imaging techniques have l)een extensively used in modern medicine for di;ignostic purposes. In reconstruction of phased array ultrasound images, short bursts of ultrasound are transmitted, and echoes reflected from internal stnicturcs of body are received by a phased an-ay transducer. The planar cross-section which is to be imaged is scanned by electronically steering and focusing the array both in transmit and receive modes [1, 2, 3, 4]. The signa.l processing involved in focusing a.nd steering is called as the heamforming [.5, G].
Much of the recent increase in use of diagnostic ultrasonic ima.ging de])ends on improvements ii\ image quality. New digital imaging systems coming into use hold the promise to further enhance the image quality. The flexibility inherent in digital imaging systems enables the' designers to use a. wide range of algoi'ithms to reconstruct, enhance, and analyze i.ltrasonic images [7, 8, 9, 10, 11, 12]. Critical to any digital ultrasonic imaging system is the front-end hardware consisting of transmit and receive Ireamforming electronics (Fig 1.1). Although imaging capabilities can be augmented by digital processing techniques, the front-cuid hardware often sets the system |)erfoi'inanc(i limits.
H,('.a.l-tinu' phasc'd a.rra.y ultrasound la'ainioi'ining involv(rs signiiicant amount of electronic, signal processing at vidc'o rates. Transmit beamforming is ])erformed at evei'}^ scan angle wheri'as rccci\'('. b.eamforming is dynamica.lly relocated for
Chapter 1. Introduction
F ig u re 1. 1: Block diagram of a ultrasound imaging system.
every image point. Design of the transmit beamforming electronics is relatively easy, since ea.ch array element can be fired by sim])le timing circuitry, while design of the receive beamforming circuitry is an involved task and have been subject of considerable research [13, 14, 15] Analog receive bea.n).forrning hardware is bulky and expensive [16, 17]. R<',cent developments in digital integrated circuit technology motivates rescxu'cli on advanced digital beamforming techniques based on special purpose VLSI circuits [14]. In design of such circuits, care must be given to the beamforming algorithm performance which critically affects image resolution [18], and on the feasibility of algorithm for VLSI implementation [19]. In this study, we consider three major problems in beamforming; delay (iuanti7,a.tion, receive focusing used for image reconstruction, and phase aberration. We proj)ose new digital beand'orming schemes, and present VLSI circuits for their reaIiza.tions.
Delay quantization has a significant undesired eifect on the transmit and receive responses of the system, whicli results in an increase in the side lobe
Cba])lcr 1. IntroclucUon
levels ol the array response [20, 21, 22, 23]. Accuracy of timing information used in beamforming can be increased using fast analog to digital converters (ADC), with relatively high cost. It can be also solved by employing digital upsampling techniques. Since tlie timing accuracy in l^eamforming is much more critical than the amplitude accuracy, as a cost-effective solution for high timing accuracy in beamiorming, a linear interpolation scheme with coefficients in discrete powers- of-two space [24] is examined.
In conventional ultrasound inurging, receive beamforming is carried out at the radial focal points. The radial data is converted to the raster data which correspond to the display pixels in rectangular coordinates. The conversion process, called scmi conversion [6, 25], imposes a significant hardware overhead and may degrade the imcige quality. To eliminate the scan conversion, an alternative digital beamforming sclieme leased on receive focusing at the raster points is proposed.
Computation of the timing information required for the beamforming is based on the assumption that the image plane is composed of the uniform soft tissue. This assumption, however, is not valid in general, cind causes significant phase errors [26, 27], and hence degradation in image resolution. The' solution of this problem involves phase error correction using an adaptive beamforming technique. The algoritlim used for this purpose must be computationally efficient for real-time applications. As a solution to this problem, we study a phase alierration correction techiiiciue with very low computational com])lexity, liased on the time delà}' estimation via minimization of the sum of absolute differences between the samples of radio frequency (RF) echo signals of adjacent array elements.
For the interpolation, beamforming, ami ])ha,se aberration estimation, we also propose the digital hardware arcliitectures and ])resent their implementations using full-custom CMOS VLSI design techniques.
Organization of this dissertation is as follows. In the next chapter, fundamentals of ultrasound inuiging are briefly reviewed. Cha.])ter 3 covers tlie front-end hardware architecture', reduction of delay cjuantization errors, and
Chapter 1. Introduction
beainfoniiing at raster local points with the performance analysis. Hardware structures for the inter])olator and digital beamformer are also presented. Phase aberration problem is studied in Clia])ter 4. ddie proposed phase correction technic[ues and the ])erformance analysis are ])resented. (Chapter 4 also includes desciiption of the VLSI architectuj'es lor phase estimation. VLSI implementation of the interpolator, digita.1 bea.mlormer, and ])hase estimator are presented in Chapter 5. hinally, the j*esults, conclusions, and further studies are outlined in Chapter 6.
C h a p ter 2
B a sics o f U ltra so u n d Im a g in g
Main purpose of medical imaging is to observe the interned structures of the body noninvasively. Medical imaging methods are based on the illumination of the tissue by some form of radiation, and reconstruction of the image from the received radiation energy caused by interaction of the transmitted energy with the tissue by means of reflection, absorption, or sc¿ıttering. In medical imaging applications, various forms of radiation, such a.s soitui iiuchuir particles, X-rays, electric fields, and ultrasound waves have Ireeu used for many years. In general, each form of radiation ro^sults in imaging of different characteristics of tissue.
Ultrasound is a term used for sound which have frequency above the range, of human hearing. Ultrasound waves ai'e used for re|)resentation of the mechanical pro])erties ol tissue (such as density and elasticity). This fea.tureof the ultrasound waves makes ultrasound iimiging complementary to other dia.gnostic tools [2, 28]. On the other hand, the clinical exa.minations have shown that ultrasound waves have no harmful biological side effect on the tissue [29]. In addition, ultrasound imaging can l)e performed a.t I’cud-time rates. This (uiabh'.s observation of the fast moving structures such a,s the heart. Furthermore, because of the small-sized and flexible structures of the ultrasound imaging tools, they can be easily handled and used to image any part of the body. As a resvdt of these, ultrasomul have been widely used as a dia,gnostic tool for iimiging of ca.rdiac structurcas, vascular systcun, abdominal organs, eye, etc.
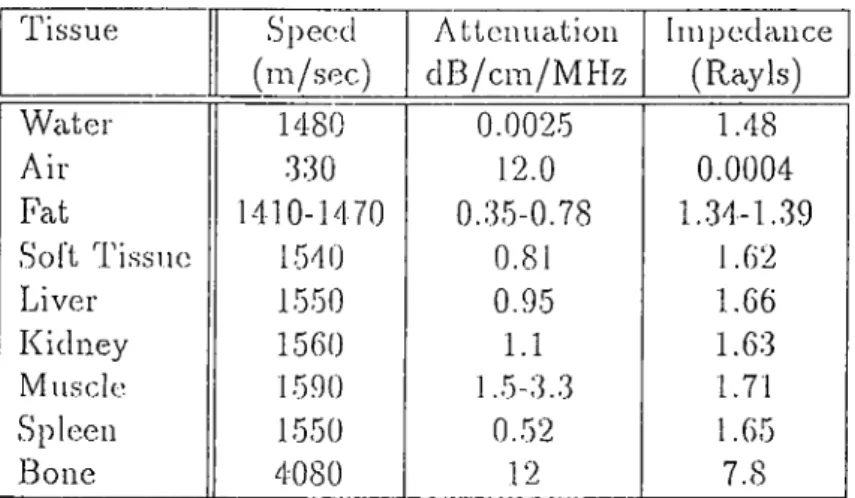
Chapter 2. Betsies of Ultrasound Imaging Tissue Speed (m/sec) Attenuation dB/cm/M Hz Impedance (Ray Is) Water 1480 0.0025 1.48 Ail- 330 12.0 0.0004 Fat 1410-1470 0.35-0.78 1.34-1.39 Soft Tissue 1540 0.81 1.62 Liver 1550 0.95 1.66 Kidney 1560 1.1 1.63 Muscle 1590 1.5-3.3 1.71 Spleen 1550 0.52 1.65 Bone 4080 12 7.8
Table 2.1: Sound |/ara.mc(.orH in diH'ereni iis,snei>.
In pulsoccho (r<dl(.’:c.l,ion) modo ul(,ra..sonnd imaging, an idt,i'a.sound pulse composed of a few cycles is transmitted into tlie tissue, and the reflected waves are received. R.eQection depends on the characteristic acoustic irnjiedance of the tissue: impedance mismatch results in reflection. This allows to image the organ boundaries since generally dilhu'cid. tissues have', varying charactei'istic acoustic impedance [2] (Table 2.1).
In transmission and receiption of the ultrasound pulses, piezoelectric transducers are used. Piezoelectric material is a polycrystalline ceramic that converts electrical signals to acoustic waves and vice versa. In ultrasound imaging, transducers are directly ]:>laced on the skin s\irbice.
2.1
P h a s e d A r r a y B e a m fo r m in g
A linear phased array consists of a number of transducer elements aligned side by side on a straight line [3, 30]. Ad an-ay elements are active both in transmit and receive modes. Ultrasound signals transmitted or received from the array elements can be steered at a diiajction and Iocus(hI ¿it a point in that direction fry adjusting element delay timois to compensa.tc the different round-trip times. In
Chapter 2. Basics of Ultrasound hmiging
F ig u re 2 .1: Symbolic rc))res(.:nf,ations of analog and digital rccodve heamforming schemes.
nltrasonnd imaging, beand'orming is Inuidled electronica.lly using a phasefl arra.y with variable delays (Fig. 2.1).
The scanning of the image ])lane is ¿ichieved by means of the transmit and receive beamforming operations. Transmit beamforming is achieved by sending appropriately dehiyed ionises while the receive beamforming is performed by properly delaying the received signals and summing them (Fig. 2.1). The transmit beamforming operation is carried out at each direction (i.e., per scan angle) while the receive beamforming is j^erforraed at each image sample point, which is called dynamic focusing.
Chapter 2. Basics of Ultrasound Imaging
SCAN A R C S C A N
S liC'l'O R S C A N C O M J> O U N D S C A N
F ig u re 2.2 : Sca.nning technique.^ in ultrasound imaging.
2 .2
B - M o d e S e c to r I m a g in g
The most common ty])e. of ultra.sonnd imaging is the pulse-echo brightness mode scanning, called B-mode (also called B-scan) which provides a two dimensional cross sectional reflection image of the scanned tissue. A B-scan image is formed by sweeping a narrow pencil beam through a plane, and received signals from the sample points lying on the beam are mapped on an image corresponding to the place of beam on the plane. The next beam is send to another portion of the plane after a time delay required for the previous beam round trip. This is repeated for all portions of the plane, and complete image of the region is obtained [4, 6].
The scanning of an imaging region is performed mainly in four ways (see Fig. 2.2). Thoise are linear, sector, arc, and compound sccinning [2]. Generali}^ the linear, sector, and conqmund scanning are performed by means of electronic
Chapter 2. Basics of Ultrasound Imaging
F ig u re 2.3: Pliasecl array sector scanning.
scanning systems whereas the arc scanning is usually performed by mechanical scanning systems. In the sector scanning technique, the image plane is scanned in a sector format by steering the ultrasound beam in discrete angles within the sector (Fig. 2.3). Reconstruction of the sector image is achieved by performing receive focusing at each sam].)le point lying on the axis of transmitted beam. Since the sector is scanned by means of the electronic beam steering, the physical aperture size of the transducer phased array is smaller compared to other scanner types, that allows observation of anatomic structures through restricted acoustic windows. As a result of this, sector scanners are widely used in medical imaging, especially in the cardiological diagnosis.
B-mode ultrasound sector imaging is based on the principle that only one sound pulse should be propagating in the field being scanned at any time. Hence, once a pulse is transmitted, the next pulse must be sent after the time required for round-trip of the previous pulse. This fact imposes a constraint for real-time systems such that [Frame Rate) x [Sector Radius) x [No. o f Scan Lines) =
Chapter 2. Basics of Ultrasound Imaging 10
c/2. As a result oi this, ior a typical real-time imaging system with with 30 frames/sec and 128 scan lines, the processing time per scimple is about 250 nsec.
2 .3
U ltr a s o u n d Im a g e R e s o lu tio n
Resolution of the ultrasound imago is a measure of its ability to separate closely spaced individual structures. The resolution of an ultrasound imaging system depends on the shape of the ultrasound beam which is controlled by transducer array element s])acing, number of elements, element weighting, pulse waveform, and the receiver response [31, 13, 21]. The axial resolution is mainly d(;t('.rmined by tlui idtrasoiiiid pulse; wav(;form (i.e;., its freciiiency and |;uls(.; width) whereas the lateral resolution is closely related to the beamwidth (i.e., array size, element spacing, frequency and apodization). Most commonly used measures for ultrasound resolution are “full-width ha.lf-ma.ximum” (FWHM), equivalently -6 dB, and -3 dB beamwidths [1].
Intensity of ultrasound |)ulse transmitted into the tissue is attenuated linearly proportional to the distance. While the attenuation increases with frequency thus limiting the penetration dej^th, tlie image resolution is directly proportional to the ultrasound Irequency. Hence, the selection of depth and resolution of the image is a trculeofl in ultrasound imaging. In the applications, different frequencies are used for imaging of structures with various depth; 2.5-3.5 MHz for d<;ep abdominal imaging, 5 MHz for imaging of organs near the surface and pediatric work, and 5-15 MHz for imaging of thyroid, testicles, periplieral vascular vessels, and eye.
Ultrasound image quality is critically a;ffected by various factors such as quantizcRion errors, scan-conversion process, phase al)erration, inoperable array elements, and specular interference [18]. Enhancement of information content in ultrasonic images necessitates elimination or reduction of such quality limiting factors [32]. The first three problems are considered in detail throughout this study wliereas the last two problems aia; briefly discussed and addres.sefl as the further re,search issues.
C h a p ter 3
D ig ita l B ea m fo rm in g
3.1
P r o n t-E n d A r c h ite c tu r e
In phased array digital receive beamforining, RF echo signals received by the phased array elements arc sampled using ADC’s and then all signal processing operations are handled by digital electronics. An architecture showing the processing units for the digital f-ont-end is depicted in Fig. 3.1. The timing accuracy in beamforming and in phase aberration correction is increased by upsampling. The phase aberration estimation is performed on the sampled data and then it is used to correct the beamforming timing computed for the receive focal points and transmit focus. The resampling process ])rior to beamforming is required to select the samples coi'responding to the focal point. Finally, the samples corresponding to the focal point are synchronized and added to com])lete the beamforming. The signal value corresponding to the focal point is obtained at the output of the beamformer unit. Tlie main difFiculty in realization of this front-end is the requirement of relatively high sampling rate. In the following section, we discuss digital upsampling schemes to overcome this difficulty.
Chapter 3. Digital Beanifonning 12 PHASED ARRAY ADC SAMPLING UPSAMPLING PHASE ABERRATION DEIECTION RESAMI^LING FOR FOCUSING FOCUS DELAYS SYNCHRONIZATION AND ADDITION
OUTPUT DAT'A FOR FOCAL POINTS
F ig u re 3.1: Digital re.ceive front-end architecture.
3 .2
R e d u c t io n o f D e la y Q u a n tiz a tio n E rror
The amplitude qucuitization arising from the finite word length of analog to digital converters, reduces the dynamic range of the image signal [21, 33]. For pulse echo imaging, an 8-bit am|)litude ¡•esolution is adequate whereas flow imaging applications require about 12-hit amplitude resolution [28]. These amplitude requirements are already met by the present ADC circuits. On the other hand, the delay qvuintization has a significant undesired effect on the tra.nsmit and receive responses of the system [20, 21, 22, 23]. The dela.y quantization results in an increase in the side lobe levels of the array response. Since the delay quantization is the most significant quantization error source, the major limitation in the digital front-end architectures is the timing accuracy, i.e., sampling rate of ADC’s. As a general rule, a maximum phase error of tt/4 is tolerable for ]3hase array
Chapter 3. Digital Beawforming 13
In recil-tiine imaging, accuracy of timing information used in beamforming based on the delay and sum, can be increased using fast ADC’s with relatively high cost [34]. The sampling rate can be increased using baseband demodulation or bandpass interpolation techniques [35, 36, 37, 38, 14]. The realization of the former technique requires mixing and lowpass filtering, while the later requires only interpolation (zero padding and filtering). For the bandpass interpolation, to decrease the cost, oiu^ can employ Z(U'0 pa.dding on ea.ch channel signal before beamforming, and tlie interi)oIation filtering after beamforming [35, 36]. However, this scheme is not applicable for adaptive becimforming where the phase aberration correction is enq^loyed. Since the level of time quantization is much more critical than the level of the amplitude quantization [21, 23], a simple upsampling scheme such as a linear interpolation can employed as a cost-effective solution to increase the timing accuracy.
3.2.1
In terp o la tio n S ch em e
In the linear interpolation, a new sample, point C, between two existing sample points, A and B, ca.n Ixi int('rpola.te(l a.s
7\A + - 7\)B
C (8.1)
where T\ and are the temporal distances between (7 and 7?, and A and B, respectively. For hardware realization, this expression can be further simplified by expressing the coefFicients Ti and T2 in the sum of powers-of-two form [24]. To do that we need to quantize 1\ and 7T Eight equidistant interpolation points in each sam])ling interval, T2 = 8, is tolerable for both the beamforming and pliase aberration correction [30, 2.3]. Coefnc.icnts T\ and T2 can be exj)ressed a.s
7’i = ‘F ‘ -I- ( - 1)’'' 2''‘ 72 = 2'’^ + (3.2) where pi, c/i, .Si, p2, <72, and .Si are non-negative integer numbers depicted in Table 3.1. As a result, the realization of the interpolation is reduced to three shift and three addition operations.
Chapter 3. Digital Beamforming 14 ]h </l •^'1 P2 </■2 *'^2 0 0 0 1 2 2 0 1 1 0 1 3 0 1 2 0 0 0 2 1 0 3 1 0 0 2 0 0 ■1 1 1 0 1 1 0 5 2 0 0 i 0 0 (j 2 1 0 0 0 0 7 3 0 1 1 0 1
T able 3.1: Powers of 2 for and 8 — T’l.
3.2.2 H ardw are S tru ctu re for In terp o la to r
The hardware structure sliown in 3.2 is developed for the linear interpolation scheme. It takes two input samples, /1, and B, and the value of time distance to the point at which the interpolation will be performed. It generates the interpolated sample, as its output. The power coefficients for representation of Ti and T-2 — Ti, are generated l)y decoding 7\. The resultant signals, p i, c/i, •5i, P'2, (¡2·, «'-’'><'1 c'-i'e used as the control signals for “shift left” operations on the input samples. Then, the ap|U'opria.tel}' shifted versions of ea.ch sample are added to realize the multiplications,
7\A = (2'^' + (-1)^^2''*)/1 (T i - 7 \) B = (2'''^ + ( - 1 ) " ^ 2 « ) T (3.3)
Then, the interpolated sample is obtained b}' adding these two results cuid performing a shift right operation on the output.. The interpolator scheme is designed in five pipelined levcds to achieve a high throughput.
3 .3
B e a m fo r m in g at R a s te r F o c a l P o in ts
In conventional |)hased ai*i-a.y nltrasoniul imaging, tlie i*aclial data are converted to the rcister format using digital .scan-conversion techniques [25]. A typical digital scan converter maps the radial data to the nearest disj.day pixel.
Chcipter 3. Digital Beam forming 15
F ig u re 3.2: Hardwan^ structure of the linear interpolator.
This corresponds to the quantization of the radial coordinates to the nearest rectangular coordinates (see Fig. 3.3), where the data is forced into alignment with the display grid. Thus, it results in cin annoying artifact called Moire pattern which is a well-defined pattern of hoh-rs in tlie ima.ge corresponding to the unaddressed pixels. Artifacts can be decrccised by using two dimensioned interpolation techniques [39, 34]. flowever, this significantly increases the computational cost of the scan conversion process.
The conversion process can Ire completely eliminated by performing the receive beanrforming operations directly at the raster focal points of the imaging plane instead of the radial focal poiiits [40, 41]. Image reconstruction at the raster sample points can be accomplished by forming transmit beams at unequal angles so that raster points lie on the beam axis, and sanqrle unequally in time along the beam that correrspond to raster lines. However, amount of time to form all these tra,nsrnit Ireams is too long for rea.l-tirne imaging.
Chapter 3. Digital Beamforining 16 4 0 ·. ...+ / 4 - - 1-Q + / - 4 V · · -- 4 d b ... Ч -/ 4 - "■■■■■■0 . 0 + " " p .... .*'4 “ X / и - / ■···' - 1-Q r a d ia l - | — r a st e rро ю т
l i g u r e 3.3: l{,adial and raster iocal ])oiiits.
sample the Ьозаш at tlie times correspoDding to the raster focal points witliiii the scan angle. Го do this, the timing data required for the receive be^mforming must be computed for evei\y I'aster local point at every scan angle within the sector. Since the number of raster points in the sector is about 2.5 times the number of radial points, the number ot receive beamforming operations increases by the same amount, this is a major reason why the many phased array systems have employed beamforming at the radial focal points, it is not a limitation for synthetic aperture imaging schemes [38], but tlie synthetic aperture imaging technique is not preferred in medir-.al imaging because of the SNR and real time operation requirements. In phased array imaging at the raster points, the computational overhead due to the increased beamforming operations can be effectively handled by employing digital bea.mforming schemes.
Chapter 3. Digital Beanironriing 17
3.3.1
P erform an ce A n a ly sis
For the analysis of the beaintonniiig at radial and raster focal points, the point spread functions (PSF) cind sector images of ¿in ultrasound resolution phantom are obtained and compared. The PSF’s are formed by means of computer simulation whereas the phantom images are reconstructed by digital processing of an experimental RF data set acquired from a tissue-mimicking resolution phantom.
P S F S1MULATION.S
Various computer simulation models (or ultrasound imaging, that involve involve complex computations lor simulation of system and tissue parameters, have been investigated [42, 43]. For the PSF simula-tions, because of the computer run time requirements, we use a simple simulation model in which the attenuation and cylindrical spreading effect are not included. In the simulations, overall sample value of the signal corresponding to the receive focal point (;>,</), •s{p,q), is obtained as
N N
•K/h <7) = ^ b b j) /?·("■, k, p, (¡) - /.„(7i, k, i j ) ) 71=1 k=.\ i^j
(.3.4) where, N is the number of array elements, xvi is the apodization coefficient, 6'(.) is the element factor, 7?,(.) is the reflectivity coefficient, P{.) is the transmitted ultra.sound pulse, is the sam|)ling time, and /,.,·(.) is the round-trip time including the transmit delay. In the above expression, the summation over i and j represents the specular contributions of whole field, whereas the summations with index k and n corres])ond to the transmit and receive processes.
The ultrasound pulse, for each element is assumed to be identical and in the lorm of a Gaussian pulse expresscxl as
_ ^,-(i/27'o)^^p27r/oi (3..5) where /0 and 7q are the ultrasound (Vc'-ciuoncy and period, res])ectively.
Chapter 3. Digital Beamfonning 18
ARRAY NORMAL
(i.j)
F ig u re 3.4: Geometrical confguration for the simulation parameters. Since the cirray element i.s not a |)oiiit source, and has a finite size, the element transmit/receive response is directional. This is represented a.s [44]
7гsın(7(7?.,г,;))
where ’y[n, i , j) is the angle betwojeu element normal and the line joining the center of element and the scattering point {i,j) (see Fig. 3.4). Here, the element size is assumed to be half of a wavelength.
PSF tor the point reflector loca.ted at (io^jo)·, the reflectivity
(3.7) To obtain the
function can be expres.sed as:
B(n, k, i , j) = S{i - io,j - jo)c()s{0{n, A:, ■io,.^))
where the i(.) is the Kronecker delta, function and the 0{.) is the scattering angle used to represent the s|)ecidar reflectivity (see Fig. 3.4). d'lie other simulation parameters are as follows: N 128 , the number of scan-.slices/90°-sector is 128, and the time is (|uantized by 7o/8.
The PSF’s obtained by beamforming a.t the radial and raster points are shown in Fig. 3..h whei'C' each figui'e (h'picts two dimensional <listribution of the
Chapter 3. Digital Beamfovming 19
F ig u re 3.5: Normalized PSF magnitude. The PSF’s in the first and second rows are obtained by beamforming at radial and raster focal points, respectively. The PSF at the first, second and third columns correspond to the point reflectors located at 2D, 4Z), and 6D away from the array, respectively.
Distance (2D) (4D) (6D)
- dB 6 10 40 6 20 40 6 20 40
Radial 4 10 20 4 12 20 12 22 30
Raster 4 8 18 4 8 16 8 12 26
T able 3.2: PSF beamwidths normalized by the ultrasound wavelength. FWHM beamwidth corresponds to -6 dB beamwidth.
Chapter 3. Digital Beamforming 20
F ig u re 3.6; Received experimental RF wavefronts across the array. The vertical cind horizontal widths of each row correspond to the aperture size and time interval of 512 samples, respectively. The first, second, third and fourth rows show the samples between 1-512, 513-1024, 1025-1536, 1537-2048, respectively. wavelength. The beam-widths comparisons of PSF’s are given in the Table 3.2. In the PSF simulations, transmit focal length is fixed to 6T>, where D is the aperture size of the array, and the point reflector is located at 2D, 4D, and 6D away from the array, placed on the axis normal to the array. For the iipodization of array, Blackman and rectangular windows are used at transmit and receive modes, respectively.
The PSF’s shown in Fig. 3.5 and the Table 3.2 indicate that the resolution obtained by beamforming at the raster sample points is better than that beamforming at the radial sample points.
R e c o n s t r u c t i o n o f t h e P h a n t o m Im a g e s
To compare the image qualities of receive beamforming at the radial and raster focal points, the sector images of the standard graphite-gel AIUM image resolution phantom are reconstructed using the two beamforming techniques.
Chapier 3. Digital Beamforming 21
R J F S A i v t P L l S S RJF S/VivtPLES
rrvi/\oH pi:>cHLs
livI/\OE P1>GBES
F ig u re 3.7: Digital processing steps foi· Ireamfomiing at radial and raster points. The actual RF data set^ was ac<piired from the phantom with a conventional 64-clement i)hascd array transtlucer opc'rating at 3.3 MIT/, [45, 46]. The data acquisition was carried out through the synthetic aperture scheme such that all of the RF A-scans were recoi'ded for every possible combinations of transmitter and receiver elements. Each A-scan was digitized after appropriate time gain compensation at a sampling rate of 17.76 MHz with 10-bit analog to digital conversion. The data file occupies alrout a 34 Mega bytes of storage in the computer memory. Fig. 3.6 depicts the received wavefronts across the array where a portion of the RF data set is shown for a particular transmit beam forming at a scan angle normal to the array aperture.
Image reconstruction is carried out by digitally processing the recorded synthetic aperture data to emulate the operation ol a reci.l-time digital imaging
Chapter 3. Digital Beamforming 22
system. The sampling rate of RF data is increased further by 8 times using the linear interpolation scheme discussed previously, and the quadrature signal components are generated. The digital processing schemes for becimforming at ladial and raster points are outlined in Fig. 8.7. The beamforming is performed using timing data computed lor radial and raster receive focal points. The envelope detection is realized by taking tlie square root of the sum of the squares of in-phase and quadrature samples. The scan conversion which is employed in beamforming at the rcidial points, is realized using a first order two dimensional interpolation tecliniqne ])resented in ['19]. This interpola.tion scheme is also depicted in big. 3.8. Finally, a ])urely logarithmic compression is applied on the images to obtain a 60 dI3 dynamic range.
In the image reconstruction, the separation of the raster and radial focal points a.re chosen to be Ao/2 = 0.23 inrn. TIk^ number of scan-slic('s/90"-sector is 128. The images consist of 512x 512 pixels (Fig. 3.9). The transmit focal length is fixed at 80 mm away (I’om the ai*ray, which corres|)onds to the [position of the point reflector at center of the sector. It is observed from these images that the image obtained by beamlorming at radial points is blurred due to the scan conversion. A detectable resolution im])rovement is achieved by em])loying the receive beamforming at the raster focal points.
Clmpicr 3. Digital Beamformiiig 2 3
E=d2xA/((ll+d2)+(llxB/((il+(l2)
F=d2xD/(dl+d2)+dlxC/(dl4d2)
G=h2xE/(lil+li2)+hlxF/(lil+li2)
Chapter 3. Digital Beamforming 24 »S'' s ^SSS^iVVWV - sxs ,,^s>XvX:3;^ O % XWv. ^ ' ·■■ /fTix ; \ ' 'I ·'
^ '■vss'· \Cii'•’•'«Si^'-'-'sv*«· i-iy^'· XvN.*· iv«^' 'x '
F ig u re 3.9: Ultrasound sector images of the standard graphite-gel AIUM resolution phantom. The top and bottom images are reconstructed by receive I^eamforming at radial and raster points, respectively, through the digital processing steps depicted in Fig. 3.7.
Chapter 3. Digital Beamforming 25
3.3.2
H ardw are S tru ctu re for D ig ita l B eam form er
In digital receive beamforming, the samples corresponding to a focal point are not synchronous. In order to find the signal value of a focal point, the samples must be suitably delayed and then added. This requires coherent addition of signals received by the array elements. However, a simple synchronization scheme designed for a regula,r data flow structure can not solve the synchronization problem in receive beamforming for sector ima.ging. This is due to the fact that the arrival time pattern ol samj^les varies depending on the location of focal point within the sector.
In a straightforward approach, a “global” coherent summation scheme can be employed by using FIFO type registers at the adder front-end [47, 14, 48, 23]: the samples from all channels are stacked in FIFO registers at each channel for synchronization, and then the synchronized data corresponding to a focal point arc added to obtain the hcamformer output. However, since the FIFO and adder sizes increase dramatically with the number array of elements, the scheme is not very feasible for implementation at the board level or in VLSI. Alternatively, the samples can be added recursively using j)artial sum registers [34]. But this technique is not particularly practical, because of the adder speed requirement.
An efficient receive beamforming hardware structure can be obtained by employing a “local” colierent addition technique where the total coherent summation of all samples corresponding to a focal point is obtained by a sequence of pairwise partial coherent summations [49, 50, 51]. For an N channel system, at lirst, N/ 2 partial coherent summations are obtained. Then, adjacent pairs of these partial sums are ..coherently added resulting in A^/4 new partial coherent sums. This ])rocedure is repeated until the number of new ])artial coherent sums luicomes unity, which is the total colierent summations of all samj^k'.s. This approach results in an inverse binary tree like architecture for receive beamformer. For an N clement array, the network consists of lo(j2{N) stages, and A;’th stage has N¡2^ [k — 1, 2, ..., lo(j2{N)) processing units (see Fig. 3.10).
Eacli unit consists of P'lFO registers and a. full cidder for coherent summation of its two input data. I'dFO lengtl' I'o'' sta.ge is different; since there is
Chcipter 3. Digital Bearn [or ming 26
I^lFO
LENGTH INPUT DA^'A
15
28
SINGLE Cl IIP COHERENT SUM
F ig u re 3.10: Architecture of the beamfonner.
no regularit)^ in the arrival times of the signals corresponding to clifFerent focal points, the worst case FlhT) lengths for the stages are determined hy means of tlie computer simulation of the pliased arra}^ imaging system with a 90^' sector scanning.
The processing unit ta,kes two input data, A and /J, along with two status bits, S A and SB^ and generates the coherent summation of the inputs, D(9, with a corresponding output status bit, SO (Fig. 3.11). Each status bit indicates that the da.ta is va.lid. For a. r(TiaJ)l(^ ri^a.l-tiiiu'. o|)('.ra,tion, the unit is desigiu'd ¡n three pipelined stages : cross switch, FIFO, and adder stages. The cross switch is a finite state machine which feeds the earlier of the in])uts, A or B, to the
Chapter 3. Digital Beam forming 27
.sul).s('.cju('iil FIFO. An,('r syiidii-oiiizalioii 1)}^ FlI^X), \.]\e dala, arc fed lo llu'. full adder. The unit is reset by an external reset signal (/?) at the beginning of operation so that cross switch and l^dFO ])ointers are set appropriately. Two non-overlapping clocks {('/)[ and (/)■)] are used to control the pipelined o])erations and data flow.
3 .4
C o n c lu d in g R e m a r k s
To reduc-e tlie delaj' quantization errors in beamforming by delay and sum operations, a cost eifective upsampling scheme based on bandpass linear interpolation is presented together with its hardware structure.
By means of the simulated P.SF’s and the seetDr images of the phantom reconstructed from the experimental data, it is found that image reconstruction
Chapter 3. Digital Beamforming 28
by employing receive beanifonning at the raster sample points results in a higher resolution compared to that for the radial sample points.
Beamforming directly at the raster points is not easy to realize in hardware due to increased iocusing operations. Dynamic focusing to the raster points employing the digital iieamforming schemes can he best implemented using special-purpose hardware structures [49, .52].
VIjiSI im])lementation o( the proposed lieamformer structure for large M is not very leasible because ol the large chij) area and large number of I/O ’s. The modula.rity of the: structure ca.n be; ('mployivl ('ffec.tively, however, by proper choice ol IThO sizes, and by using tlui beamlormer chi])s with a reasonably small N [50].
C h a p ter 4
P h a se A b erra tio n C o rrectio n
4 .1
I n tr o d u c tio n
Phased array ultrasound sector images are reconstructed by employing beam- forming operations both in transm ifand r(;ceive modes, ddming considerations for beamforming are usually based on the assumption of constant sound velocity throughout the body. However, this assumption is not valid in general since the sound velocity varies in different tissues. For example, the velocity of sound is about 1440 m/s and 1560 m/s in fat and kidney, respectively, while it Is 1540 in/s in soft tissue (Table 2.1). Changes in sound velocity, especially in the near field, cause significant jjliase errors in beamforming (I'hg. 4.1). Measurement of the l)hase aberration and its effects on the image c|iiality have been investigated experimentally [26, 27]. The image C(ua.lity is critically affected 1)3' these phase errors which result in increased side lol)cs, degradation in resolution, a.nd geometrical distortion (Fig. 4.2).
Ill medical ultrasound imaging, the relative |)lia.se errors in adjacent elements are in the form of |)crturl)ation and generally less tlian 7r/4. 'J'he ])hase aberra.tiou liecomes a significant problem in imaging with relatively higli freciuency ultrasound, since the pha.se errors due to the aberration increases as the Ccirrier frequency increases. For exam])le, a pha.se aberrator causing a. relative flight time difference of 40 nsec in adjacent elements results in a 0.1 Aq, 0.2 Aq,
Chapter 4. Phase Aberration Correctifion 30 I OCA I. m i NT V .SOUND VHLOCITY VI ADl-RRA’riNG lAYFiR S gi ^ S
U Q
VARIAI3LEDELAYS PO iriT irr SIGNAL
F ig u re 4.1: Symbolic representation of the phase aberration in receive beainforming.
and 0.4 Ao phase shifts in 2.5 MHz, 5 MHz and in 10 MHz, respectively.
To insure optimal imaging, jrhase errors must be estimated and corrected adaptively in real-time. Use of a beacon signal for phase estimation, a conventional method in many cohei'ent imaging systems [53], ma.y not be j)ossible in noninvasive medical -imciging a.].'}dications. This is because a point like target may not exist at every imaging plane of the body. Ihnice, a. i)ractical im'.thod must generate accurate estimates of phase errors using Hie signals from line targets and/or diffuse scatterers.
Phase aberration cori'ection methods have been reported for a nonuuiform aberrating layer with a deterministic target [54, 55], and for a uniform aberrating layer with a priori inf,irmatiou about the layer thickness [56]. For nonuniform aberrating structures with random leflcctor distributions, various lihase, correction tecliniqiu's have Ikhmi I'cpoi'tc'd which are based on tlu' cross
ChcLptev 4. Phase Aberration Correction 31
1ATITRAL DIMENSION (PI/256)
F ig u re 4.2: F/fFect of the plia.se aberration on PSF.
correlation lietween the sampled H.l'^ signals of adjacent elements [4.5, '46, 57, 58], on the maximization of the speckle brightness [59, 60, 61], and on the time reversal mirror [62, 63, 64]. Computational complexity of each of these schemes is relatively high for real-time imaging. Recently, two-dimensional phase aberration correction studies have been reported [65, 66, 57] which were extended versions of the one-dimensional correction schemes. Also, there exist time delay estimation techniques [68, 69, 70, 71] which involve extensive computations, and hence are more suitable for olf-line phase correction. For real-time ultrasound imaging, however, the com])utational efliciency of the correction algorithm is crucial.
In this study, we present an alternative pliase aberration correction technique with low com])utational complexity. 4’he relative'. i>hase errors of adjacent arra.y channels are estimated effectively through minimization of the sum of absolute differences (SAD) between two R.F sam])les. In order to increase the accuracy and
Chcipter 4. Phase Ahernition Correction 32
convergence perfonnance ol the SAD technique, we employ weighted averaging of estimated patterns over a. number oi scan angles, ddie weighting coefficient for each angle is chosen ¿is the ¿ivercige rruignitude of the echo signed received at this cuigle. To incr('.cis(^ tlu' computa.tioiial <'.(liri('iicy of the techiiiciue fiii'ther, the word length is truncated to one bit.
4 .2
T e c h n iq u e
4.2.1
A pproach
SAD is used as a cost function in minimization problems because of its low computational complexity. It has boien used as the alternative to the correlation and successfully applied for the image registration [72], pitch detection [73], flow
and m o t i o n i m a . g i n g [74], a n d f o r l.lu' n o n - l i n e a r f i l t ( ' . ri ng [7r), 76].
We employ SAD for estimation of the relative phase difference between two sampled RF signals [51, 77]. SAD of Rl’ echo sam])les received from adjacent array channels, over a time window of length M, is expr<;ssed as a function of shift index , as
M
<('';.) = E i » : . y ) - I (4.1) k=i
where is the k'th sam])le of the 7?.’th element’s sigiial at the f’tli scan angle. I ’ypically, and ,s'h_, (.) are apiu'oximately shifted versions of each other. The value of which minimizes this ex]')ression coi'responds to the relative phase shift, and is found for every n and i (see Fig. 4.3). The relative aberration delay for the îi’th element at the i ’th scan angle, ar^, is giyen by
< = T . i i - l L (4.2)
where is the sampling period, and 7], is the relative focusing delay. The aberration delay time, r,( for the ?).’th element at the Tth scan angle is the cumulative summation of the relative aberration dela.ys:
.?=1
Chapter 4. Phase. Aberration Correction 33
SHIFT INDEX
F ig u re 4.3: SAD and cross correlation of two sampled RF signals.
Analysis of the sensitivity of SAD to the relative phcise, the accuracy of time delay estimation using SAD and correlation, and the spatial covariance of Rl·’ signals across the array measured with SAD and correlation are presented in the Appendices A, B, and C, respectively.
4.2.2
A veragin g o f P h a se E stim a te s
Time delay estimation using simple SAD minimization can be used to measure phase distortions due to nonuniform aberrating layers. However, scatterers in the direction of sidelobes may also contribute to phase errors, which are referred to as phase aberratioi] due to the “m-iltipath and scattering” [78]. Depending on the scatterer distril)ution over the isoplanatic patch where the phase estimation is carried out, the effect of multipath and scattering may not cancel out, resulting in focusing errors. Such phase enors may affect the accuracy and convergence
Chapter 4. Phase Aberration Ccr^'ectioπ 34
F ig u re 4.4: Window conriguration used for two dimensional SAD minimization. performance of the aberration estiniation. In order to reduce these errors, the estimation can be perforimul ovc'.r a latc'.ral window a.s well as over a time (axial) window (see Fig. 4.4). Tliis can be achieved by minimization of SAD over a two- dimensional window (referred as 2-D SAD estimator) [77]. Another possibility is to minimize SAD and avercige tlie weiglited estimates over a number of scan angh'.s (r(.4V‘.rred as av('.raged SAD estimator) [77].
Because the echo signal is not uniform over angles, averaging of the estimated aberration delays over a two-dimensional window needs proper weighting. The weight coefficient of tlu.·: '/Fth array (dement, for the v’’th scan angle' is defiiuvl as the average magnitude of the echo signal received from this element, i.e..
u ;. — Л7
M
E I
<№ )
I
('I'l)k- \
Either a unique weighting for each element or a single weighting bound on the average magnitude over all elements can be used. This weighting scheme biases the estimation to scan angles where relativcily strong reflections are detected. It requires a simple opei'ation. d'he wcight(xl ave.rage of estimated aberration delays
Chapter 4. Phase Aberration Correction 35
2-D SAD Averaged SAD
Point reflex.tor 0.20 0.05
U n i fo r ITl 1 y (1 i S t ri b 111(H1
random scatterers 0.38 0.11
Point reflector with
-10 (IP random sca.tt('rei\s 0.27 0.09 1 T able 4.1: RMS error between llie estimated and actual aberration (unit: fraction of a wavelength).
jrns
is expressed as
/
¿ Ki=:l i=l
(4.5) where K is the number of scan angles used for averaging, and r„ is the averaged aberration delay for 7?.’th element.
COMPAIU.SON-OF 2-D SAD AND AvFRAGED s a d E,ST1MAT0R.S
To compare the performance of phase estimation with 2-D SAD mifiimization and SAD with averaging of weighted estimates, computer simulations for point and randomly distributed reflectors are performed [77, 51]. In the simulations, the simulation model previously described in Chapter 3 is employed. For the aberration, a random aberration delay pattern varying between —x / 4 and 7t/ 4 is used. The simulations are j^erformed at a region 3D away from the array, where D is the array a.])erture. The region where the error minimization is carried out consists of 31 scan angles, ea.ch of about 0.7". Idle length of time window is 8T„, and the phase is quantized by 27t/32.
RMS error between the estimated and actual aberration patterns for 2-D SAD and averaged SAD estiumtors for different reflector distributions are obtained
Chapter 4. Phase Aberration Correction 36
F ig u re 4.5: Control, aberrated and corrected PSF’s. (Table 4.1). RMS error computations are carried out as follow:
FiMS Error =
\
N
j j E ( ’·» - (4.(>)
n=i
where N is the number of array elements, and, and r," denote the estimated and the actual aberration delays for n ’th element, respectively.
Simulation results given in Table 4.1 show that the performance of averaged SAD estimator favorably compares to that of 2-D SAD (istimator [77]. In addition, the. civeraged SAD estimator reciuires a> relatively small number of arithmetic operations.
We also perform PSF simulations to examine the phase correction efficiency of the a.verciged SAD estimator [77]. The reflector distribution consists of a point reflector with -10 dl3 random scatterers. To obtain a corrected PSF, the estimated aberration delay pattc'rn is employed both in the transmit and receive beamforming. The corrected PSl'^ is compared with the control (non- aberrated) and aberrated PSF’s (l’'ig. 4.5). It is observed from this figure that
Chapter 4. Phase Aberration Coirection 37
1 -B IT .^EPRESANTATION OF RF SIGNAL*
IIME
F ig u re 4.6: One bit i'epresenl.a.Uon of the RF signal.
the corrected PSF fits the control PSl·' very well. Hence, using the averaged SAD phase estimator, the effects of the phase aberration on the array response are eliminated by the phase correction in transmit and receive beamforming. Furthermore, simulations shows that the method is successfully applied for the estimation of aberration pattern in the presence of both point and/or random reflcctor distributions.
4.2.3
R e d u c tio n o f W ord len gth
Computational efficiency of the SAD technic|ue can bci further increased using a shorter word length, d'he i)liase information of R,F signals can be ade.quately represented by zero crossings of the carrier [79, 80]. The relative phase difference between two RF signals, then, can be easily detected from shifts in their zero crossings. A single bit word length is sufficient for representation of the zero crossings of the sampled signal. Hence, the SAD technic|ue can be used on RF samples ju'operly quantized to a single bit (Fig. T6), where each addition reduces
![Table 5.1: (jharacteri.stic ])arameter.s of the designed chips.](https://thumb-eu.123doks.com/thumbv2/9libnet/5672961.113653/73.943.166.731.271.688/table-jharacteri-stic-arameter-s-designed-chips.webp)