https://doi.org/10.1007/s41748-019-00136-7
ORIGINAL ARTICLE
Temperature and Precipitation Risk Assessment Under Climate Change
Effect in Northeast Algeria
Besma Boudiaf1 · Ismail Dabanli2,3 · Hamouda Boutaghane4 · Zekai Şen2,3,5
Received: 30 May 2019 / Accepted: 9 November 2019 / Published online: 14 February 2020 © King Abdulaziz University and Springer Nature Switzerland AG 2020
Abstract
Climate change impacts on social, economic, industrial, agricultural, and water resource systems tend to increase incremen-tally with each passing day. Therefore, it is necessary to plan to control its effects, especially with regard to temperature and rainfall events impacting future water resource operation, maintenance and management works. Climate change has a direct influence at the trend of both components temperature and precipitation in increasing or decreasing manner depending on the study area. This paper presents and interprets temperature and rainfall trends for Northeast Algeria. A trend analysis technique was employed along with risk assessment. The modified risks associated with 2-, 5-, 10-, 25-, 50-, 100-, 250, and 500-year return periods are then calculated for each station. This methodology has been applied to precipitation and temperature records for six different meteorological stations in Northeast Algeria. This study confirms that climate change has and will continue to have an impact on temperature and precipitation that should be considered for all infrastructure planning, design, construction, operation, maintenance and optimum management studies in future.
Keywords Climate change · Trend analysis · Water structures · Risk analysis
1 Introduction
It is hard to talk about twenty-first century water issues without mentioning climate change. Abundant evidence shows that the earth has been warming by several degrees centigrade for the last few decades. It is highly likely that this trend is related to increasing concentrations of carbon
dioxide and other greenhouse gasses in the atmosphere (IPCC 2014). Computer models that simulate the earth’s climate tend to agree that the warming trend is likely to continue throughout the rest of this century (Hayhoe et al.
2017). The models show less agreement about projected changes in precipitation but they do tend to agree that some places (primarily the higher latitudes) will be getting wetter and others (primarily the lower latitudes) will be getting drier (Collins et al. 2013). The models also tend to agree that there is likely to be more variation in precipitation. Both floods and droughts are likely to recur with greater frequency, duration and intensity (Parry et al. 2007; Tren-berth 2008).
One of the most concerning aspects of climate change is the changes in water cycle. These projected changes can per-turb the hydrological cycle; higher temperatures are likely to speed up evaporation from water and land surfaces and speed up transpiration from plants. No matter what happens to pre-cipitation, increased evapotranspiration will dry out soils and leave less water available to flow to streams as well as less water available to infiltrate into the ground and recharge aquifers (Stagl et al. 2014). Warmer temperatures will also cause a shift in precipitation toward less snow and more rain and will lead to earlier and more rapid melting of both the
* Besma Boudiaf
1 Soil and Hydraulics Laboratory, Hydraulics Department,
Engineering Faculty, Badji Mokhtar University, PO Box 12, Annaba, Algeria
2 Civil Engineering Department, School of Engineering
and Natural Sciences, Istanbul Medipol University, Kavacık, 34181 Istanbul, Turkey
3 Climate Change Researches Application and Research
Center (IKLIMER), Istanbul Medipol University, Kavacık, 34181 Istanbul, Turkey
4 Hydraulics Department, Engineering Faculty, Badji Mokhtar
University, PO Box 12, Annaba, Algeria
5 Center of Excellence for Climate Change
Research/Department of Meteorology, King Abdulaziz University, PO Box 80234, Jeddah 21589, Saudi Arabia
seasonal snowpack and glaciers that have persisted for many years (Hoegh-Guldberg et al. 2018). Melting glaciers might cause increased runoff in glacier-fed streams in the short run, but in the long run as glaciers shrink, the melt water runoff will diminish. Along the coasts, rising sea levels are likely to inundate more low-lying land (Stagl et al. 2014).
In areas with increased precipitation, such as the northeast and certain coastal areas, more severe storms, and flooding are expected; however, in the interior of the country, more drought, less stream flow, and less groundwater recharge will eventuate (Wong et al. 2014). Water quality is likely to be affected too (Xia et al. 2015), with warmer temperatures, muddier water from increased erosion, more pollutants from storm water runoff during heavy rains, and in some places, higher contaminant levels due to less stream flow available due to diluting waste water discharges.
Considering the impacts of both climate change and pop-ulation growth, water scarcity is projected to rise signifi-cantly, According to population action international based on the United Nations Medium Population Projections of 1998, more than 2.8 billion people in 48 countries will face water stress or scarcity conditions by the year 2015, of these countries, 40 are in Western Asia, Africa, or Sub-Saharan Africa. By 2050, the number of countries facing water stress or scarcity could rise to 54 with combined population of 4 billion people, about 40% of the projected global population of 9.4 billion (Gardner-Outlaw and Engleman 1997).
Climate change effects will vary significantly, severely affecting infrastructure in different regions of the world (IPCC 2014). As climate change progresses, an important question must be asked—how to modify urban infrastruc-ture dimensions to adapt to these expected impacts (Carter et al. 2015). Usually, urban infrastructure is constructed, assuming a stable climate and until recently climate change has not been taken into account by engineers during the design stage. Now, changes in the frequency and intensity of hydroclimatic averages and extremes will probably change the critical design parameters (Westra et al. 2014). For this reason, a simple risk formulation, which takes into consid-eration the impact of climate change, must be developed to adapt for these vulnerabilities (Şen 2014; Şen et al. 2017).
The objective of this study is to generate a relationship between the climate trends and the corresponding risk levels for temperature and precipitation data in Northeast region of Algeria. This relationship is required to establish precau-tionary boundaries to account for climate change impacts.
2 Study Area and Data
Algeria is a semi-arid country located in North Africa and has experienced a period of very severe droughts with annual average temperature increases ranging from 0.65 to 1.45 °C
between 1970 and 2004. An average temperature increase comparable with the global average is observed over the period 1906–2005 (Mahmood et al. 2019). Precipitation in Northern Algeria has shown a succession of excessive epi-sodes and deficiency periods compared to historic norms with a large variability (Meddi 2009).
Numerous studies have been conducted on the northern regions of Algeria regarding precipitation and temperature, but they are directed more towards the west than the east (Mohammed and Al-Amin 2018). Bessaklia et al. (2018) studied 23 rainfall stations in the extreme northeast of Alge-ria over the period 1970–2010 and concluded that the results of Mann–Kendall test show that areas of high precipita-tion concentraprecipita-tion tend to increase. Merabti et al. (2017) examined five locations spread over the Northeast part of the country and inferred that arid and semi-arid zones have experienced a larger number of drought events while the humid and sub-humid locations received greater precipita-tion events.
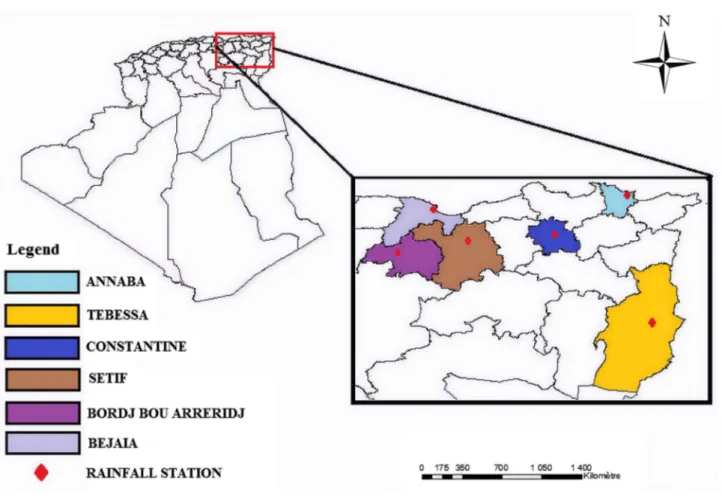
The region Northeast of Algeria (Fig. 1) represents all of the territory from the small Kabyle to the Tunisian border, occupying an area of 31,555 km2 and more than 5 million
inhabitants.
Any scientific research needs reliable data in as much detail as possible and, therefore, daily temperature and pre-cipitation data are considered from the National Agency for Hydraulic Resources (ANRH) as well as from Alge-rian Meteorological Organization since 1982 until 2017 for 35 years. Monthly time series are obtained using daily data. In this paper, monthly average temperature and precipita-tion records are considered from six staprecipita-tions, which are well distributed within five different watersheds as presented in Table 1.
3 Methodology
Risk can mean different things to different people and in different contexts, but in very simple terms, it is how likely is it that someone will be exposed to a bad consequence:
Risk = likelihood * consequence. Likelihood == hazard.
Consequence == how bad the outcome will be.
Since the consequences of climate impacts can be so catastrophic for those exposed to the risk, it is important to urgently commit resources to develop a greater under-standing of the risk as far as possible, to fill data gaps and overcome key weaknesses in our understanding and act in a precautionary manner rather than postpone action until better data are collected.
Risk assessment and risk models cannot make decisions but they can inform policymakers. Encouraging and devel-oping a culture of risk identification, risk understanding, risk
assessment and risk modeling ultimately benefits society by making it more resilient and saving lives, livelihoods and property.
In this paper, a general risk assessment procedure is imple-mented from a climate change perspective. Climate change is expected to affect all hydroclimatic variables at many dif-ferent levels. Theoretically several convenient formulations have been generated for precipitation design values. Climate change effects are ignored in most calculation procedures. In water resource projects, risk levels are determined based on
the available methods which currently ignore climate change influence. In the classical approach, risk level is defined based on the frequency of damage occurrence. The simple definition of classical risk (r) suggested by (Kupper 2012) is as follows:
where R is observed only once during the whole planned future life of any water structure. This simple risk approach (1) r = 1
R,
Fig. 1 Study area and observation station locations
Table 1 Observation stations and related information
Station name Code of the station Latitude (m) Longitude (m) Altitude (m) Name of watershed Area of the province (Km2)
Population
Annaba 603,600 (DABB) 36.83 7.81 4 (03) Constantine Coastal
East 1439 640,050
Constantine 604190 (DABC) 36.28 6.61 694 (10) Kebir Rhumel 2197 943,112
Bejaia 604020 (DAAE) 36.71 5.04 2 (1510) Soummam 3268 915,835
Setif 604450 (DAAS) 36.18 5.41 1038 (1506) Soummam 6504 1,496,150
Tebessa 604750 (DABS) 35.41 8.13 813 (12) Megjerda Mellegue 14,227 657,227
is modified by Şen et al. (2017) by taking into consideration the climate change effect as follows:
where Cr is the risk under the climate change impact and
α is the slope of trend, and α = 0 implies neither increas-ing or decreasincreas-ing climate change occurrence. In other cases, climate change can be considered directly both as positive (increasing) and negative (decreasing) contributions to risk. In this methodology, α is calculated as the slope of the trend within the hydrometeorological time series after normaliza-tion procedures are applied to the available data. The Matlab software was used to determine risk values based on differ-ent risk levels and cumulative distribution function (CDF curves) for each station.
(2) Cr= 1 + 𝛼
R ,
4 Application
An extreme event is defined as the occurrence of a variable value above (or below) a threshold near the upper (or lower) ends of its observed range in a specific region.
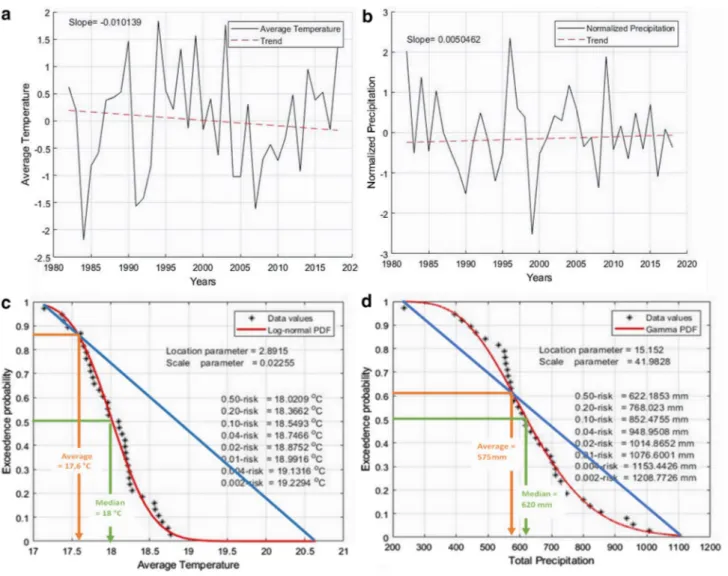
The time series for each station with the trend component and corresponding CDF curves for exceedance probability calculations are presented in a set of figures for precipitation and temperature records. For instance, Annaba station trend and risk graphs are presented in Fig. 2.
The figures show a negative trend for temperature and positive trend for precipitation, but neither trend is signifi-cant compared to the variability in the series. There is a noticeable difference between the temperature and precipita-tion results. For example, the temperature trend graph has a shift each 10-year interval from below (above) average while the precipitation trend graph remains unstable throughout the time period, especially, during the period between 1995
and 2000 which shows dramatic variation between succes-sive years.
The straight line plot from minimum to maximum of the temperature CDF curve reveals a high kurtosis, with higher probability of extreme events occurring at the right-hand tail representing high temperatures. The area below the line is greater than above indicating a negative skew (median > average), with more than the half of daily temper-atures (86% of the time series) exceeding the average. The precipitation CDF curve does not show high kurtosis, the area below the straight line from maximum to minimum is greater than above, indicating negative skew (median > aver-age), 60% of the time series exceeds the average with 10% of the series reaching very extreme levels between 850 mm to more than 1100 mm.
Bejaia station analysis results are presented in Fig. 3. As for temperature, there is a positive trend in precipita-tion but this is of less significance. Addiprecipita-tionally, one can also observe the variability in precipitation records alone. The temperature records are notably more regular except for 2006 where there is large variation. The temperature CDF curve reveals very high kurtosis implying a very high
probability of extreme events in the tails of the distribution. As previously, the area below the straight line from mini-mum to maximini-mum is greater than above, indicating negative skew (median > average) with a very large proportion of the time series (96%) exceeding the average. Finally, the precipi-tation CDF curve shows a higher standard deviation (imply-ing a high level of dispersion and risk). The area below the max–min straight line is greater than above, indicating nega-tive skew (median > average), 75% of days received greater precipitation than average, with only 10% of the results regarded as extremes between 1000 and 1500 mm.
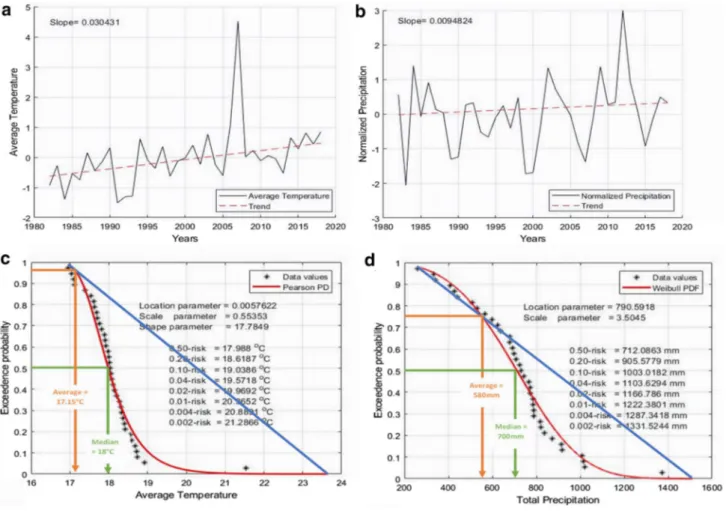
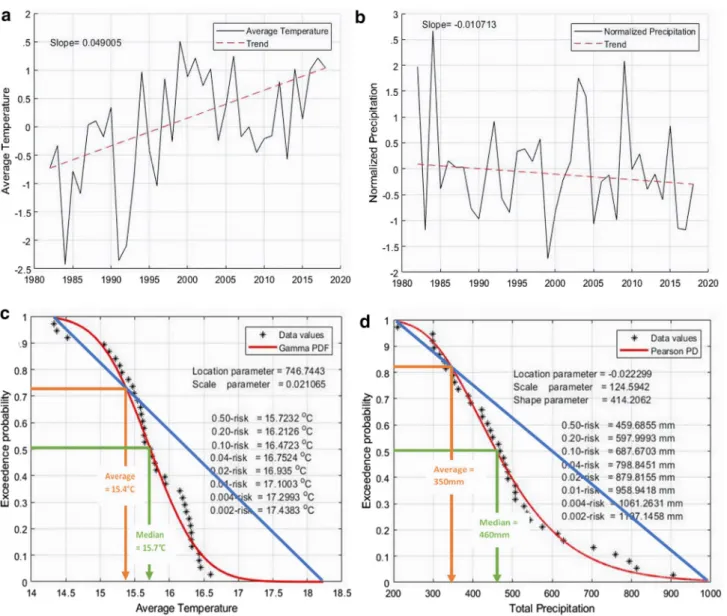
Bordj-Bouarriridj station analysis results are presented in Fig. 4 and show a negative trend for temperature and a positive trend for precipitation. Variability exists in both parameters but in different ways. Temperatures are increased at the same rate until 2013 but then increased much more rapidly, whereas precipitation varied significantly in the early years but then stabilized with time. For temperature, the CDF curve has a high kurtosis with high probability of extreme events occurring in the tail of the distribution. In both cases, the right tail represents very high temperatures with the area below the line exceeding that above, indicating
negative skew (median > average); 82% of each day’s tem-peratures are above the average, 5% exceed 18 °C to a maxi-mum of 20 °C. For precipitation, the CDF plot is flat with higher standard deviation (dispersion and risk). Again, the area below the line is greater than that above, indicating a negative skew (median > average), on 76% of days the aver-age was exceeded, with 10% of results reaching the extremes of between 1000 and 1500 mm.
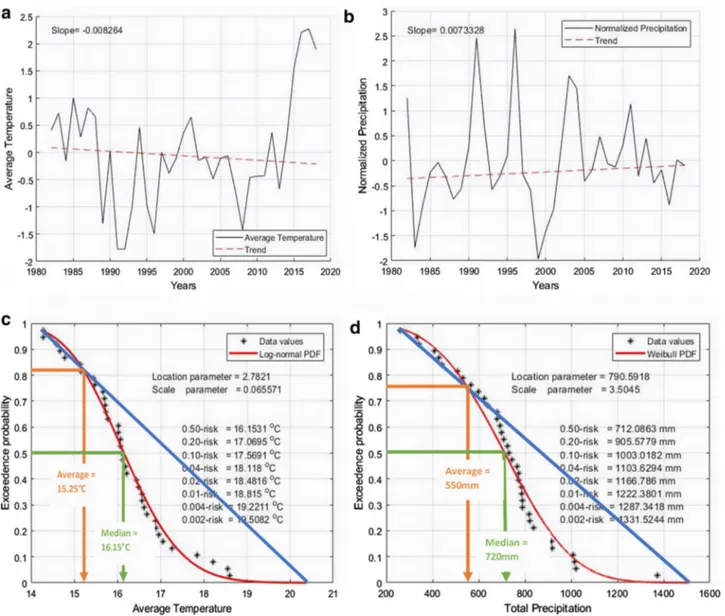
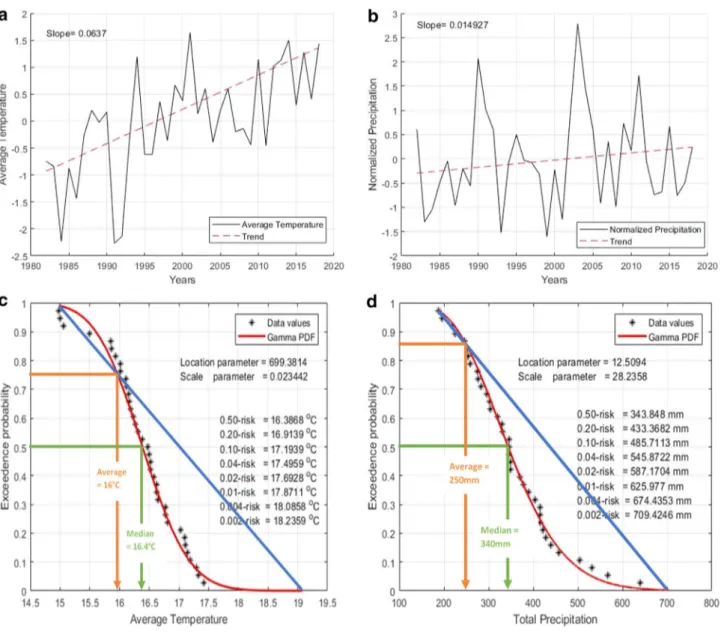
Figure 5 shows the results for Constantin station. There is a significant positive trend for temperature with the large variability stabilizing with time. However, precipitation trends negatively with minor significance but high vari-ability remains for the full time series. While CDF curves reveals that almost three quarters of days were hotter and wetter than average and 20% were considered as extremely rainy days.
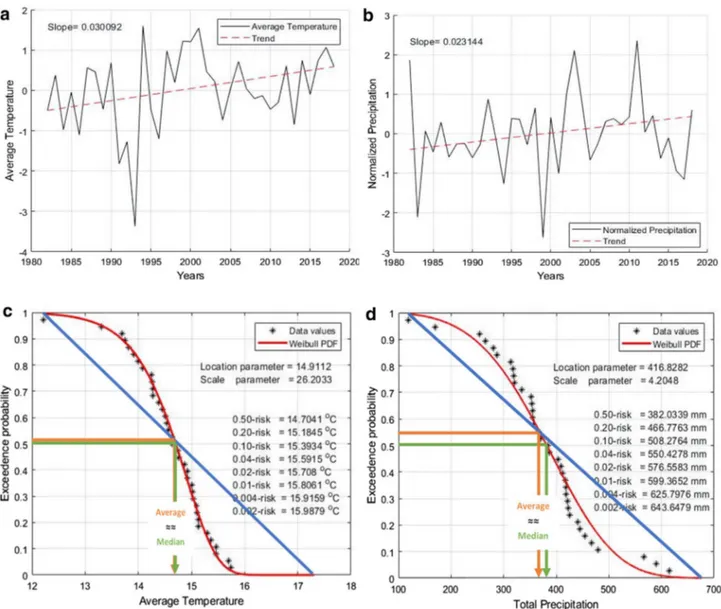
Figure 6 depicts the Setif station analysis results. Both temperature and precipitation have a positive trend at a slope equal to 0.03 and variability increasing from 1990 to 2005. Both CDF curves reveal normal distributions since there is no kurtosis—the median equals the average. Less than 5% of this time series showed extreme results.
Tebessa station represents a significant positive trend in temperature with moderate variability; on the other hand, precipitation illustrates a minor positive trend with major variability. CDF curves reveal that 75% of time series of temperature, and 87% of received precipitation were above the average, where 10% of those days reached extreme levels (Fig. 7).
5 Results and Discussion
Before any infrastructure construction, risk assessment and return period (or average frequency of occurrence) should be assessed and taken into consideration. The classical risk is the probability of dangerous event occurrence only once during the entire life of the infrastructure. In this paper, it is proposed that the risk calculations should additionally be based on the slope of possible trends in temperature and precipitation records over the life span.
To calculate the risk under climate change effects, a cli-mate factor α (the slope of the trend component within the hydrometeorological time series) needs to be added to the numerator of the classical risk formula. If α = 0, there is no climate change variation trend, otherwise α takes positive (increasing) and negative (decreasing) values.
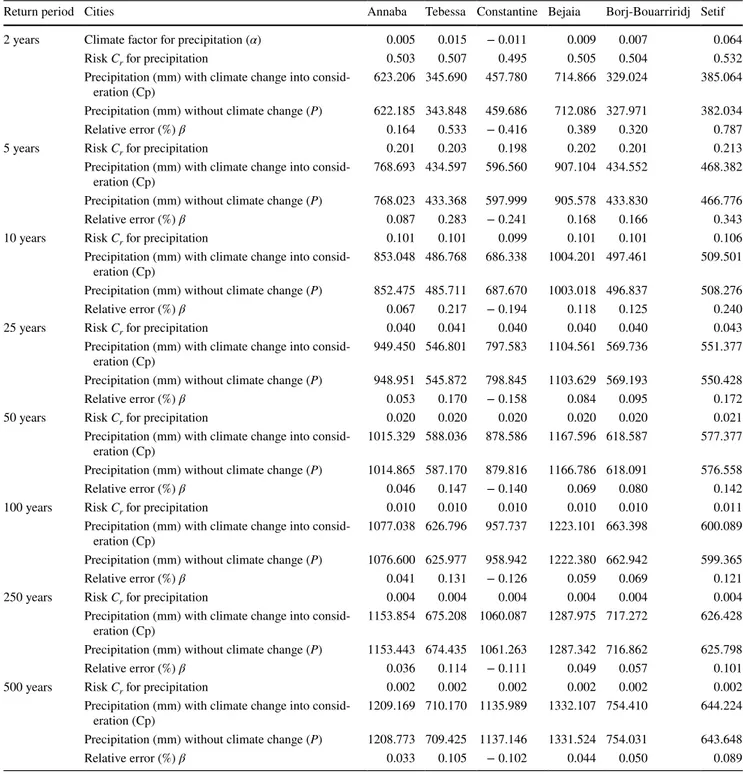
Tables 2 and 3 represent the annual precipitation records at each meteorological station and the statistics of both cases with and without climate change effect for different return periods. The relative error, β, is calculated by taking into consideration precipitation (or temperature) levels under the effects of climate change Ccc and with no climate effect, P, according to the following expression:
Concerning the precipitation parameter, Table 2, note that Setif and Tebessa stations present the higher positive levels of relative error percentage mean that the impact of climate change on these two stations is more severe than (3) 𝛽 = 100 ( Ccc−P C cc ) .
for the others, followed by Bejaia and Bordj-Bouarriridj station with least affect for Annaba station.
All stations show increasing precipitation. However, Constantine station presents a negative relative error per-centage reflecting decreasing precipitation under climate change effect while all other stations show an increasing effect.
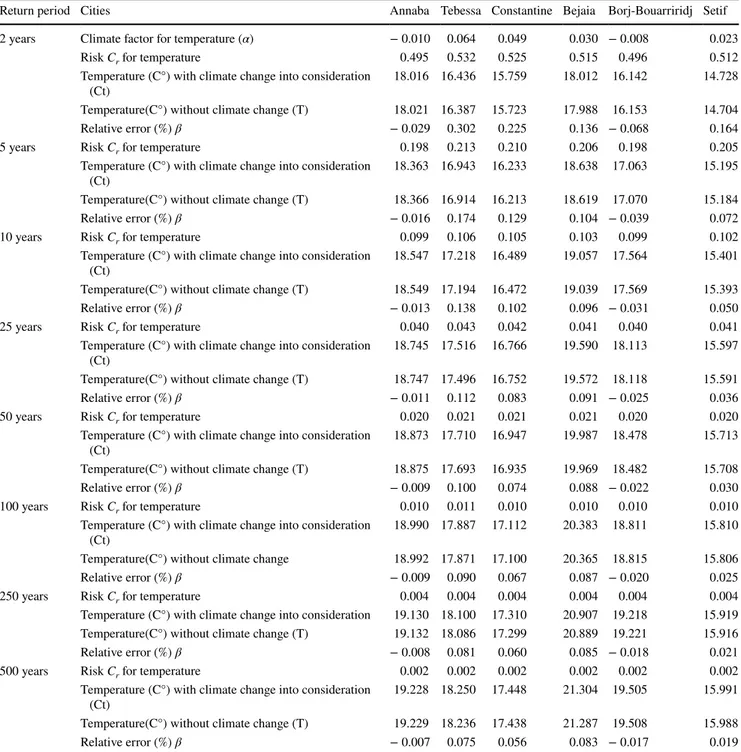
Table 3 shows the results appropriate for temperature. The β value for Annaba and Bordj-Bouarriridj stations dur-ing all return periods has a negative sign (−), which means that these two stations are subject to lower annual average temperature, whereas other stations, namely Tebessa, Con-stantine, Setif and Bejaia have positive β, implying that cli-mate change will increase their temperatures with Tebessa increasing most.
After calculating climate change risk level from Eq. (2), one can use Eq. (1) to find the new return period,
incorporating the climate change effect. For this case, the relative error percentage (γ) is calculated similar to Eq. (3) as
where CR and R are the return periods with and without
climate change effect, respectively, leading to results in Tables 4 and 5.
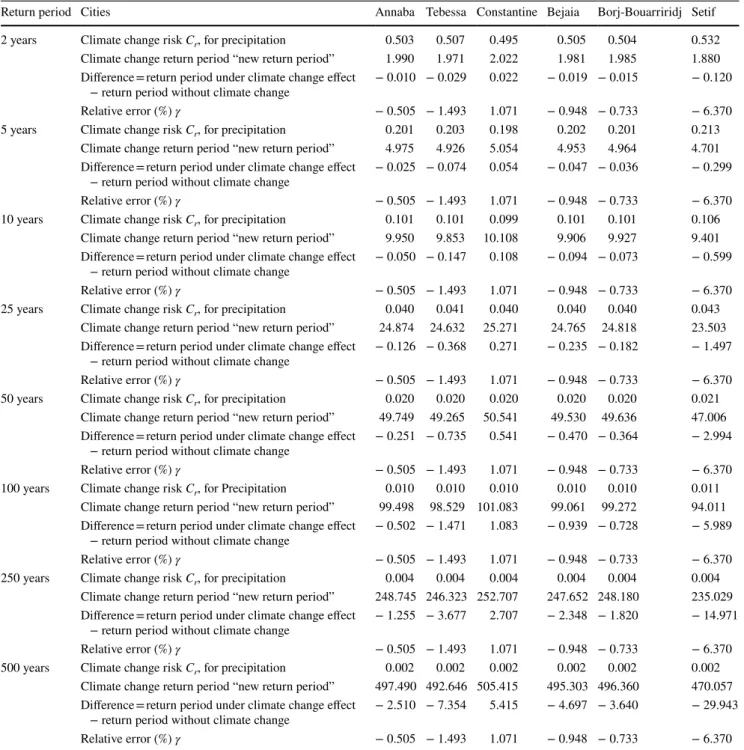
Table 4 reveals that only Constantine station has a posi-tive relaposi-tive error percentage (γ), which means that the return period for extreme levels of precipitation includ-ing climate change considerations is longer than with-out climate change impact. The greater the return period increase, the longer it extends. In contrast, at the other five (4) 𝛾 = 100( CR−R
CR )
,
stations, shorter return periods prevail implying that rare events will occur faster due to climate change.
Table 5 expresses the return periods including climate change impacts. Annaba and Borj-Bouarriridj stations expect longer return periods, while Tebessa, Constantine, Bejaia and Setif anticipate shorter return periods for extreme temperature occurrence.
6 Conclusion
It is well known that precipitation and temperature have been steadily increasing all around the world, and especially, in the Mediterranean basin over the last 3 decades. The most important concept in any water resource system design is the risk associated with hydrometeorological events. The
purpose of this study is to analyze trends in temperature and precipitation records and incorporate these into risk assessments by incorporating the changing climate (tem-perature and precipitation) for the Northeast of Algeria over the 35-year period (1982–2017). For this purpose, a climate change factor is incorporated into the classical for-mulation, based on the trend slope in historical records. The risks associated with 2-, 5-, 10-, 25-, 50-, 100-, 250-, and 500-year return periods are calculated for each station. The study indicates that climate change impact is expected to be more influential at all locations except Constantine where the risk of extreme precipitation appears likely to diminish. Temperatures in Tebessa, Constantine, Setif and Bejaia are expected to reach more frequent extremes.
Infrastructure that has been planned for construction in Annaba, Tebessa, Bejaia, Borj-Bouarriridj and Setif that use
precipitation data should take into consideration the impact of climate change on extreme weather return periods. In the same light, the temperature data considerations should fol-low the same approach for Tebessa, Constantine, Bejaia and Setif cities.
Positive trends in temperature and precipitation records appear in most stations with varying degrees. For exam-ple, in Constantine and Tebessa, a significantly increas-ing trend for temperature is indicated with a slope 0.05, while Bejaia and Setif have less significant trends with
Table 2 Climate impact on precipitation features
The higher the number of return periods, the lower the relative error percentage value
Return period Cities Annaba Tebessa Constantine Bejaia Borj-Bouarriridj Setif
2 years Climate factor for precipitation (α) 0.005 0.015 − 0.011 0.009 0.007 0.064
Risk Cr for precipitation 0.503 0.507 0.495 0.505 0.504 0.532
Precipitation (mm) with climate change into
consid-eration (Cp) 623.206 345.690 457.780 714.866 329.024 385.064
Precipitation (mm) without climate change (P) 622.185 343.848 459.686 712.086 327.971 382.034
Relative error (%) β 0.164 0.533 − 0.416 0.389 0.320 0.787
5 years Risk Cr for precipitation 0.201 0.203 0.198 0.202 0.201 0.213
Precipitation (mm) with climate change into
consid-eration (Cp) 768.693 434.597 596.560 907.104 434.552 468.382
Precipitation (mm) without climate change (P) 768.023 433.368 597.999 905.578 433.830 466.776
Relative error (%) β 0.087 0.283 − 0.241 0.168 0.166 0.343
10 years Risk Cr for precipitation 0.101 0.101 0.099 0.101 0.101 0.106
Precipitation (mm) with climate change into
consid-eration (Cp) 853.048 486.768 686.338 1004.201 497.461 509.501
Precipitation (mm) without climate change (P) 852.475 485.711 687.670 1003.018 496.837 508.276
Relative error (%) β 0.067 0.217 − 0.194 0.118 0.125 0.240
25 years Risk Cr for precipitation 0.040 0.041 0.040 0.040 0.040 0.043
Precipitation (mm) with climate change into
consid-eration (Cp) 949.450 546.801 797.583 1104.561 569.736 551.377
Precipitation (mm) without climate change (P) 948.951 545.872 798.845 1103.629 569.193 550.428
Relative error (%) β 0.053 0.170 − 0.158 0.084 0.095 0.172
50 years Risk Cr for precipitation 0.020 0.020 0.020 0.020 0.020 0.021
Precipitation (mm) with climate change into
consid-eration (Cp) 1015.329 588.036 878.586 1167.596 618.587 577.377
Precipitation (mm) without climate change (P) 1014.865 587.170 879.816 1166.786 618.091 576.558
Relative error (%) β 0.046 0.147 − 0.140 0.069 0.080 0.142
100 years Risk Cr for precipitation 0.010 0.010 0.010 0.010 0.010 0.011
Precipitation (mm) with climate change into
consid-eration (Cp) 1077.038 626.796 957.737 1223.101 663.398 600.089
Precipitation (mm) without climate change (P) 1076.600 625.977 958.942 1222.380 662.942 599.365
Relative error (%) β 0.041 0.131 − 0.126 0.059 0.069 0.121
250 years Risk Cr for precipitation 0.004 0.004 0.004 0.004 0.004 0.004
Precipitation (mm) with climate change into
consid-eration (Cp) 1153.854 675.208 1060.087 1287.975 717.272 626.428
Precipitation (mm) without climate change (P) 1153.443 674.435 1061.263 1287.342 716.862 625.798
Relative error (%) β 0.036 0.114 − 0.111 0.049 0.057 0.101
500 years Risk Cr for precipitation 0.002 0.002 0.002 0.002 0.002 0.002
Precipitation (mm) with climate change into
consid-eration (Cp) 1209.169 710.170 1135.989 1332.107 754.410 644.224
Precipitation (mm) without climate change (P) 1208.773 709.425 1137.146 1331.524 754.031 643.648
0.03 slopes. Additionally, Annaba and Bordj-Bouarriridj show a decreasing, but not significant trend. As for the precipitation records, all stations indicate positive, but not significant trends, except Constantine station which
tends to decrease with little significance. The cumulative distribution function (CDF) curves reveal that Annaba, Bejaia, Borj-Bouarriridj, Constantine and Tebessa have more than 70% of their days being hotter and wetter than
Table 3 Climate impact on temperature features
The higher the number of return periods, the lower the relative error percentage value
Return period Cities Annaba Tebessa Constantine Bejaia Borj-Bouarriridj Setif
2 years Climate factor for temperature (α) − 0.010 0.064 0.049 0.030 − 0.008 0.023
Risk Cr for temperature 0.495 0.532 0.525 0.515 0.496 0.512
Temperature (C°) with climate change into consideration
(Ct) 18.016 16.436 15.759 18.012 16.142 14.728
Temperature(C°) without climate change (T) 18.021 16.387 15.723 17.988 16.153 14.704
Relative error (%) β − 0.029 0.302 0.225 0.136 − 0.068 0.164
5 years Risk Cr for temperature 0.198 0.213 0.210 0.206 0.198 0.205
Temperature (C°) with climate change into consideration
(Ct) 18.363 16.943 16.233 18.638 17.063 15.195
Temperature(C°) without climate change (T) 18.366 16.914 16.213 18.619 17.070 15.184
Relative error (%) β − 0.016 0.174 0.129 0.104 − 0.039 0.072
10 years Risk Cr for temperature 0.099 0.106 0.105 0.103 0.099 0.102
Temperature (C°) with climate change into consideration
(Ct) 18.547 17.218 16.489 19.057 17.564 15.401
Temperature(C°) without climate change (T) 18.549 17.194 16.472 19.039 17.569 15.393
Relative error (%) β − 0.013 0.138 0.102 0.096 − 0.031 0.050
25 years Risk Cr for temperature 0.040 0.043 0.042 0.041 0.040 0.041
Temperature (C°) with climate change into consideration
(Ct) 18.745 17.516 16.766 19.590 18.113 15.597
Temperature(C°) without climate change (T) 18.747 17.496 16.752 19.572 18.118 15.591
Relative error (%) β − 0.011 0.112 0.083 0.091 − 0.025 0.036
50 years Risk Cr for temperature 0.020 0.021 0.021 0.021 0.020 0.020
Temperature (C°) with climate change into consideration
(Ct) 18.873 17.710 16.947 19.987 18.478 15.713
Temperature(C°) without climate change (T) 18.875 17.693 16.935 19.969 18.482 15.708
Relative error (%) β − 0.009 0.100 0.074 0.088 − 0.022 0.030
100 years Risk Cr for temperature 0.010 0.011 0.010 0.010 0.010 0.010
Temperature (C°) with climate change into consideration
(Ct) 18.990 17.887 17.112 20.383 18.811 15.810
Temperature(C°) without climate change 18.992 17.871 17.100 20.365 18.815 15.806
Relative error (%) β − 0.009 0.090 0.067 0.087 − 0.020 0.025
250 years Risk Cr for temperature 0.004 0.004 0.004 0.004 0.004 0.004
Temperature (C°) with climate change into consideration 19.130 18.100 17.310 20.907 19.218 15.919 Temperature(C°) without climate change (T) 19.132 18.086 17.299 20.889 19.221 15.916
Relative error (%) β − 0.008 0.081 0.060 0.085 − 0.018 0.021
500 years Risk Cr for temperature 0.002 0.002 0.002 0.002 0.002 0.002
Temperature (C°) with climate change into consideration
(Ct) 19.228 18.250 17.448 21.304 19.505 15.991
Temperature(C°) without climate change (T) 19.229 18.236 17.438 21.287 19.508 15.988
average with only the Setif station having equally likely temperatures and precipitations above and below the aver-age. This study confirms that climate change has and will
continue to have impacts on temperature and precipitation and should be taken into consideration in the calculations of all infrastructure constructions.
Table 4 Return period (year) comparison for precipitations
Return period Cities Annaba Tebessa Constantine Bejaia Borj-Bouarriridj Setif
2 years Climate change risk Cr, for precipitation 0.503 0.507 0.495 0.505 0.504 0.532
Climate change return period “new return period” 1.990 1.971 2.022 1.981 1.985 1.880 Difference = return period under climate change effect
− return period without climate change − 0.010 − 0.029 0.022 − 0.019 − 0.015 − 0.120
Relative error (%) γ − 0.505 − 1.493 1.071 − 0.948 − 0.733 − 6.370
5 years Climate change risk Cr, for precipitation 0.201 0.203 0.198 0.202 0.201 0.213
Climate change return period “new return period” 4.975 4.926 5.054 4.953 4.964 4.701 Difference = return period under climate change effect
− return period without climate change − 0.025 − 0.074 0.054 − 0.047 − 0.036 − 0.299
Relative error (%) γ − 0.505 − 1.493 1.071 − 0.948 − 0.733 − 6.370
10 years Climate change risk Cr, for precipitation 0.101 0.101 0.099 0.101 0.101 0.106
Climate change return period “new return period” 9.950 9.853 10.108 9.906 9.927 9.401 Difference = return period under climate change effect
− return period without climate change − 0.050 − 0.147 0.108 − 0.094 − 0.073 − 0.599
Relative error (%) γ − 0.505 − 1.493 1.071 − 0.948 − 0.733 − 6.370
25 years Climate change risk Cr, for precipitation 0.040 0.041 0.040 0.040 0.040 0.043
Climate change return period “new return period” 24.874 24.632 25.271 24.765 24.818 23.503 Difference = return period under climate change effect
− return period without climate change − 0.126 − 0.368 0.271 − 0.235 − 0.182 − 1.497
Relative error (%) γ − 0.505 − 1.493 1.071 − 0.948 − 0.733 − 6.370
50 years Climate change risk Cr, for precipitation 0.020 0.020 0.020 0.020 0.020 0.021
Climate change return period “new return period” 49.749 49.265 50.541 49.530 49.636 47.006 Difference = return period under climate change effect
− return period without climate change − 0.251 − 0.735 0.541 − 0.470 − 0.364 − 2.994
Relative error (%) γ − 0.505 − 1.493 1.071 − 0.948 − 0.733 − 6.370
100 years Climate change risk Cr, for Precipitation 0.010 0.010 0.010 0.010 0.010 0.011 Climate change return period “new return period” 99.498 98.529 101.083 99.061 99.272 94.011 Difference = return period under climate change effect
− return period without climate change − 0.502 − 1.471 1.083 − 0.939 − 0.728 − 5.989
Relative error (%) γ − 0.505 − 1.493 1.071 − 0.948 − 0.733 − 6.370
250 years Climate change risk Cr, for precipitation 0.004 0.004 0.004 0.004 0.004 0.004 Climate change return period “new return period” 248.745 246.323 252.707 247.652 248.180 235.029 Difference = return period under climate change effect
− return period without climate change − 1.255 − 3.677 2.707 − 2.348 − 1.820 − 14.971
Relative error (%) γ − 0.505 − 1.493 1.071 − 0.948 − 0.733 − 6.370
500 years Climate change risk Cr, for precipitation 0.002 0.002 0.002 0.002 0.002 0.002 Climate change return period “new return period” 497.490 492.646 505.415 495.303 496.360 470.057 Difference = return period under climate change effect
− return period without climate change − 2.510 − 7.354 5.415 − 4.697 − 3.640 − 29.943
References
Bessaklia H, Ghenim A, Megnounif A, Martin-Vide J (2018) Spatial variability of concentration and aggressiveness of precipitation in North-East of Algeria. J Water Land Dev 36:3–15. https :// doi.org/10.2478/jwld-2018-0001
Carter JG, Cavan G, Connelly A, Guy S, Handley J, Kazmierczak A (2015) Climate change and the city: building capacity for urban
adaptation. Progress Plan 95:1–66. https ://doi.org/10.1016/j. progr ess.2013.08.001
Collins M, Knutti R, Arblaster J, Dufresne JL, Fichefet T, Friedling-stein P, Gao X, Gutowski WJ, Johns T, Krinner G, Tebaldi C, Weaver AJ, Wehner M (2013) Long-term climate change: pro-jections, commitments and irreversibility. WG1AR5. Cambridge University Press, Cambridge
Gardner-Outlaw T, Engleman R (1997) Sustaining water, easing scar-city: a second update. Population Action International, Washing-ton, DC
Table 5 Return period (year) comparison for temperatures
Return period Cities Annaba Tebessa Constantine Bejaia Borj-Bouarriridj Setif
2 years Climate change risk Cr, for temperature 0.495 0.532 0.525 0.515 0.496 0.512
Climate change return period “new return period” 2.020 1.880 1.907 1.941 2.017 1.955 Difference = return period under climate change
effect − return period without climate change 0.020 − 0.120 − 0.093 − 0.059 0.017 − 0.045
Relative error (%) γ 1.014 − 6.370 − 4.901 − 3.043 0.826 − 2.314
5 years Climate change risk Cr, for temperature 0.198 0.213 0.210 0.206 0.198 0.205
Climate change return period “new return period” 5.051 4.701 4.766 4.852 5.042 4.887 Difference = return period under climate change
effect − return period without climate change 0.051 − 0.299 − 0.234 − 0.148 0.042 − 0.113
Relative error (%) γ 1.014 − 6.370 − 4.900 − 3.043 0.826 − 2.314
10 years Climate change risk Cr, for temperature 0.099 0.106 0.105 0.103 0.099 0.102
Climate change return period “new return period” 10.102 9.401 9.533 9.705 10.083 9.774 Difference = return period under climate change
effect − return period without climate change 0.102 − 0.599 − 0.467 − 0.295 0.083 − 0.226
Relative error (%) γ 1.014 − 6.370 − 4.900 − 3.043 0.826 − 2.314
25 years Climate change risk Cr, for temperature 0.040 0.043 0.042 0.041 0.040 0.041
Climate change return period “new return period” 25.256 23.503 23.832 24.262 25.208 24.434 Difference = return period under climate change
effect − return period without climate change 0.256 − 1.497 − 1.168 − 0.738 0.208 − 0.566
Relative error (%) γ 1.014 − 6.370 − 4.901 − 3.043 0.826 − 2.314
50 years Climate change risk Cr, for temperature 0.020 0.021 0.021 0.021 0.020 0.020
Climate change return period “new return period” 50.512 47.006 47.664 48.523 50.417 48.869 Difference = return period under climate change
effect − return period without climate change 0.512 − 2.994 − 2.336 − 1.477 0.417 − 1.131
Relative error (%) γ 1.014 − 6.370 − 4.901 − 3.043 0.826 − 2.314
100 years Climate change Risk Cr, for temperature 0.010 0.011 0.010 0.010 0.010 0.010
Climate change return period “new return period” 101.024 94.011 95.328 97.047 100.833 97.738 Difference = return period under climate change
effect − return period without climate change 1.024 − 5.989 − 4.672 − 2.953 0.833 − 2.262
Relative error (%) γ 1.014 − 6.370 − 4.901 − 3.043 0.826 − 2.314
250 years Climate change risk Cr, for temperature 0.004 0.004 0.004 0.004 0.004 0.004
Climate change return period “new return period” 252.561 235.029 238.321 242.617 252.083 244.345 Difference = return period under climate change
effect − return period without climate change 2.561 − 14.971 − 11.679 − 7.383 2.083 − 5.655
Relative error (%) γ 1.014 − 6.370 − 4.901 − 3.043 0.826 − 2.314
500 years Climate change risk Cr, for temperature 0.002 0.002 0.002 0.002 0.002 0.002
Climate change return period “new return period” 505.121 470.057 476.642 485.234 504.166 488.690 Difference = return period under climate change
effect − return period without climate change 5.121 − 29.943 − 23.358 − 14.766 4.166 − 11.310
Hayhoe K, Edmonds J, Kopp RE, LeGrande AN, Sanderson BM, Weh-ner MF, Wuebbles DJ (2017) Climate models, scenarios, and pro-jections. In: Wuebbles DJ, Fahey DW, Hibbard KA, Dokken DJ, Stewart BC, Maycock TK (eds) Climate science special report: fourth national climate assessment, vol I. Global Change Research Program, Washington, DC, pp 133–160. https ://doi.org/10.7930/ j0wh2 n54
Hoegh-Guldberg et al (2018) Impacts of 1.5 ºC global warming on natural and human systems. In: Masson-Delmotte V, Zhai P, Pörtner HO, Roberts D, Skea J, Shukla PR, Pirani A, Mou-fouma-Okia W, Péan C, Pidcock R, Connors S, Matthews JBR, Chen Y, Zhou X, Gomis MI, Lonnoy E, Maycock T, Tignor M, Waterfield T (eds) Global warming of 1.5 °C. An IPCC Special Report on the impacts of global warming of 1.5 °C above pre-industrial levels and related global greenhouse gas emission pathways, in the context of strengthening the global response to the threat of climate change, sustainable development, and efforts to eradicate poverty (in press)
IPCC (2014) Climate change 2014—impacts, adaptation and vul-nerability: part A: global and sectoral aspects: working group II contribution to the IPCC fifth assessment report: volume 1: global and sectoral aspects, vol 1. Cambridge University Press, Cambridge. https ://doi.org/10.1017/cbo97 81107 41537 9 Kupper L (2012) Probability, statistics, and decision for civil
engineers. Technometrics. https ://doi.org/10.1080/00401 706.1971.10488 770
Mahmood R, Jia S, Zhu W (2019) Analysis of climate variability, trends, and prediction in the most active parts of the Lake Chad basin, Africa. Sci Rep 9:6317. https ://doi.org/10.1038/s4159 8-019-42811 -9
Meddi M (2009) Annual variability of precipitation of the northwest of Algeria. Variabilité des précipitations annuelles du Nord-Ouest de l’Algérie Sécheresse 20:57–65
Merabti A, Meddi M, Martins D, Pereira L (2017) Comparing SPI and RDI applied at local scale as influenced by climate. Water Resour Manage. https ://doi.org/10.1007/s1126 9-017-1855-7
Mohammed T, Al-Amin A (2018) Climate change and water resources in Algeria: vulnerability, impact and adaptation
strategy. Econ Environ Stud 18:411–429. https ://doi.org/10.25167 /ees.2018.45.23
Parry ML, Canziani OF, Palutikof JP, Van der Linden PJ, Hanson CE (2007) Climate change 2007: impacts, adaptation and vulnerabil-ity. Contribution of working group II to the fourth assessment report of the intergovernmental panel on climate change. Cam-bridge University Press, CamCam-bridge, p 976
Şen Z (2014) Trend identification simulation and application. J Hydrol Eng 19:635–642. https ://doi.org/10.1061/(ASCE)HE.1943-5584.00008 11
Şen Z, Mohorji AM, Almazroui M (2017) Engineering risk assess-ment on water structures under climate change effects. Arab J Geosci 10:517
Stagl J, Mayr E, Koch H, Hattermann FF, Huang S (2014) Effects of climate change on the hydrological cycle in Central and Eastern Europe. In: Rannow S, Neubert M (eds) Manag-ing protected areas in Central and Eastern Europe under cli-mate change. Springer, Dordrecht, pp 31–43. https ://doi. org/10.1007/978-94-007-7960-0_3
Trenberth KE (2008) The impact of climate change and variability on heavy precipitation, floods, and droughts. In: Anderson MG, McDonnell JJ (eds) Encyclopedia of hydrological sciences. https ://doi.org/10.1002/04708 48944 .hsa21 1
Westra S et al (2014) Future changes to the intensity and frequency of short-duration extreme rainfall: future intensity of sub-daily rainfall. Rev Geophys. https ://doi.org/10.1002/2014r g0004 64 Wong PP et al (2014) Coastal systems and low-lying areas. In: Field
CB, Barros VR, Dokken DJ, Mach KJ, Mastrandrea MD, Chat-terjee M, Ebi KL, Estrada YO, Genova RC, Girma B, Kissel ES, Levy AN, MacCracken S, Mastrandrea PR, White LL (eds) Con-tribution of working group II to the fifth assessment report of the intergovernmental panel on climate change climate change 2014: impacts, adaptation, and vulnerability. Cambridge University Press, Cambridge, pp 361–409
Xia X, Wu Q, Mou XL, Lai Y (2015) Potential impacts of climate change on the water quality of different water bodies. J Environ Inform 25:85–98. https ://doi.org/10.3808/jei.20140 0263