Fresenius J Anal Chem (1996) 355: 654—656 ( Springer-Verlag 1996 L E C T U R E
S, efik Su~ zer · Timur Voscoboinikov Keith R. Hallam · Geoffrey C. Allen
Electron spectroscopic investigation of Sn coatings on glasses
Received: 25 September 1995/Revised: 13 October 1995/Accepted: 8 November 1995
Abstract Float glasses of different thicknesses and a conducting tin oxide glass have been investigated using Photo and Auger Electron Spectroscopy induced by AlKa X-rays. On the basis of measured chemical XPS shifts in the binding energies the chem-ical state of Sn (#2 or #4) incorporated on the float glasses could not be assigned. The use of the Auger parameter allows to separate relaxation and chemical contributions. The derived true chemical shifts of Sn on float-glasses are larger than those of SnO and/or SnO2 due to the larger ionic environment of the glass matrix. Ar` or HF etching reveals that the concentration of Sn decreases exponentially as a function of depth from the surface.
Introduction
Coating of Sn and its oxides plays a very important role in technologically important applications like float-glass production, solar energy cells, protective and con-ductive coatings, etc.. Numerous electron spectroscopic investigations dealing with tin oxides have been re-ported [1—4]. For many applications quantitative data for Sn, like surface coverage or depth profiling, are important parameters. In some applications, however, further information like oxidation state, coordination number, etc., are needed. XPS and/or AES studies
S,. Su¨zer ( ) · T. Voscoboinikov*
Chemistry Department, Bilkent University, 06533 Ankara, Turkey K.R. Hallam · G.C. Allen
University of Bristol, Interface Analysis Centre, Bristol BS2 8BS, UK
* On leave from N.D. Zelinsky Institute of Organic Chemistry, Russian Academy of Sciences, 117913 Moscow, Russia
attempting to distinguish between the two oxides of tin, SnO and SnO2, showed either the absence or only a small difference in the core level binding energies [1—4]. In a different investigation, it was demonstrated that, although the core level shifts were not significant, XPS of the valence band region helped unambiguously to distinguish between the two oxides [5]. Another parameter which can be derived from the X-ray in-duced photoelectron spectra is the Auger parameter. The concept of the Auger parameter, introduced by Wagner [6] and further developed by others [7, 8], can be very informative. In a recent study [9], we have reported the Auger parameters of tin metal, tin oxides and chlorides. In this study we extend our study to float glasses of different thickness and a tin oxide coated conducting glass. Tin is incorporated on both surfaces of glasses produced by the float technique (float glass-es). Incorporation of tin on the tin-bath surface of the glass is achieved by contact with liquid tin and is homogeneous, while the atmospheric surface is known to be produced by precipitation of tin vapors and in form of islands [10].
Experimental
Float glasses with thicknesses of 3, 4, 5, 6 and 10 mm were provided by the local producer (Tu¨rkiye S,is,e-Cam A.S,.), while the con-ducting tin oxide glass is a commercial tin oxide glass. Electron spectroscopic measurements were carried out with a KRATOS ES300 spectrometer using AlKa X-rays. Samples of the appro-priate size were wiped by a clean tissue paper before their introduc-tion into the spectrometer. Pressure in the analyzer chamber was kept below 5]10~9 Torr during analysis. Depth profiling was carried out using either (i) in-situ Ar` etching with 1 keV ions or (ii) etching with a 2% HF solution before introduction into the spectrometer.
Both the C1s peak (B.E."285.0 eV) from residual hydrocarbons and the Si2p peak (B.E."103.2 eV) were used as reference for charging effects. The accuracy in binding energies is around 0.1 eV while for the Auger parameter it is believed to be 0.05 eV due to suppression of charging effects. Quantitative data were obtained using standard procedures [11].
Table 1 XPS/XAES data of some float glasses, the tin oxide conducting glass together with some reference compounds (Referenced to Si2p"103.2 eV)
BE (eV) KE (eV) aS/ *E%3 *E#) Atomic ratio
Sn3d5@2 SnMNN (eV) (eV) (eV)
Sn/Si O/Si 3 mm 488.2 430.5 918.7 !1.7 0.8 0.283 4.12 3 mm (at.surf.) 487.7 430.6 918.3 !2.0 0.1 0.026 3.12 4 mm 488.1 430.7 918.8 !1.8 0.7 0.235 3.12 5 mm 488.0 430.5 918.5 !1.9 0.5 0.193 4.68 6 mm 488.1 430.2 918.3 !2.0 0.5 0.164 3.93 10 mm 488.1 430.5 918.6 !1.8 0.7 0.222 3.22 Cond. Glass! 487.6 431.9 919.5 !1.4 0.6 — 2.58 Sn! 485.6 436.7 922.3 — — — — SnO! 487.1 433.0 920.0 !1.3 0.2 — 0.98 SnO2! 487.5 431.6 919.1 !1.6 0.3 — 1.66 ! Referenced to C1s"285.0 eV
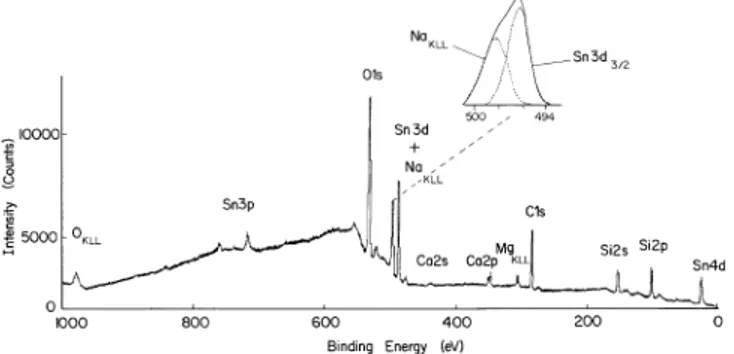
Fig. 1 AlKaX-ray induced electron spectrum of the tin-bath side of a 3 mm float glass, Insert shows the overlapping Na KLL Auger and Sn 3d3@2 photopeaks
Results and discussion
Figure 1 displays a typical electron spectrum of a float glass induced by AlKa X-rays. Photoelectron lines cor-responding to O1s, C1s, Si 2s and 2p, Ca 2s and 2p, Sn 4d, 3d and 3p lines as well as O, Na and Mg KLL and Sn MNN (not shown in the figure) Auger lines are the prominent features. Na KLL Auger and Sn 3d3@2 lines overlap but can easily be separated by curve resolution. The intensities of the Sn lines vary depending on the surface examined (i.e. tin-bath or atmospheric), the thickness of the glass and naturally the etching time. The relevant data are collected in Table 1. The table also contains data on SnO, SnO2 as well as the tin oxide conducting glass.
Chemical state of Sn
The measured binding energies of SnO, SnO2 and Sn on glasses are very close to each other. On the basis of the raw binding energies of Sn one can not, unambigu-ously, decide on the chemical state of Sn. The measured binding energies contain contributions from relaxation effects besides the chemical shifts. At this point we must refer to the Auger parameter or the true chemical shift. Figure 2 gives the Sn MNN Auger spectra of SnO2 (a), SnO (b) and the conducting glass (c). It is evident from the figure that the Auger lines display a much larger (close to 1 eV) chemical shift. We can analyze the chem-ical shifts in binding energies, *E#), using Wagner’s approach of identifying compounds on the basis of their Auger parameters:
a"E"#E,
where E" is the binding energy of the photoelectron and E, is the kinetic energy of the Auger electron emitted as a result of the Auger process involving the same elec-tron level. The shift in E" can be regarded as the sum of (i) the chemical shift,*E#), which depends on the
effec-tive charge of the atom, and (ii) the relaxation energy. The latter consists of two components, intra and extra atomic relaxations, E*3 and E%3, determined by the inter-action of other electrons within the same atom or its neighbours. One can roughly describe them as gas phase (intra-atomic) and solid-state (extra-atomic) con-tributions. If E*3 is constant, one obtains the binding energy shift in relation to zero-valent bulk material (Sn metal in the case of tin):
*E""*E#)#*E%3
Contributions to the chemical and relaxation terms of the Auger electrons can be expressed as follows: *E,"!*E#)#3*E%3
*a"!*E"#*E, *a"2*E%3
This procedure allows to separate chemical (the true chemical shift) and relaxation contributions from the measured binding energies and Auger parameters.
As can be seen from the table, the chemical shift computed using this procedure is 0.2 eV for SnO and 0.3 eV for SnO2. For Sn coated on glasses, however, the derived shifts vary between 0.5 and 0.8 (except for the
Fig. 2 Sn MNN Auger peaks of SnO2 (bottom), SnO (middle) and the tin oxide conducting glass (top) induced by AlKa X-rays
Fig. 3 Ratio of the Sn/Si concentration of a 3 mm float glass as a function ofr etching time [min] (Ar`), s etching time [s] (2% HF)
Fig. 4 Sn/Si ratio plotted against Ar` etching time in a linear (s bottom) and log (r top) version
tin on the atmospheric side of the glass) and are larger than that of SnO2. This can be understood if one considers that Sn atoms in the glass matrix are in a stronger ionic environment compared to the oxides. It is also evident that Sn on the atmospheric surface of the glass, which is presumably formed via precipitation from vapor phase, has an entirely different chemical nature (only 0.1 eV chemical shift).
The Sn on the surface of the conducting tin oxide glass exhibits a 0.6 eV chemical shift and hence has a resemblance to that of Sn on float-glasses. However, the Auger spectrum, as shown in the upper part of Fig. 2, and the X-ray diffraction pattern [9] suggest that it is a mixture of SnO and SnO2.
Sn depth profile
The ratio Sn/Si as determined from the Sn 3d5@2 and Si 2p lines of a 3 mm float glass are plotted in Fig. 3 as a function of the etching time using both Ar` and HF solution. The good fit to the semi-logarithmic plot in Fig. 4, is a demonstration that incorporation of Sn on-to the tin-bath surfaces is diffusion-controlled.
Acknowledgements This work is supported by TUBI0 TAK, the
Scientific and Technical Research Council of Turkey, through the project TBAG-U®-15/7 and the British Council Academic Link for Turkey Programme.
References
1. Morgan WE, Van Wazer JR (1973) J Phys Chem 77:964 2. Lau CT, Wertheim GK (1978) J Vac Sci Technol 15:622 3. Edgell RG, Eriksen S, Flavell WR (1986) Solid State Com
60: 835
4. Luo J, Xu C (1990) J Non Cryst Solids 119:37
5. Themlin JM, Chtaib M, Henrard L, Lambin P, Darville J, Caudano R, Gilles JM (1992) Phys Rev B 46:11914
6. Wagner CD, Gale LH, Raymond RH (1979) Anal Chem 51:466 7. Thomas TD, Weightman P (1986) Phys Rev B 33: 5406 8. Moretti G, Porta P (1991) Surf Interface Anal 20:675 9. Voscoboinikov T, Su¨zer S, (1995) J Phys Chem (submitted) 10. Colombin L, Charlier H, Jelli A, Debras G, Verbist J (1980)
J Non Cryst Solids 38:551
11. Chastain J (1992) Handbook of X-ray photoelectron spectro-scopy, Perkin-Elmer
.
![Fig. 3 Ratio of the Sn/Si concentration of a 3 mm float glass as a function of r etching time [min] (Ar `), s etching time [s] (2% HF)](https://thumb-eu.123doks.com/thumbv2/9libnet/5687706.114775/3.852.64.466.77.584/ratio-concentration-float-glass-function-etching-etching-time.webp)
