Analyzing perceived
healthcare service quality on
patient related outcomes
Aygül Turan
Department of Business Administration, Yildiz Technical University, Istanbul, Turkey, and
Tuba Bozaykut-Bük
School of Business and Management Sciences, Istanbul Medipol University, Istanbul, Turkey
Abstract
Purpose – Through the lens of a total quality management approach, this paper aims to examine the effects of health-care service quality on patient satisfaction, repatronage intention (RI) and positive word-of mouth (PWOM) at a public hospital specialized in women and children’s diseases. The contribution is to measure and compare patient expectations and perceptions related to the public health service quality.
Design/methodology/approach – A structured questionnaire was distributed to in-patients who stayed at a public training and research hospital for at least three days. To analyze the relationship between variables, multiple regression analysis was used. To test the difference between expected and perceived service quality, the paired-sample t-test was used.
Findings – The findings provided empirical evidence that perceived service quality significantly influenced patient satisfaction, RI and PWOM. The “responsiveness and reliability” factor was found to be the most influential on patient RI and PWOM. The “tangibility” dimension had the strongest influence on patient satisfaction.
Practical implications – The results reveal that a reliable and responsive service, empathic personnel behaviors and appropriate tangibles are the outstanding factors for high levels of patient satisfaction, RI and PWOM.
Originality/value – Although the concepts of perceived service quality, patient satisfaction, RI and PWOM are explored frequently in service literature, there are few researches that focus on specialized health services for women and children’s diseases. By evaluating the service quality, it is hoped to provide an insight to health-care managers about the service quality dimensions and their relationship with patient satisfaction, RI and PWOM, specifically based on women patients.
Keywords Health service quality, Patient satisfaction, Quality management, Positive word-of-mouth, Public hospital, Repatronate intention
Paper type Research paper
Introduction
Implementation of total quality management (TQM) has been regarded as a significant tool for an efficient and effective health-care service. According to the TQM approach, patients are the most important factor to investigate because health-care service quality
Both authors contributed equally to this study.
The current issue and full text archive of this journal is available on Emerald Insight at:
www.emeraldinsight.com/1756-669X.htm
IJQSS
8,4
478
Received 22 April 2015 Revised 3 January 2016 1 March 2016 Accepted 11 March 2016International Journal of Quality and Service Sciences Vol. 8 No. 4, 2016 pp. 478-497
© Emerald Group Publishing Limited 1756-669X
is mostly perceived, appreciated and transformed through patients and their needs (Lee
et al., 2013;Pakdil and Harwood, 2005). Furthermore, total quality practices in public health-care delivery systems are directly linked to patient satisfaction, rendering TQM a significant factor for sustainability and productivity.
The health-care sector has been criticized as being a late follower of total quality practices compared to other industries in Turkey. Especially, the companies operating in the Turkish private sector became the initiators of the TQM system. On the other hand, the health-care sector, acknowledged as a public service, embraced TQM only after recognizing the successful practice of private companies, especially within the manufacturing industry. Also, the complex structure of health-care services and the monopoly of public health-care delivery were counted as the main reasons behind the late TQM adoption.
The Turkish health-care sector started to be privatized in the 1980s, and TQM tools were put into practice by the new private health-care institutions in the 1990s. Working for the good of public health, this transformation also makes TQM a must for public hospitals to keep a standard, planned, responsive service with minimum costs and deficiencies. Over the past decade, Turkish public hospitals have been led by Ministry of Health programs and policies to achieve the required standardization and TQM practices.
In Turkey, the total quality programs are conducted according to Healthcare Ministry regulations, and health care is considered a public service in spite of the notable increase in the number of private hospitals established. Moreover, compared with their private competitors; the bureaucratic structure, together with heavy workloads induces public hospitals to fall behind their private competitors in service quality performance. As a result of these developments, recent quality programs have been conducted, and the efficiency of these efforts has become one of the main issues under debate in the Turkish health-care system.
To reveal the presence and outcomes of TQM practices in the Turkish health-care system, we have focused on a public hospital specializing in women and children’s diseases (HWCD). Apart from the gender of patients, literature differentiates HWCD from the other public hospitals (Goktas et al., 2005;Yagci and Duman, 2011). This type of hospital is differentiated from other hospitals by having women patients. Women’s needs in receiving a service differ from men’s in terms of their biological differences, lifestyle differences, attitude toward risk and institutional arrangements (De Jager and Grundling, 2007;Cafferata and Wilensky, 1983). Additionally, women’s expectations and perceptions related to service differ from men’s, as they have different biological and socio-psychological features (Sun and Qu, 2011).
Gender difference can be an influential factor when evaluating the dimensions of service quality. Although these concepts have been explored many times in service literature, it is seen that there are few studies that focus on women’s perception of health-care services. Following the previous research implications, we have aimed to integrate theory and practice by presenting a theoretical background on health-care service quality and conducting an empirical research at a public HWCD in Turkey. Present research also sheds light on the relationship between service quality and patient-related outcomes in terms of the perceived service quality, repatronage intention (RI) and positive word-of-mouth (PWOM), focusing on women patients.
479
Perceived
healthcare
service quality
Theoretical background
There are many interpretations and definitions of TQM. According to the International Organization for Standardization (ISO 8402, 1994), TQM is the process whereby the:
[…] management approach of an organization centers on quality, based on the participation of all its members aiming at long run success through customer satisfaction and benefits to all members of the organization and the society.
TQM is a fundamental management philosophy that comprises eight crucial components: customer focus, quality management of suppliers, employee involvement, training, quality leadership, quality measurement, quality policies and process improvement (Calabrese and Scoglio, 2012). On the other hand, the concept of TQM has been related with different terms in recent years such as business excellence, six sigma, lean production, etc. (Dahlgaard-Park, 2011; Dahlgaard and Dahlgaard-Park, 2006). Even if the concept has been designated with different terms, two components of TQM, employee involvement and customer focus, emerge as important and timeless elements in any quality movement (Kim et al., 2011). These are also vital for service firms characterized by a gradual interrelationship between customers and employees (Calabrese and Scoglio, 2012).
Following the customer focus standpoint, organizations face some difficulties in implementing adequate employee involvement for improving quality. In spite of the fact that TQM applauds the participation of employees (Tari, 2005), managers are not always successful in gaining the benefit of employee competence for enhancing quality (Beatson et al., 2008;Zhongjun et al., 2010). In fact, employees have specific knowledge that could be advantageous for organizations to attain the perception of technical and perceptual quality from customers in terms of their service experience. Thereby, to achieve continuous improvement, employee competencies and knowledge should be evaluated effectively (Zink, 2011) in accordance with the customer focus perception (Calabrese and Scoglio, 2012). At that point, service quality is a critical concept to illuminate the two most important components of TQM by involving employees in the quality process on the basis of customer demands. Along with this line of thinking, an emerging stream of work on TQM indicates that service quality brings some benefits to a service organization, such as raising productivity, cutting costs, maintaining customer loyalty, rising market share, etc. (Kandampully, 1998;Yang, 2006;Zeithaml et al., 1988).
Service quality can be defined as the difference between what is expected and what is perceived when the service is used (Bolton and Drew, 1991a;Camilleri and O’Callaghan, 1998;Oliver, 1980). Perceived service quality is set in the mind as soon as the service is received (Wong and Sohal, 2002). Therefore, it can be stated that perceived service quality is an attitude or a general long-term assessment in perception. It is related to the value assigned through the difference between what is received and what has to be given in exchange (Golicic and Donna, 2003).
Parasuraman et al. (1985)support the notion that service quality is an overall evaluation similar to an attitude, a manner whereby people have positive or negative thoughts toward individuals, objects or events. The main point here is that objective quality is the same according to all, whereas perceived quality differs from person to person.
IJQSS
8,4
Perceived quality is different from objective quality; it is a form of attitude, related but not equivalent to satisfaction, and results from comparison of expectations with perception of performance. (Parasuraman et al., 1985, p. 15) As a form of attitude, service quality is related to satisfaction that emerges as the difference between expectation and performance (Bolton and Drew, 1991b). From that perspective, it becomes difficult to draw a line between perceived service quality and satisfaction.Parasuraman et al. (1985, p. 15) explains the difference: “perceived service quality is a form of attitude, a long-run overall evaluation, whereas satisfaction is a transaction-specific measure”.
AfterParasuraman et al. (1985)clarified the relationship between perceived service quality and satisfaction, they defined theoretically and indicated empirically the concept of perceived service quality on the basis of five dimensions: tangibility, assurance, responsiveness, reliability and empathy. These dimensions are defined as follows:
(1) tangibility: the appearance of the physical environment, equipment, employees,
etc.;
(2) assurance: the employee expertise and knowledge for assuring trust for
customers;
(3) responsiveness: the ability to respond to customer demands accurately and
timely;
(4) reliability: the accuracy and consistency of service and ability to perform that
service; and
(5) empathy: the ability to understand other people’s feelings and problems.
There are plenty of studies defining and measuring perceived service quality through the five dimensions conducted in different fields in the service quality literature (Chen
et al., 2012;Kumar et al., 2009;Ramseook-Munhurrun et al., 2009;Theodorakis et al., 2013). In the case of the health-care industry, the applicability of the dimensions, together with their relation to patient-related outcomes (patient satisfaction, patient safety, repurchase intention and word-of mouth [WOM]), health staff-related outcomes (work satisfaction and employee commitment) and management outcomes (hospital efficiency with reduced operating costs, hospital performance) are examined in various studies. Contributing to the previous studies, we aim to examineParasuraman et al.’s (1985)service quality dimensions on patient satisfaction, PWOM and RI in a public health-care environment.
Patient satisfaction, repatronage intention and positive word-of-mouth
Satisfaction
The satisfaction taken from the specific service refers to “the post choice evaluative judgement” based on the “cumulative experience” of previously taken services (Yu et al., 2005, p. 710). As in many sectors, satisfaction is an important indicator and measure of service quality in health-care institutions. Furthermore, patient satisfaction is thought of as a major tool when taking critical decisions about health-care services (Gilbert et al., 1992). The basis of many service quality studies is the measurement of patient satisfaction or patients’ judgment about service quality (Babakus and Mangold, 1992;
Carman, 1990;Reidenbach and Sandifer-Smallwood, 1990;Zeithaml et al., 1993). It can also be stated that satisfaction is an attitude affected strongly by the perceived service quality (Cheng et al., 2003).
481
Perceived
healthcare
service quality
Lin and Clousing (1995), in their analysis of TQM applications in Northern Louisiana hospitals, supported empirically that there is a link between TQM implementation levels and patient satisfaction. Questioning the accuracy of the European Quality Assurance model in identifying quality progress and business performance of hospitals,
Kunst and Lemmink (2000)found that TQM improves patients’ perception of service quality. Another study conducted byRaja et al. (2007)to outline health-care process quality status compared quality awards given to health-care institutions. The study findings showed that physicians, nurses, technicians and patients evaluated hospital service sub-factors differently, and that award dimensions had influences on service quality development, with the implication of an improvement in satisfying patients’ needs and wants. Plus, customer satisfaction with service quality is empirically supported by the study. In line with the previous studies,Duggirala et al. (2008, p. 562), by examining the dimensions of patient-perceived total quality service and patients’ satisfaction, argued that patient satisfaction is “an outcome of care in itself”, linked to better patient compliance and better clinical outcomes.
Similarly,Kitapci et al. (2014)examined the effect of service quality dimensions on satisfaction together with the effect of satisfaction on WOM communication and RI. Their findings proved that satisfaction has a significant effect on WOM and RI, which are found to be strongly related in the study.
Following this study, we propose that:
H1. Perceived health-care service quality of the hospital is positively related to
patient satisfaction.
Repatronage intention
The terms repurchase or RI, customer retention and loyalty are generally considered identical terms, but they are distinct constructs with different meanings. For example,
Day (2000) states the difference between repeated behavior and loyalty in that the repeated behavior comes by sales, whereas the loyalty has to be earned by the service provider.
Service quality is an important indicator of the subsequent intentions and preferences of service takers (Bolton, 1998). Researchers often use the terms “repeat purchase intention”, “repurchase intention”, “purchase willingness” (Richardson et al., 1994) and “service patronage” (York, 1993), as well as “repeat patronage”, to mean customer retention (Ennew and Binks, 1996). Therefore, because of methodological reasons, we use the term RI instead of repurchase intention as our research is related to public medical service delivery.
Generally, RI is measured by asking customers if they would consider using the same health-care service again (Sherman, 1980). However,Rust et al.’s (1995)study indicates that repurchase intention does not always result in repurchase behavior. Rust and others advise researchers to take a statistical approach by looking at the previous recorded data.
According toBarber et al. (2011, p. 329), “consumer satisfaction can predict repeat patronage leading to brand loyalty and new consumers”. As in Barber et al. (2011)
research, there is an emerging stream of work explaining customers’ RI at the root of perceived service quality (Grewal et al., 2003; Lee et al., 2009;Leong and Kim, 2002;
Patterson et al., 2013;Qin and Prybutok, 2009).
IJQSS
8,4
Among the studies exploring the relationship between service quality and repurchase intention, Zeithaml et al. (1996) found that service quality positively influenced repurchase intention. Taking into account the previous studies, we propose the following hypothesis:
H2. Perceived health-care service quality of the hospital is positively related to
patient repatronage intention.
Positive word-of-mouth
PWOM and negative word-of-mouth are mainly studied by management and marketing scholars in the service industry literature. This multi-disciplinary interest in the concept results in many different variables related to WOM, such as purchase probability (Casielles et al., 2013), commitment (Ranaweera and Menon, 2013), satisfaction (Hong and Yang, 2009;Maxham, 2001) and service quality (Chaniotakis and Lymperopoulos, 2009;Kuo et al., 2013;Ng et al., 2011).
Narayandas and Bowman (2001, p. 296) define WOM as “whether customers tell anyone about their experience and how many people are told if a customer engages in word-of-mouth behavior”. PWOM means that the customer recommends the service to others by her/his positive evaluation of the service. PWOM is also described as a social behavior (Anderson and Mittal, 2000) affecting potential customer behavior. The previous studies also note that not every satisfied customer will have the orientation to recommend the satisfying service; conversely, the tendency to transfer bad experiences is observed more frequently (Wang, 2011). Especially in the health-care sector, patients may not have enough experience to assess the services and rely on others’ recommendations. Hence, former patients’ ideas about service experiences are noted as a significant sign (Narayandas and Bowman, 2001) for the health-care service preference.
Parasuraman et al. (199l, 1988) prove empirically that there exists a positive significant relationship between customers’ perception of service quality and their willingness to recommend the service. In their empirical study,De Matos and Rossi (2008)take WOM as a central construct and study the antecedents and moderators of WOM. Service quality is determined as one of the antecedents of WOM, and test results showed that the higher (lower) the perceived quality, the higher (lower) the WOM activity of the customers.
Evaluating the concept of service management and the perceived service quality framework, we propose the following hypothesis:
H3. Perceived health-care service quality of the hospital is positively related to
patient PWOM.
Methodology
The aim of the study
The problem statement of the study is to analyze how health-care service quality at a public training and research (HWCD) is perceived by patients and how this perception affects patients’ satisfaction, PWOM and RI in relation to the health-care services taken. In line with the inquiry, it is hoped to ascertain if the service quality provided by the hospital can meet patients’ service quality expectations. Moreover, the service quality
483
Perceived
healthcare
service quality
sub-dimensions that most affect patient satisfaction and attitudes are examined in the study.
Sample
Our research focuses on an HWCD to illustrate the patients’ perceived service quality, satisfaction, RI and PWOM. Our sample is unique in two ways. The first specialty of our sample is that by focusing on a public training and research HWCD, we hope to elucidate how women patients evaluate the health-care services. The second attribute is that there are only two hospitals for gynecological and pediatric diseases in Istanbul, Turkey. So, investigating one of them makes it possible to generalize our research findings about the service quality and its related outcomes to HWCD in Istanbul, Turkey.
The in-patients who stayed at the public training and research HWCD for at least three days were taken as the sample of the study. The data for the study were collected through a questionnaire. A total of 173 questionnaires were distributed, and 126 patients participated in the study, a response rate of 73 per cent.
The measurement instruments
The independent variables of the study take their origins from Parasuraman et al.’s (1988)study, and the sub-dimensions related to service quality are tangibles, reliability, responsiveness, assurance and empathy. The patient satisfaction, RI and PWOM constitute the dependent variables of our study.
The expected and the perceived service quality were measured through Carman (1990)andCronin and Taylor’s (1994)adaptation of Parasuraman’s SERVQUAL scale (1988) to health-care services. As inSchoenfelder et al.’s (2011)research, RI, PWOM and patient satisfaction were measured through single-item questions.
The data collected were analyzed through SPSS 16 program. In the analysis process, first, the frequencies of the demographic dimensions are examined. Later, factor and reliability analyses are conducted to find out which dimensions are most chosen by the participants in the research. Finally, multiple regression analysis is used to examine the relationship between variables, and a paired-sample t-test is used for comparing the expected and perceived service quality.
Findings
According to demographic data, of the 126 respondents, 84 per cent were females, 53.6 per cent were between the ages of 26 and 35, 64.6 per cent were primary school graduates, 68.5 per cent were housewives and 61 per cent were child in-patients (Table I). In total, 42 participants (35.3 per cent) evaluated health services taken at the Woman and Child Diseases Research and Educational Hospital as “very good”, whereas only four and eight patients evaluated the services as “bad” and “very bad”, respectively. Thus, the general satisfaction level of the patients was found to be very close to “very good”.
Furthermore, 82 patients (67.8 per cent) stated that they would consider using health services from the hospital again, whereas only one patient claimed that she had no intention of taking the services. Also, 9.1 per cent of the participants stated that it did not matter whether they took services.
Of all the patients, 60.8 per cent responded that they would recommend the services provided at that hospital. On the other hand, it is worth noting that none of the participants agreed with the statement “I strongly do not recommend”, and only one
IJQSS
8,4
patient chose the option of not recommending the hospital’s services. In other words, the majority of the patient participants (76 people) replied that they would recommend the services of that hospital.
Comparing expected and perceived service quality through paired sample t-test
Before taking the treatment, each patient has an expectation about the health-care delivery. With that expectation in mind, the patient undergoes the treatment, and, after that, the patient’s perception of that service is formed. If the patient finds the service performance closer to what (s)he expected, the service quality perception would be high. To take it one step further, the perceived service quality level is accepted as an important indicator of satisfaction (Parasuraman et al., 1988).
In line with this theoretical background, patients’ expectations and their service quality perceptions were compared using a paired sample t-test of the SERVQUAL scale.
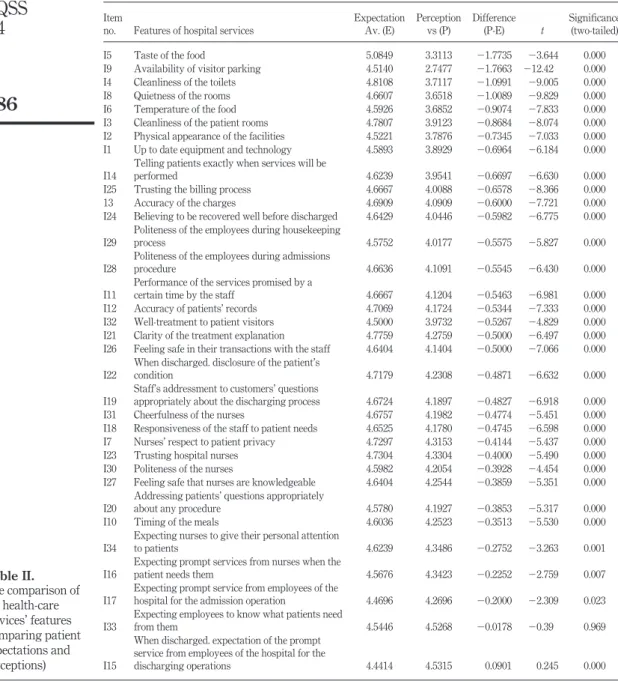
The items inTable IIare listed from the lowest to the highest value. The patients’ expectations of the tangibles such as food served, room cleanliness and room quietness were found to be most poorly met when compared to other service quality variables. On the other hand, “in the process of discharge, expectation of prompt service from hospital
Table I. Demographics of the sample
Variable No. of patients (%)
Gender Male 20 (16) Female 105 (84) Age (years) Up to 25 33 (26) 26-35 67 (53.6) 36-45 16 (13) 46-55 54 Above 55 4 (3) Education Primary education 77 (64.6) High school 30 (24.8) Associate degree 12 (9.9) University 2 (1.7) Occupation Housewives 63 (68.5) Other 29 (31.5) Income Under 1000 TL 67 (67.3) 1000-2000 TL 28 (27.7) Above 2000 TL 5 (5) Department Pediatrics 63 (61) Gynecology 24 (23)
485
Perceived
healthcare
service quality
staff for the discharging operations” (Item 15) is the only variable that has a higher value than expected. All other variables have values lower than expected.
When examining t-test results, it is evident that most of the expected and perceived items have close values and the participants mainly chose the option “mostly agree”. According to the significance levels, except Item 33, there is a
Table II. The comparison of the health-care services’ features (comparing patient expectations and perceptions) Item
no. Features of hospital services
Expectation Av. (E) Perception vs (P) Difference (P-E) t Significance (two-tailed) I5 Taste of the food 5.0849 3.3113 ⫺1.7735 ⫺3.644 0.000 I9 Availability of visitor parking 4.5140 2.7477 ⫺1.7663 ⫺12.42 0.000 I4 Cleanliness of the toilets 4.8108 3.7117 ⫺1.0991 ⫺9.005 0.000 I8 Quietness of the rooms 4.6607 3.6518 ⫺1.0089 ⫺9.829 0.000 I6 Temperature of the food 4.5926 3.6852 ⫺0.9074 ⫺7.833 0.000 I3 Cleanliness of the patient rooms 4.7807 3.9123 ⫺0.8684 ⫺8.074 0.000 I2 Physical appearance of the facilities 4.5221 3.7876 ⫺0.7345 ⫺7.033 0.000 I1 Up to date equipment and technology 4.5893 3.8929 ⫺0.6964 ⫺6.184 0.000 I14
Telling patients exactly when services will be
performed 4.6239 3.9541 ⫺0.6697 ⫺6.630 0.000
I25 Trusting the billing process 4.6667 4.0088 ⫺0.6578 ⫺8.366 0.000 13 Accuracy of the charges 4.6909 4.0909 ⫺0.6000 ⫺7.721 0.000 I24 Believing to be recovered well before discharged 4.6429 4.0446 ⫺0.5982 ⫺6.775 0.000 I29
Politeness of the employees during housekeeping
process 4.5752 4.0177 ⫺0.5575 ⫺5.827 0.000
I28
Politeness of the employees during admissions
procedure 4.6636 4.1091 ⫺0.5545 ⫺6.430 0.000
I11
Performance of the services promised by a
certain time by the staff 4.6667 4.1204 ⫺0.5463 ⫺6.981 0.000 I12 Accuracy of patients’ records 4.7069 4.1724 ⫺0.5344 ⫺7.333 0.000 I32 Well-treatment to patient visitors 4.5000 3.9732 ⫺0.5267 ⫺4.829 0.000 I21 Clarity of the treatment explanation 4.7759 4.2759 ⫺0.5000 ⫺6.497 0.000 I26 Feeling safe in their transactions with the staff 4.6404 4.1404 ⫺0.5000 ⫺7.066 0.000 I22
When discharged. disclosure of the patient’s
condition 4.7179 4.2308 ⫺0.4871 ⫺6.632 0.000
I19
Staff’s addressment to customers’ questions
appropriately about the discharging process 4.6724 4.1897 ⫺0.4827 ⫺6.918 0.000 I31 Cheerfulness of the nurses 4.6757 4.1982 ⫺0.4774 ⫺5.451 0.000 I18 Responsiveness of the staff to patient needs 4.6525 4.1780 ⫺0.4745 ⫺6.598 0.000 I7 Nurses’ respect to patient privacy 4.7297 4.3153 ⫺0.4144 ⫺5.437 0.000 I23 Trusting hospital nurses 4.7304 4.3304 ⫺0.4000 ⫺5.490 0.000 I30 Politeness of the nurses 4.5982 4.2054 ⫺0.3928 ⫺4.454 0.000 I27 Feeling safe that nurses are knowledgeable 4.6404 4.2544 ⫺0.3859 ⫺5.351 0.000 I20
Addressing patients’ questions appropriately
about any procedure 4.5780 4.1927 ⫺0.3853 ⫺5.317 0.000 I10 Timing of the meals 4.6036 4.2523 ⫺0.3513 ⫺5.530 0.000 I34
Expecting nurses to give their personal attention
to patients 4.6239 4.3486 ⫺0.2752 ⫺3.263 0.001 I16
Expecting prompt services from nurses when the
patient needs them 4.5676 4.3423 ⫺0.2252 ⫺2.759 0.007 I17
Expecting prompt service from employees of the
hospital for the admission operation 4.4696 4.2696 ⫺0.2000 ⫺2.309 0.023 I33
Expecting employees to know what patients need
from them 4.5446 4.5268 ⫺0.0178 ⫺0.39 0.969
I15
When discharged. expectation of the prompt service from employees of the hospital for the
discharging operations 4.4414 4.5315 0.0901 0.245 0.000
IJQSS
8,4
meaningful difference between what was expected and what was perceived as hospital service quality (Q33; p⫽ 0,969). All p-values, except that of Item 33, are lower than the significance level (p⬍ 0.05).
Results
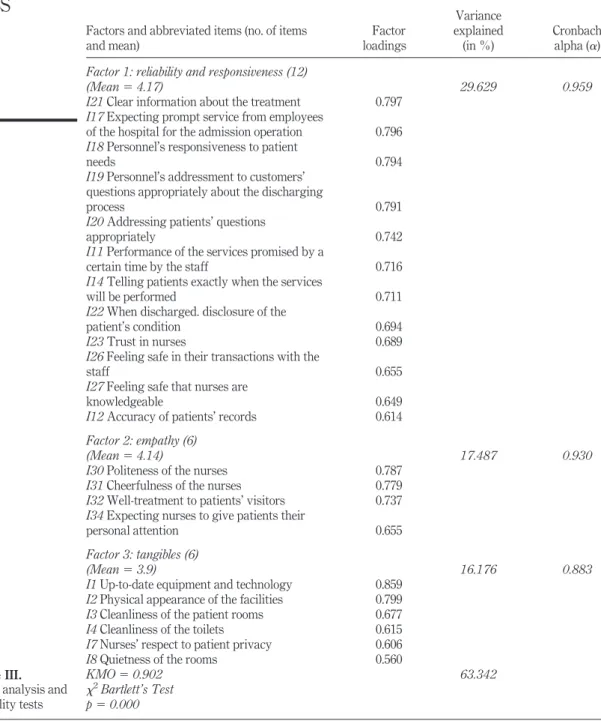
The Kaiser–Meyer–Olkin (KMO) value of the service quality scale is 0.902, and Bartlett’s test of sphericity is 0.000 (0.000⬍ 0.05), meaning that there are patterns of correlations among the variables and factor analysis can be conducted for the variables. Through factor analysis, items with the lowest factor loadings, factors listed under more than one factor and single items are eliminated. After factor and reliability analyses, four factors with the KMO value 0.902 explain 63.3 per cent of the perceived service quality.
Factor loadings of the items to the related factor, percentage variance for each factor and reliability coefficients of the items loaded on each factor are presented inTable III. The factor structure has three main factors, namely, reliability and responsiveness; empathy; and tangibility. The first factor, reliability and responsiveness, was formed as a synthesis of responsiveness and reliability, underlining the fact that patients require a timely, responsive and trustful service. The items are related to keeping promises, answering questions concerning immediate care and ability to rely on the personnel. The second factor, empathy, connotes the behavioral attitudes of personnel and how they approach the patients’ feelings; and tangibility, the third factor, is related to room facilities, equipment and technology.
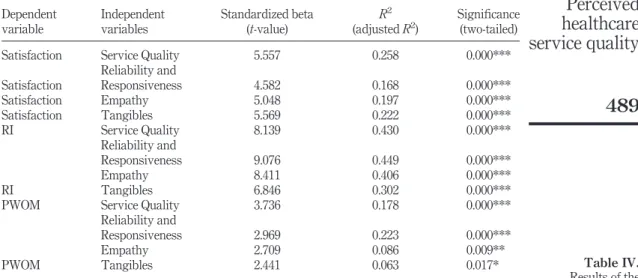
The multiple regression analysis showed that H1 is accepted, and the perceived service quality explains 26 per cent (Adj. R2⫽ 0.258) variation in the overall patient satisfaction. Regressing the three dimensions together, it is demonstrated that “tangibles” is the only dimension influencing patient satisfaction (p⫽ 0.036). The other two factors are not statistically significant (reliability and responsiveness ⫽ 0.816; empathy⫽ 0.135). When analyzing the dimensions singly through simple regression, once again, “tangibles” is the dimension having the most significant impact on patient satisfaction (adjusted R2⫽ 22.2 per cent; p ⫽ 0.000). “Empathy” is the second most influential factor (adjusted R2⫽ 19.7 per cent; p ⫽ 0.000), followed by “responsiveness and reliability” (adjusted R2⫽ 16.8 per cent; p ⫽ 0.000).
H2 is accepted, as the service quality dimensions collectively explain a total of 43 per
cent of RI (adjusted R2⫽ 43.0 per cent; p ⫽ 0.00). The most influential dimension on patient satisfaction is “reliability and responsiveness” (adjusted R2⫽ 44.9 per cent; p ⫽ 0.000), followed by “empathy” (adjusted R2⫽ 40.6 per cent; p ⫽ 0.000) and “tangibles” (adjusted R2⫽ 30.2 per cent; p ⫽ 0.000). When regressed together, it is found out that the
strong influence of “reliability and responsiveness” surpasses other two dimensions by being the single dimension affecting RI (adjusted R2⫽ 44.6 per cent; p ⫽ 0.001).
The service quality explains 17.8 per cent variance of PWOM (adjusted R2⫽ 0.178;
p⫽ 0.000); hence, H3 is also accepted. All three dimensions significantly influenced the
dependent variable, and the most influential dimension is “reliability and responsiveness” (adjusted R2⫽ 22.3 per cent; p ⫽ 0.00). “Empathy” (adjusted R2⫽ 8.6
per cent; p⫽ 0.000) and “tangibles” (adjusted R2⫽ 6.3 per cent; p ⫽ 0.000) are found to
affect PWOM. All the results of the regression analyses conducted are indicated in
Table IV.
487
Perceived
healthcare
service quality
Table III. Factor analysis and reliability tests
Factors and abbreviated items (no. of items and mean) Factor loadings Variance explained (in %) Cronbach alpha (␣) Factor 1: reliability and responsiveness (12)
(Mean⫽ 4.17) 29.629 0.959
I21 Clear information about the treatment 0.797 I17 Expecting prompt service from employees
of the hospital for the admission operation 0.796 I18 Personnel’s responsiveness to patient
needs 0.794
I19 Personnel’s addressment to customers’ questions appropriately about the discharging
process 0.791
I20 Addressing patients’ questions
appropriately 0.742
I11 Performance of the services promised by a
certain time by the staff 0.716
I14 Telling patients exactly when the services
will be performed 0.711
I22 When discharged. disclosure of the
patient’s condition 0.694
I23 Trust in nurses 0.689
I26 Feeling safe in their transactions with the
staff 0.655
I27 Feeling safe that nurses are
knowledgeable 0.649
I12 Accuracy of patients’ records 0.614 Factor 2: empathy (6)
17.487 0.930
(Mean⫽ 4.14)
I30 Politeness of the nurses 0.787
I31 Cheerfulness of the nurses 0.779
I32 Well-treatment to patients’ visitors 0.737 I34 Expecting nurses to give patients their
personal attention 0.655
Factor 3: tangibles (6)
16.176 0.883
(Mean⫽ 3.9)
I1 Up-to-date equipment and technology 0.859 I2 Physical appearance of the facilities 0.799 I3 Cleanliness of the patient rooms 0.677
I4 Cleanliness of the toilets 0.615
I7 Nurses’ respect to patient privacy 0.606
I8 Quietness of the rooms 0.560
KMO⫽ 0.902 63.342 2Bartlett’s Test p⫽ 0.000
IJQSS
8,4
488
Discussion
Enforced by the competitive forces in the industry, health-care institutions adopted TQM practices for satisfied service users, “providing the best care at the lowest costs” (Brashier et al., 1996, p. 32). The health institutions acknowledge their differences from the other service sector organizations through implementing TQM practices and tools in their industry-unique manner (Komashie et al., 2007). TQM implementation in the health-care context covers professional knowledge, competence, application of appropriate technology and the patients’ perception of the type and level of care they received.
In our study, the factor analysis results show a variation from the five-factor model of the original SERVQUAL (Ladhari, 2009). This results echoedYesilada and Direktor’s (2010) study findings, as their factor analysis revealed a three-factored structure; reliability-confidence, empathy and tangibles. We argue that variation from the original model is related to our sample and our research setting HWCD, and these three factors can be used in similar health-care service quality studies in the future.
In our findings, patients evaluated the health services they received very positively when asked about overall satisfaction, RI and PWOM. The acceptance of H1 of the study confirms the contention ofParasuraman et al. (1985,1988) that the higher the perceived service quality, the higher the customer satisfaction. Similarly, Gooding (1999), in his study on the correlation between medical service quality and its value with 260 test medical service consumers, explains that a medical service consumer assesses the value through service quality. Sivakumar and Srinivasan’s (2010) concept of “encounter satisfaction”, which is satisfaction that consumers experience with a particular service incident, and overall satisfaction with the service provider are dependent on the number of service encounters with different parts of the organization or different employees within the organization over multiple service experiences. Furthermore, Mooradian and Oliver (1997) underlined that satisfied customers can
Table IV. Results of the regression analyses Dependent variable Independent variables Standardized beta (t-value) R2 (adjusted R2) Significance (two-tailed)
Satisfaction Service Quality 5.557 0.258 0.000***
Satisfaction Reliability and Responsiveness 4.582 0.168 0.000*** Satisfaction Empathy 5.048 0.197 0.000*** Satisfaction Tangibles 5.569 0.222 0.000*** RI Service Quality 8.139 0.430 0.000*** RI Reliability and Responsiveness 9.076 0.449 0.000*** Empathy 8.411 0.406 0.000*** Tangibles 6.846 0.302 0.000***
PWOM Service Quality 3.736 0.178 0.000***
PWOM
Reliability and
Responsiveness 2.969 0.223 0.000***
Empathy 2.709 0.086 0.009**
Tangibles 2.441 0.063 0.017*
Notes: Significance levels (two-tailed): * pⱕ 0.05; **p ⱕ 0.01; ***p ⱕ 0.001; n ⫽ 126
489
Perceived
healthcare
service quality
increase profitability by providing new referrals through PWOM, acting as unpaid ambassadors for the service provider’s business.
When health care is taken into consideration, the most important expectation is that service is given accurately and reliably. Our research showed that the “reliability and responsiveness” dimension was of primary importance, and “tangibles” was the third most important factor for patient repatronage and PWOM. A noteworthy finding was that patients evaluated “tangibles” as the most important indicator of satisfaction. According to t-test results, among the tangible items, the equipment and the room facilities had the greatest impact on satisfaction. The importance of tangibles on satisfaction has also been confirmed byGulmez and Kitapci’s (2008)study, revealing that “tangibles” is the main factor to explain in-patient satisfaction. It becomes clear that the feature of medical instruments and the appearance of the rooms are appreciated as significant signs of health-care service quality in our case of a public HWCD. In the study, expectations related to the physical attributes of health care can also be related to the demographic qualities of the participants. The participants are mostly from the low-income segment that cannot afford to take private health-care services and instead pursue public services. Therefore, we can assume that the socio-economic conditions of the participants may influence their evaluation of service quality.
The participants in our study identified “empathy” as the second indicator for satisfaction and RI. The relationship between health-care personnel and patients is very intimate and secluded. Therefore, when health care is taken into consideration, the personnel should give special importance to patients’ fragile conditions and behave in an empathic manner. Also, Sivakumar and Srinivasan’s (2010) results confirm our findings, as “quality dimensions assurance, reliability, responsiveness, and empathy are strong determinants of hospital consumers’ satisfaction with hospital services”. Moreover, the t-tests make it clear that the participants’ expectations related to the behaviors of health-care personnel were not properly met. The reason behind this finding could be that the public hospital personnel, compared to those in private health-care institutions, offer less care and concern to the patients because of the heavy work load.
In this study, we measured patients’ satisfaction in two distinct ways. One was to evaluate the difference between the expected and perceived service quality, and the other was to ask respondents about their general satisfaction concerning the services they received. When generally asked, patients reflect satisfaction; however, the comparison between the expected and perceived service did not support their reassurance with the services. The service quality was evaluated lower than the average expected, as the “tangible” items’ values of paired t-tests turned out to be far from meeting patient needs. On the other hand, in the regression analyses, “tangibles” was the most important factor for satisfaction.
The finding of “tangibles” as the most influential factor not only marks the importance of the physical environment of the healthcare organization for the service users but also supports many empirical studies providing evidence of the influence of physical attributes on patient satisfaction. Bitner (1990,1992) is one such researcher, arguing that the physical atmosphere of a work environment affects both employees and customers of the workplace in question. Her introduction of the term “servicescape” (1992) to the literature underlines the physical environment’s influence in reflecting the service quality to the audience. In
IJQSS
8,4
terms of health-care settings,Dagger and Sweeney (2007)discuss that tangibles are mostly evaluated at the beginning of the health-care service experience and are significantly more important to new customers. Similarly,Karassavidou et al. (2009)
explain the effect of tangibles on satisfaction levels with the argument that lacking the ability to evaluate the expertise of the physicians, patients are more inclined to assess the tangible elements of the health-care service. In line with the previous studies and our study findings, we can suggest that positively assessed tangible service elements such as cleanliness and quiet rooms can also lead to positive evaluations of health-care service quality.
Conclusion and implications
The never-ending search for health-care service quality has long been on the agenda of health-care managers and administrators. Our study findings demonstrate significant criteria for service quality evaluation and its related outcomes for public health services. First of all, public health-care administrators should pay special attention to offering accurate, reliable and responsive services to their patients. Responsiveness has always been a weak part and a factor criticized negatively in public health-care delivery organizations when compared to their private counterparts. It becomes obvious that public health-care service users give more importance to an accurate and reliable service than other factors when receiving a health-care service. It is important for patients to feel secure and confident as they hand their health to professionals assuming that they would not be deceived mentally, morally or financially.
Another implication is that the health-care service providers should give special care to tangibility when they are offering their services. Tangibility in public health care is also proved to be an important indicator for patient satisfaction; hence, service quality of food served, parking facilities, room cleanliness and equipment used needs permanent enhancement and control. The finding of tangibility as an important factor can also be related to the specifics of our sample and the service they use. That is to say, women patients evaluated tangibility as an important factor when they were taking gynecological and pediatric health services.
Our findings are in line with many studies that have found out a strong association between perceived service quality and patient satisfaction, PWOM and repatronage. In addition, the findings of this study offer reasonable support to the model of behavioral consequences of service quality developed byZeithaml et al. (1996), as five service quality dimensions predicted, to a modest extent, the hospital consumers’ satisfaction, RI and PWOM communication.
Turkish public health care has always been criticized as being administered by physicians not experienced or educated in public service management. Therefore, a final implication is that to deliver and improve the public health-care service, public policy legislators should envision TQM as a continuous process and take encouraging action to provide accurate, reliable and responsive services. Moreover, to increase the patient satisfaction, RI and PWOM, continuous education plans and programs should be introduced for improved hospital management.
Examining a public research and training HWCD for our study renders it difficult to make generalizations about the service quality offered by the Turkish public health-care system. The number of public hospitals examined can be increased, and
491
Perceived
healthcare
service quality
dimensions related to physicians, their medical knowledge and expertise can also be studied as service quality dimensions in the further studies. Furthermore, researchers in the further studies can examine other types of hospitals – private, university or educational research hospitals – and make comparisons to study the service quality dimensions and their effects on patient satisfaction and intentions.
References
Anderson, W.E. and Mittal, V. (2000), “Strengthening the satisfaction-profit chain”, Journal of
Service Research, Vol. 3 No. 2, pp. 107-120.
Babakus, E.W. and Mangold, G. (1992), “Adapting the SERVQUAL scale to hospital services: an empirical investigation”, Health Services Research, Vol. 26 No. 6, pp. 767-786.
Barber, N., Goodman, R.J. and Goh, B.K. (2011), “Restaurant consumers repeat patronage: a service quality concern”, International Journal of Hospitality Management, Vol. 30 No. 2, pp. 329-336.
Beatson, A., Lings, I. and Gudergan, S. (2008), “Employee behavior and relationship quality: impact on customers”, The Service Industries Journal, Vol. 28 No. 2, pp. 211-223.
Bitner, M.J. (1990), “Evaluating service encounters: the effects of physical surroundings and employee responses”, Journal of Marketing, Vol. 54 No. 2, pp. 69-82.
Bitner, M.J. (1992), “Servicescapes: the impact of physical surroundings on customers and employees”, Journal of Marketing, Vol. 56 No. 2, pp. 57-71.
Bolton, R.N. (1998), “A dynamic model of the duration of the customer’s relationship with a continuous service provider”, Marketing Science, Vol. 17 No. 1, pp. 45-66.
Bolton, R.N. and Drew, J.H. (1991a), “A multistage model of customers’ assessments of service quality and value”, Journal of Consumer Research, Vol. 17 No. 4, pp. 375-384.
Bolton, R.N. and Drew, J.H. (1991b), “A longitudinal analysis of the impact of service changes on customer attitude”, Journal of Marketing, Vol. 55 No. 1, pp. 1-9.
Brashier, L.W., Sower, V.E., Motwani, J. and Savoie, M. (1996), “Implementation of TQM/CQI in the health-care industry: a comprehensive model”, Benchmarking for Quality Management
and Technology, Vol. 3 No. 2, pp. 31-50.
Cafferata, G.L. and Wilensky, G.R. (1983), “Women and the use of health services”, American
Economic Review, Vol. 73 No. 3, pp. 128-133.
Calabrese, A. and Scoglio, F. (2012), “Reframing the past: a new approach in service quality assessment”, Total Quality Management & Business Excellence, Vol. 23 Nos 11/12, pp. 1329-1343.
Camilleri, D. and O’Callaghan, M. (1998), “Comparing public and private hospital care service quality”, International Journal of Health Care Quality Assurance, Vol. 11 No. 4, pp. 127-133. Carman, J.M. (1990), “Customer perceptions of service quality: an assessment of the servqual
dimensions”, Journal of Retailing, Vol. 66 No. 1, pp. 33-55.
Casielles, R.V., Álvarez, L.S. and del Río Lanza, A.B. (2013), “The word of mouth dynamic: how positive (and Negative) WOM drives purchase probability: an analysis of interpersonal and non-interpersonal factors”, Journal of Advertising Research, Vol. 53 No. 1, pp. 43-60. Chaniotakis, I.E. and Lymperopoulos, C. (2009), “Service quality effect on satisfaction and word of
mouth in the health care industry”, Managing Service Quality, Vol. 19 No. 2, pp. 229-242. Chen, H.G., Liu, J.Y.C., Sheu, T.S. and Yang, M.H. (2012), “The impact of financial services quality
and fairness on customer satisfaction”, Managing Service Quality, Vol. 22 No. 4, pp. 399-421.
IJQSS
8,4
Cheng, S.H., Yang, M.C. and Chiang, T.L. (2003), “Patient satisfaction with and recommendation of a hospital: effects of interpersonal and technical aspects of hospital care”, International
Journal for Quality in Health Care, Vol. 15 No. 4, pp. 345-355.
Cronin, J.J. and Taylor, S.A. (1994), “Servperf versus servqual: reconciling performance-based and perceptions-minus-expectations measurement of service quality”, Journal of Marketing, Vol. 58 No. 1, pp. 125-131.
Dagger, T.S. and Sweeney, J.C. (2007), “Service quality attribute weights: how do novice and longer-term customers construct service quality perceptions?”, Journal of Service Research, Vol. 10 No. 1, pp. 22-42.
Dahlgaard, J.J. and Dahlgaard-Park, S.M. (2006), “Lean production, six sigma quality, TQM and company culture – a critical review”, The TQM magazine – The International Review of
Organizational Improvement, Vol. 18 No. 3, pp. 263-281.
Dahlgaard-Park, S.M. (2011), “The quality movement: where are you going?”, Total Quality
Management & Business Excellence, Vol. 22 No. 5, pp. 493-516.
Day, G. (2000), “Tying in a asset: the art of building a lasting relationship, understanding CRM”,
Financial Times, pp. 2-4.
De Jager, J. and Grundling, J. (2007), “Managerial challenges toward unequal gender treatment in South Africa”, Journal of African Business, Vol. 8 No. 1, pp. 45-66.
De Matos, C.A. and Rossi, C.A.V. (2008), “Word-of-mouth communications in marketing: a meta-analytic review of the antecedents and moderators”, Journal of the Academy of
Marketing Science, Vol. 36 No. 4, pp. 578-596.
Duggirala, M., Rajendran, C. and Anantharaman, R.N. (2008), “Patient-perceived dimensions of total quality service in healthcare”, Benchmarking: An International Journal, Vol. 15 No. 5, pp. 560-583.
Ennew, C.T. and Binks, M.R. (1996), “The impact of service quality and service characteristics on customer retention: small businesses and their banks in the UK”, Journal of Management, Vol. 7 No. 3, pp. 219-230.
Gilbert, F.W., Lumpkin, J.R. and Dant, R.P. (1992), “Adaptation and customer expectation of health care options”, Journal of Health Care Marketing, Vol. 12 No. 3, pp. 46-55.
Goktas, B., Aslan, G., Aslantekin, F. and Erdem, R. (2005), “Örgüt kültürü ve Dr. Ekrem Hayri U¨ stündag˘ kadın hastalıkları ve dog˘um hastanesi örneg˘i”, Hacettepe Sag˘lık I˙daresi Dergisi, Vol. 8 No. 3, pp. 351-372.
Golicic, S.L. and Donna, F.D. (2003), “Hypermediaries in the supply chain: for better or for worse”,
Business Horizons, Vol. 46 No. 3, pp. 77-82.
Gooding, S.K. (1999), “Quality, sacrifice and value in hospital choice: a comparative study of rural and suburban consumer perspectives”, Journal of Health Care Marketing, Vol. 13 No. 2, pp. 24-42.
Grewal, D., Baker, J., Levy, M. and Voss, G.B. (2003), “The effects of wait expectations and store atmosphere evaluations on patronage intentions in service-intensive retail stores”, Journal
of Retailing, Vol. 79 No. 4, pp. 259-268.
Gulmez, M. and Kitapci, O. (2008), “Hastane hizmet kalitesi ve bir uygulama”, H.U. Iktisadi Idari
Bilimler Fakultesi Dergisi, Vol. 26 No. 6, pp. 165-186.
Hong, S.Y. and Yang, S.U. (2009), “Effects of reputation, relational satisfaction, and customer– company identification on positive word-of-mouth intentions”, Journal of Public Relations
Research, Vol. 21 No. 4, pp. 381-403.
ISO 8402 (1994), “Quality management and quality assurance – vocabulary”, available at:www. iso.org/iso/catalogue_detail.htm?csnumber⫽20115
493
Perceived
healthcare
service quality
Kandampully, J. (1998), “Service quality to service loyalty: a relationship which goes beyond customer services”, Total Quality Management, Vol. 9 No. 6, pp. 431-443.
Karassavidou, E., Glaveli, N. and Papadopoulos, C.T. (2009), “Quality in NHS hospitals: no one knows better than patients”, Measuring Business Excellence, Vol. 13 No. 1, pp. 34-46. Kim, Y.K., Kim, Y.B. and Lee, Y. (2011), “Perceived service quality for South Korean domestic
airlines”, Total Quality Management & Business Excellence, Vol. 22 No. 10, pp. 1041-1056. Kitapci, O., Akdogan, C. and Dortyol, I.T. (2014), “The impact of service quality dimensions on patient satisfaction, repurchase intentions and word-of-mouth communication in the public healthcare industry”, Procedia – Social and Behavioral Sciences in 2nd International
Conference on Strategic Innovative Marketing Conference in Prague, Czech Republic,
Vol. 148, pp. 161-169.
Komashie, A., Mousavi, A. and Gore, J. (2007), “Quality management in healthcare and industry: a comparative review and emerging themes”, Journal of Management History, Vol. 13 No. 4, pp. 359-370.
Kumar, M., Kee, F.T. and Manshor, A.T. (2009), “Determining the relative importance of critical factors in delivering service quality of banks: an application of dominance analysis in SERVQUAL model”, Managing Service Quality, Vol. 19 No. 2, pp. 211-228.
Kunst, P. and Lemmink, J. (2000), “Quality management and business performance in hospitals: a search for success parameters”, Total Quality Management, Vol. 11 No. 8, pp. 1123-1333. Kuo, Y.F., Hu, T.L. and Yang, S.C. (2013), “Effects of inertia and satisfaction in female online
shoppers on repeat-purchase intention: the moderating roles of word-of-mouth and alternative attraction”, Managing Service Quality, Vol. 23 No. 3, pp. 168-187.
Ladhari, R. (2009), “A review of twenty years of SERVQUAL research”, International Journal of
Quality and Service Science, Vol. 1 No. 2, pp. 172-198.
Lee, H.J., Fairhurst, A.E. and Lee, M.Y. (2009), “The importance of self-service kiosks in developing consumers’ retail patronage intentions”, Managing Service Quality, Vol. 19 No. 6, pp. 687-701.
Lee, S.M., Lee, D. and Olson, D.L. (2013), “Health-care quality management using the MBHCP excellence model”, Total Quality Management and Business Excellence, Vol. 24 Nos 1/2, pp. 119-137.
Leong, J.K. and Kim, W.G. (2002), “Service recovery efforts in fast food restaurants to enhance repeat patronage”, Journal of Travel and Tourism Marketing, Vol. 12 Nos 2/3, pp. 65-93. Lin, B. and Clousing, J. (1995), “Total quality management in healthcare: a survey of current
practices”, Total Quality Management, Vol. 6 No. 1, pp. 69-78.
Maxham, J.G. (2001), “Service recovery’s influence on consumer satisfaction, positive word-of-mouth, and purchase intentions”, Journal of Business Research, Vol. 54 No. 1, pp. 11-24.
Mooradian, T. and Oliver, J. (1997), “I can’t get no satisfaction: the impact of personality and emotion on post purchase process”, Psychology and Marketing, Vol. 14 No. 4, pp. 379-393. Narayandas, D. and Bowman, D. (2001), “Managing customer- initiated contacts with
manufacturers: the ımpact on share of category requirements and wordof- mouth behavior”, Journal of Marketing Research, Vol. 38 No. 3, pp. 281-297.
Ng, S., David, M.E. and Dagger, T.S. (2011), “Generating positive word-of-mouth in the service experience”, Managing Service Quality, Vol. 21 No. 2, pp. 133-151.
Oliver, R.L. (1980), “A cognitive model of the antecedents and consequence of satisfaction decisions”, Journal of Marketing Research, Vol. 17 No. 4, pp. 460-469.
IJQSS
8,4
Pakdil, F. and Harwood, T.N. (2005), “Patient satisfaction in a preoperative assessment clinic: an analysis using SERVQUAL dimensions”, Total Quality Management and Business
Excellence, Vol. 16 No. 1, pp. 15-30.
Parasuraman, A., Berry, L.L. and Zeithaml, V.A. (1988), “SERVQUAL: a multiple item scale for measuring consumer perceptions of service quality”, Journal of Retailing, Vol. 64 No. 1, pp. 12-40.
Parasuraman, A., Berry, L.L. and Zeithaml, V.A. (1991), “Refinement and reassessment of the SERVQUAL Scale”, Journal of Retailing, Vol. 67 No. 4, pp. 420-450.
Parasuraman, A., Zeithaml, V.A. and Berry, L.L. (1985), “A conceptual model of service quality and its implications for future research”, Journal of Marketing, Vol. 49 No. 4, pp. 41-50. Patterson, B.J., Doucette, W.R., Urmie, J.M. and McDonough, R.P. (2013), “Exploring relationships
among pharmacy service use, patronage motives, and patient satisfaction”, Journal of the
American Pharmacists Association: JAPhA, Vol. 53 No. 4, pp. 382-389.
Qin, H. and Prybutok, V.R. (2009), “Service quality, customer satisfaction, and behavioral intentions in fast-food restaurants”, International Journal of Quality and Service Sciences, Vol. 1 No. 1, pp. 78-95.
Raja, M.P.N., Deshmukh, S.G. and Wadhwa, S. (2007), “Quality award dimension: a strategic instrument for measuring health service quality”, International Journal of Health Care
Quality Assurance, Vol. 20 No. 5, pp. 363-378.
Ramseook-Munhurrun, P., Naidoo, P. and Lukea-Bhiwajee, S.D. (2009), “Employee perceptions of service quality in a call centre”, Managing Service Quality, Vol. 19 No. 5, pp. 541-557. Ranaweera, C. and Menon, K. (2013), “For better or for worse?: Adverse effects of relationship age
and continuance commitment on positive and negative word of mouth”, European Journal
of Marketing, Vol. 47 No. 10, pp. 1598-1621.
Reidenbach, R.E. and Sandifer-Smallwood, B. (1990), “Exploring perceptions of hospital operations by a modified servqual approach”, Journal of Health Care Marketing, Vol. 10 No. 4, pp. 47-55.
Richardson, P.S., Dick, A.S. and Jain, A.K. (1994), “Extrinsic and intrinsic cue effects on perceptions of store brand quality”, Journal of Marketing, Vol. 58 No. 4, pp. 28-36. Rust, R.T., Zahorik, A.J. and Keiningham, T.L. (1995), “Return on quality (ROQ): making service
quality financially accountable”, Journal of Marketing, Vol. 59 No. 2, pp. 58-70.
Schoenfelder, T., Klewer, J. and Kugler, J. (2011), “Determinants of patient satisfaction: a study among 39 hospital in an in-patient setting in Germany”, International Journal for Quality in
Healthcare, Vol. 23 No. 5, pp. 503-509.
Sherman, S.J. (1980), “On the self- erasing nature of errors of prediction”, Journal of Personality and
Social Psychology, Vol. 39 No. 2, pp. 211-221.
Sivakumar, C.P. and Srinivasan, P.T. (2010), “Relationship between service quality and behavioural outcomes of hospital consumers”, Journal of Management, Vol. 7 No. 2, pp. 63-80.
Sun, L.B. and Qu, H. ( 2011), “Is there any gender effect on the relationship between service quality and word-of-mouth?”, Journal of Travel and Tourism Marketing, Vol. 28 No. 2, pp. 210-224. Tari, J.J. (2005), “Components of successful total quality management”, The TQM Magazine,
Vol. 17 No. 2, pp. 182-191.
Theodorakis, N.D., Alexandris, K., Tsigilis, N. and Karvounis, S. (2013), “Predicting spectators’ behavioural intentions in professional football: the role of satisfaction and service quality”,
Sport Management Review, Vol. 16 No. 1, pp. 85-96.
495
Perceived
healthcare
service quality
Wang, X. (2011), “The effect of inconsistent word-of-mouth during the service encounter”, Journal
of Service Marketing, Vol. 25 No. 4, pp. 252-259.
Wong, A. and Sohal, A. (2002), “Customers’ Perspectives on service quality and relationship quality in retail encounters”, Managing Service Quality, Vol. 12 No. 6, pp. 424-433. Yagci, M.I. and Duman, T. (2011), “Hizmet kalitesi-müs¸teri memnuniyeti ilis¸kisinin hastane
türlerine göre kars¸ılas¸tırılması: devlet, özel ve üniversite hastaneleri uygulaması”, Dog˘us¸
U¨ niversitesi Dergisi, Vol. 7 No. 2, pp. 218-238.
Yang, C.C. (2006), “Establishment of a quality-management system for service industries”, Total
Quality Management and Business Excellence, Vol. 17 No. 9, pp. 1129-1154.
Yesilada, F. and Direktor, E. (2010), “Health care service quality: a comparison of public and private hospitals”, African Journal of Business Management, Vol. 4 No. 6, pp. 962-971. York, R.P. (1993), “The impact of quality, satisfaction, and value in service patronage: a
comprehensive approach using structural equation modeling”, Mississippi State University
Dissertation Abstracts International-A, Vol. 54, p. 4521.
Yu, C.M.J., Wu, L.Y., Chiao, Y.C. and Tai, H.S. (2005), “Perceived quality, customer satisfaction, and customer loyalty: the case of Lexus in Taiwan”, Total Quality Management & Business
Excellence, Vol. 16 No. 6, pp. 707-719.
Zeithaml, V.A., Berry, L.L. and Parasuraman, A. (1988), “Communication and central processes in the delivery of service quality”, Journal of Marketing, Vol. 52, pp. 35-48.
Zeithaml, V.A., Berry, L.L. and Parasuraman, A. (1993), “The nature and determinants of customer expectations of service”, Journal of the Academy of Marketing Science, Vol. 21 No. 1, pp. 1-12.
Zeithaml, V.A., Berry, L.L. and Parasuraman, A. (1996), “The behavioural consequences of service quality”, Journal of Marketing, Vol. 60 No. 2, pp. 31-46.
Zhongjun, T.Z., Chen, X. and Wu, Z. (2010), “Using behavior theory to investigate individual-level determinants of employee involvement in TQM”, Total Quality Management & Business
Excellence, Vol. 21 No. 12, pp. 1231-1260.
Zink, K.J. (2011), “The contribution of quality of work to organizational excellence”, Total Quality
Management & Business Excellence, Vol. 22 No. 5, pp. 567-585.
Further reading
Akinyele, S.T. (2010), “Customer satisfaction and service quality: customer’s re-patronage perspectives”, Global Journal of Management and Business Research, Vol. 10 No. 6, pp. 83-90.
Boulding, W., Kalra, A., Staelin, R. and Zeithaml, V.A. (1993), “A dynamic process model of service quality: from expectations to behavioral intentions”, Journal of Marketing Research, Vol. 30 No. 1, pp. 7-27.
Brahme, A. (2000), “Customer complaints”, Vinimaya, Vol. 21 No. 2, pp. 13-21.
Lang, B. (2011), “How word of mouth communication varies across service encounters”, Managing
Service Quality, Vol. 21 No. 6, pp. 583-598.
Short, P.J. and Rahim, M.A. (1995), “Total quality management in hospitals”, Total Quality
Management, Vol. 6 No. 3, pp. 255-263.
Talib, F., Rahman, Z. and Azam, M. (2011), “Best practices of total quality management implementation in health care settings”, Health Marketing Quarterly, Vol. 28 No. 3, pp. 232-252.
IJQSS
8,4
Yang, C.C. (2003), “The establishment of a TQM system for the health care industry”, The TQM
Magazine, Vol. 15 No. 2, pp. 93-98.
Yap, S.F. and Kew, M.L. (2007), “Service quality and customer satisfaction : antecedents of customer’s re-patronage intentions”, Sunway Academic Journal, Vol. 4 No. 1, pp. 59-73.
About the authors
Aygül Turan is an Assistant Professor at the Business Administration Department, Faculty of Economy and Administrative Sciences, Yildiz Technical University of Istanbul, Turkey. She earned her PhD degree in Management and Organization from School of Business, Istanbul University, in 2013. Her current research topics are green organizational behavior, organizational identity and organizational ethics. Aygül Turan is the corresponding author and can be contacted at:[email protected]
Tuba Bozaykut-Bük is an Assistant Professor of Management at the School of Business and Management Sciences, Istanbul Medipol University. She earned her PhD degree in Management and Organization from Istanbul University in 2014. Her current research topics are organizational identity, organizational change and organizational communication.
For instructions on how to order reprints of this article, please visit our website:
www.emeraldgrouppublishing.com/licensing/reprints.htm
Or contact us for further details:[email protected]